 Open Access Article
Lead-binding biogenic polyelectrolyte multilayer coating for lead retention in perovskite solar cells†
Fabian Körte a,
Cordula Daniela Wessendorf
 *b,
Thomas Schnabel
 b,
Markus Herrmanna,
Birgit Schröppela,
Kathrin Stadelmanna,
Elsa Arefainea,
Luisa Buschb,
Ruben Dauma,
Erik Ahlswedeb and
Hanna Hartmann*a
aNMI Natural and Medical Sciences Institute at the University of Tübingen, Markwiesenstraße 55, 72770 Reutlingen, Germany. E-mail: hanna.hartmann@nmi.de
bZentrum für Sonnenenergie- und Wasserstoff-Forschung (ZSW) Baden-Württemberg, Industriestraße 6, 70565 Stuttgart, Germany. E-mail: cordula.wessendorf@zsw-bw.de
First published on 29th November 2022
Abstract
Perovskite solar cells promise to deliver high efficiencies at low manufacturing costs. Yet on their way towards commercialization, they have to face the associated risk of potential lead leakage into the environment after damage to the cell's encapsulation. Here we present a new approach to generate a lead binding coating, based on a layer-by-layer deposition of biopolymers. A lead-adsorbing functionality was shown after subsequent crosslinking, demonstrating a high binding capacity. The lead binding capabilities could be further enhanced by increasing the thickness of the coatings, analyzed both in the supernatant and on the surface of the coated material. The thin-layered coating had a thickness of less than one micrometer, was stable even under low pH conditions and could successfully be transferred onto different substrates, ranging from silicon, gold and glass substrates to polymeric nonwoven materials with high surface areas, further increasing its lead binding capacity. This newly described coating was applied within perovskite solar cell stacks without impeding the overall efficiency but strongly reducing the amount of lead released after simulated rain tests on devices with damaged encapsulation. Accordingly, incorporation of lead-binding polyelectrolyte multilayers inside the encapsulation of perovskite solar cells shows great potential to limit the perovskite solar cells inherent risk of lead leakage in a sustainable manner.
Introduction
In recent years, thin-film solar cells with perovskite absorbers have attracted considerable attention due to their dramatically fast increase in power conversion efficiency exceeding 25% for single cells and 31% for tandem cells.1 Large-scale perovskite modules with areas between 30 to 60 cm2 by now could even achieve efficiencies of 18.6%.2 But in spite of low production costs and significant improvements to device performance and stability,3–5 potential lead leakage after damage to the cell's encapsulation is still perceived as a major drawback towards perovskite solar cell commercialization due to associated environmental and public health risks.6,7The amount of lead in perovskite solar cells (PSCs) is ∼0.4 g m−2 and a complete release would increase the lead concentration in the underlying soil by 0.7 mg kg−1 (assuming a 30 cm deep layer of soil with a density of 2 g cm−3, related to 600 kg soil).8 At first glance, these numbers seem to be rather low when keeping in mind that natural soils already contain 10–50 mg kg−1 of lead.9,10 However, Li et al. demonstrated that the environmental impact of lead from perovskite absorbers is much higher than other lead contaminants.11 The reason lies in the good solubility of halide perovskites which makes them about ten times more bioavailable and may therefore enter plants and consequently the food cycle far more likely.11
As the perovskite solar cell technology will soon enter the PV market, it is crucial to address the problem of possible lead leakage in the case of encapsulation failure. Up to date, strategies to substitute the lead in perovskite devices right from the beginning have not been successful, since the respective devices are currently not able to compete with their lead containing counterparts in terms of efficiency or stability.12,13 Efforts to mitigate lead exposure therefore focus either on the encapsulation or on embedding lead adsorbing materials inside the cell.13 Methods to modify the encapsulation include among others self-healing polymers14 or lead-adsorbing molecular films containing phosphonic acid groups.15 However, as promising these methods might be, employing them might lead to drastically increased manufacturing costs or the exterior lead adsorbing layers are vulnerable to either saturation or defunctionalization by contaminations in rain and dust.16
We present here a sustainable lead adsorbing thin film strategy, based on the layer-by-layer (lbl) deposition of polyelectrolytes from biological sources. Our Pb adsorbing thin film can be embedded within the solar cell's encapsulation, which should circumvent the aforementioned issues of an exterior lead adsorber. The biopolymers used as polyelectrolytes are widely available and environmentally safe chelation ion exchange materials with the remarkable capability to lower transition metal ion concentrations to part per billion concentrations.17 The lead binding capabilities of the coating could be further enhanced by increasing either the thickness of the polyelectrolyte multilayer (PEM) film or the available surface area of the lead adsorption layer per area. Since the developed lead adsorbing PEM coating can be easily transferred onto a variety of different substrates, the surface area for lead retention was drastically increased by applying the coating to a three dimensional nonwoven polymer scaffold.
Experimental
Materials
Unless stated otherwise, all reagents were purchased from commercial suppliers and used without further purification. Branched polyethyleneimine (PEI, MW ≈ 750 kDa, 50 wt% solution, for the precursor layer), alginic acid (Alg, MW ≈ 12–80 kDa), L-lysine monohydrochloride and poly-L-lysine-FITC labeled (PLL-FITC, MW ≈ 15–30 kDa) were obtained from Sigma Aldrich and used without further treatment and purification. 6,6-Phenyl-C61-butyric acid methyl ester PCBM (Solenne BV (99%)) was dissolved in anhydrous chlorobenzene (99.8%, Sigma Aldrich) to a concentration of 10 mg mL−1. Bathocuproine BCP (Sigma Aldrich) was dissolved in dry ethanol (>99.8%, Roth) to yield a solution of 1 mg mL−1.All solvents used for optical measurements were purchased as analytically pure. Water was purified with a Milli-Q reagent system (ultrapure 18.2 MΩ, Satorius, arium 611VF). Silicon (1 0 0) wafers (p-type, boron) were supplied by CrysTec GmbH and cut into 2 cm × 2 cm pieces. Glass slides (D263 Teco, 1.1 mm) were obtained by Schott. Non-woven polyamide scaffolds were donated by DITF.
Synthesis of hyperbranched polylysin
Hyperbranched polylysin was prepared according to a previously reported procedure.18,19 Briefly, a solution of 200.00 g (1.10 mol) L-lysine monohydrochloride and 44.00 g (1.10 mol) NaOH in 60 mL of dd-H2O was stirred at 160 °C for 24 hours. Afterwards, during the following 24 h, nitrogen was added to the reaction vessel every full hour for five minutes, while the temperature was kept at 160 °C for another 24 h. Then the temperature was lowered to 120 °C while the stirring and hourly addition of nitrogen was continued for another 48 hours. After a total reaction time of four days, the viscous, orange-brown mixture was cooled to room temperature, dissolved in ddH2O and filtered. The filtrate was dialysed (MWCO 3000 g mol−1, ZelluTrans T1 – cellulose dialyze membrane, Carl Roth) against ddH2O for three days. After freeze-drying (Christ) 98.52 g of a slightly yellow solid was obtained.Layer-by-layer PEM coating procedure
If not stated otherwise, the substrates were cleaned by ultrasonification in water, followed by acetone and isopropanol (5 min, each). Afterwards the surfaces were further cleaned and activated in a plasma cleaner (Harrick). The self-assembly of the polyelectrolyte multilayers was performed manually using the LbL technique.20–24 First, an activating monolayer of PEI (0.01 monomer mol L−1 in H2O, pH ∼ 7) was deposited onto the substrate for 10 minutes and rinsed extensively with ultrapure water (3 × 2 minutes). The PEM-assembly on top of the activating monolayer of PEI was performed at room temperature by consecutively dipping the substrates into the alginate (polyanion) or polylysin (polycation) solution (both 1 mg mL−1 in PBS, pH 7.2) for 30 s each. Therefore, the first layer following the activating PEI monolayer and the very last layer of the PEM was alginate. Each respective dip coating step was followed by intermediate washing steps (3 × 10 s). The dipping steps were repeated until the desired number of bilayers (5.5, 15.5, 30.5 or 60.5) were deposited onto the surfaces.Ca-crosslinking of the multilayers
The PEM modified samples were placed in a CaCl2 solution (0.2 M in H2O) for 6 hours. To avoid accidental formation of CaCO3, airtight containers were used and protected from direct light during the crosslinking process. Afterwards, the samples were dried at 60 °C (binder) for 18 hours.Perovskite solution
Perovskite solution for Cs5(FA83MA17)95Pb(I83Br17)3 was prepared in a N2-filled glovebox by dissolving methylammonium bromide (DyeSol), formamidinium iodide (Sigma-Aldrich), lead iodide and lead bromide (both TCI Deutschland GmbH) in dimethyl formamide (99.8%, Sigma-Aldrich) and dimethyl sulfoxide (>99.9%, Sigma-Aldrich) with a volume ratio of 4![[thin space (1/6-em)]](https://www.rsc.org/images/entities/char_2009.gif) :
:![[thin space (1/6-em)]](https://www.rsc.org/images/entities/char_2009.gif) 1 under stirring at 100 °C. After cooling down to r.t., the solution was filtered with a 0.45 μm syringe filter and then a cesium iodide solution (consisting of cesium iodide (>99.9995% from Sigma-Aldrich) in dry dimethyl sulfoxide) was added.
1 under stirring at 100 °C. After cooling down to r.t., the solution was filtered with a 0.45 μm syringe filter and then a cesium iodide solution (consisting of cesium iodide (>99.9995% from Sigma-Aldrich) in dry dimethyl sulfoxide) was added.
Coating procedure for perovskite solar cells
A 3 nm nickel oxide (NiOx) layer was deposited by plasma-enhanced atomic layer deposition on top of ITO glass substrate (VisionTek). The process consisted of alternating cycles of bis(methylcyclopentadienyl)nickel(II) and oxygen-plasma. Afterwards the substrates were cut into pieces of 7.5 × 7.5 cm2 and were plasma etched (Diener electronic, Pico) with argon for 120 s at 30 W and a base pressure of 0.38 mbar. All substrates were transferred into a N2-filled glovebox and the absorber solution was spin coated onto them (10 s at 1000 rpm and 20 s at 6000 rpm). 7 seconds before the spin coating step was finished, 2 mL of chlorobenzene (99.8%, Sigma-Aldrich) were dripped onto the rotating sample for quenching. Then the samples were heated at 100 °C on a hotplate for 1 h under N2-atmosphere. The thickness of the absorber layer was 350–400 nm (determined by SEM). Afterwards, 750 μL of the 60 °C hot PCBM solution was spin coated under N2-atmosphere (34 s at 1000 rpm, 5 s at 4000 rpm), followed by 1000 μL of BCP solution (35 s at 3000 rpm). Before encapsulation, the spin coated layers were removed at the edges by using a cleaning solution consisting of acetone, ethanol, isopropanol and water (75![[thin space (1/6-em)]](https://www.rsc.org/images/entities/char_2009.gif) :
:![[thin space (1/6-em)]](https://www.rsc.org/images/entities/char_2009.gif) 10
10![[thin space (1/6-em)]](https://www.rsc.org/images/entities/char_2009.gif) :
:![[thin space (1/6-em)]](https://www.rsc.org/images/entities/char_2009.gif) 10
10![[thin space (1/6-em)]](https://www.rsc.org/images/entities/char_2009.gif) :
:![[thin space (1/6-em)]](https://www.rsc.org/images/entities/char_2009.gif) 5) and a 5 × 5 cm2 area of perovskite stack remains. The samples for the perovskite solar cells were transferred to a vacuum chamber (Lesker) and a 200 nm thick silver contact was thermally evaporated at a pressure of 10−6 bar. Samples for lead elution tests were used without silver contact.
5) and a 5 × 5 cm2 area of perovskite stack remains. The samples for the perovskite solar cells were transferred to a vacuum chamber (Lesker) and a 200 nm thick silver contact was thermally evaporated at a pressure of 10−6 bar. Samples for lead elution tests were used without silver contact.
Encapsulation procedure for perovskite solar cells
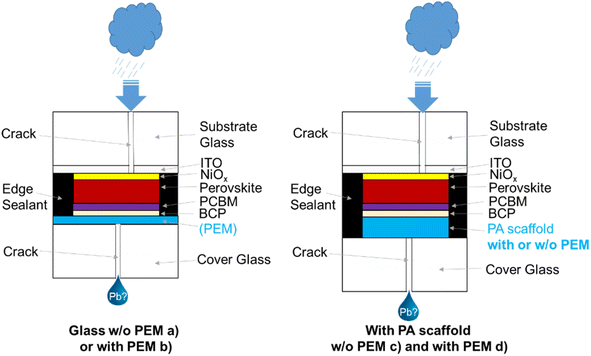
In the case of complete solar cells, alumina stripes were bonded on the electrodes via conductive silver glue as feed through contacts after cell encapsulation with a 1.1 mm thick cover glass of the same size as the substrate. As edge sealant HelioSeal PVS 101 from Kömmerling GmbH was used. Top and bottom glasses of samples for the lead elution tests were cut in two halves before encapsulation to simulate a case of damage of the solar cells. There was 0.5 cm offset between the lines of breakage of the top and the bottom glasses (see Fig. 7). Different encapsulation types were tested: either cover glasses without PEMs or with PEMs, cross-linked by CaCl2 were used. Additionally, for the lead elution tests, in some cases either non-functionalized or PEM-functionalized non-woven polyamide scaffolds of 5 × 5 cm2 size were integrated between the perovskite stack and the cover glass. The samples were laminated for 30 min at 130 °C at a pressure of 0.5 bar in a SPI-laminator 240 from Spire.Lead elution tests of perovskite solar cells with simulated glass-breakage
The samples were mounted with an angle of approximately 45° over a funnel and heated to 60 °C with a heating pad. To simulate rain, the pH value of deionized water was adjusted to 4.5 by using nitric acid. 54.4 mL of this acidic water were dropped within 56 min over the line of the simulated glass-breakage of the substrate glass of the sample with the help of a syringe pump (∼1 mL min−1). The water was collected in a polyethylene vessel. The collection of the water was divided in 4 parts to examine the time-dependence of the lead elution. Then the lead concentration of each vessel was determined photometrically.Instrumentation/characterisation
Scanning electron microscopy
Scanning Electron Microscopy (SEM) was performed on a Zeiss Auriga 40 at a 3 keV acceleration voltage using the secondary electron detector. The SEM was coupled with an energy dispersive X-ray (EDX) detector (Oxford Instruments Ultim Max 100). Prior to the microscopic analysis, the samples were coated with a 10 nm thin layer of gold.Damp heat tests
Damp heat tests were carried out in a climate chamber from Weiss-Technik at 85 °C and 85% r.h. for 100–500 h.QCM-D
For the analysis of PEM build-up, a quartz-crystal microbalance with dissipation monitoring (QCM-D) was employed. A Q-Sense AB instrument equipped with gold coated quartz crystal sensors (Quantum Design) was used. QCM-D is a sensitive technique that measures the changes of oscillation frequency of a quartz crystal when molecules such as polyelectrolytes are absorbed on the crystal surface.25 The measured shift of the resonance frequency (Δf) is directly proportional to the adsorbed mass (Δm) of polyelectrolytes,26 which can be calculated using the Sauerbrey equationwhere C is a constant based on the physical properties of the quartz crystal sensor used (17.7 ng Hz−1 cm−2 for a 5 MHz quartz crystal) and n the overtone number. Prior to use the QCM crystals were cleaned with Hellmanex III (Hellma GmbH & Co. KG) solution. Changes in resonance frequency were monitored until a constant value was reached. After the polyelectrolyte adsorption was accomplished, the chamber was rinsed with buffer solution, thus removing loosely adsorbed polyelectrolyte molecules. When a stable resonance frequency of the crystal was obtained, the polyanion solution was applied into the chamber to form the next polyelectrolyte layer.
Lead absorption characterization
The lead binding capacity in solution was tested with hyperbranched PLL, PLL, sodium alginate (both Sigma-Aldrich) before and after crosslinking with calcium chloride (Rothand active charcoal (VWR)) as positive control. Samples were mixed with 10 mg L−1 lead acetate, pH 5.5 (Alfa Aesar) and incubated for 22 hours at room temperature under slow agitation. After centrifugation at 10![[thin space (1/6-em)]](https://www.rsc.org/images/entities/char_2009.gif) 000 rpm, the supernatant was acidified with 65% HNO3 (Merck). The same procedure was used to quantify lead adsorption of coated and uncoated substrates.
000 rpm, the supernatant was acidified with 65% HNO3 (Merck). The same procedure was used to quantify lead adsorption of coated and uncoated substrates.
The Pb and Ca ion concentrations before and after absorption were confirmed by ICP-OES (Agilent 5100) following DIN EN ISO 11885 2009-09.
Unbound lead in solution was also determined by using a lead quantification kit (ESI Fig. S1†) according to the manufacturer's instructions (Merck) and absorbance was measured at 520 nm, using a UV/vis spectrometer (Jasco). The calibration curve (ESI Fig. S2†) was prepared by diluting lead acetate trihydrate in LC-MS grade water (Merck) from 5 mg L−1 to 0.1 mg L−1 and water for background correction.
Thickness characterization of polyelectrolyte multilayers
The ellipsometric thickness d of the polyelectrolyte multilayers prepared on silicon wafers, were characterised using a spectroscopic ellipsometer (SENpro, SENTECH Instruments GmbH) the measurements were performed at an angle of 60°. The layer thickness was obtained using an optical layer model. Thicknesses of polyelectrolyte multilayers prepared on glass substrates, were characterized using a profilometer (DektakXT, Bruker).Fluorescence microscopy
Fluorescence microscopy was carried out using an epifluorescence microscope (Axiovert 200 M, Zeiss). Fluorescence of labelled samples was quantified using a microplate spectrofluorometer (PHERAstar, BMG LABTECH Gmbh). Fluorescence intensity was quantified by ImageJ.Current voltage analysis
Current voltage analysis was carried out with a WACOM 2-lamp solar simulator (class AAA, AM 1.5G) and a Keithley 2400 current source measure unit. The photoactive area of the solar cells was 0.25 cm2.Statistical methods
Statistical analysis was performed with Graphpad prism (Version 9.3.1). Shapiro Wilk test was applied to test for normality, score values were compared by non-paired t-test, one-way ANOVA or Kruskal–Wallis for non-normal distributed data. P-Values <0.05 were considered statistically significant. Data are represented as mean ± SD. Experiments were performed at least in triplicates.Results & discussion
Assembly of Alg/PLL polyelectrolyte multilayers
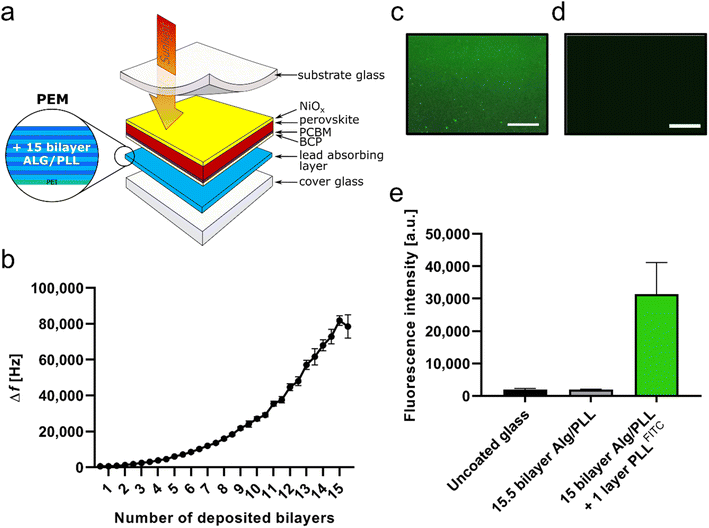
The layer-by-layer-assembly of polyelectrolyte multilayers (PEMs) requires two oppositely charged polyelectrolytes and is applicable on a wide range of substrates.21,27,28 In our search for a suitable pair of polyelectrolytes that not only effectively bind lead but also generate stable multilayers, we compared the lead binding properties of several differently functionalised biopolymers (ESI Table 1†). Our data confirm the previously reported lead binding capabilities of calcium crosslinked alginate (Alg),17 a polyanionic polyelectrolyte that can be employed for the generation of polyelectrolyte multilayers.29–31 In order to maximise the lead binding properties of the resulting PEM we identified hyperbranched polylysine (PLL) as a potential corresponding polycationic polyelectrolyte.For a better adsorption on substrates of the subsequent deposition of the chosen polyelectrolytes Alg and PLL, branched polyethylenimine (PEI) was used as a primer (Fig. 1a).32 The consecutive multilayer assembly of the chosen Alg/PLL polyelectrolyte system was proven by quartz crystal microbalance (QCM) measurements on gold crystals. Fig. 1b shows the normalized frequency shifts (–Δf), which arise during the constant build-up process of 15 multilayers/bilayers (Alg/PLL)15. Further proof of successful multilayer assembly on glass slides coated with 15.5 bilayers with unlabeled PLL and with PLLFITC (green fluorescence), respectively, was evidenced by qualitative monitoring of the deposited multilayer films via fluorescence microscopy (Fig. 1c and d).
Stability of the crosslinked Alg/PLL bilayer system under acidic conditions
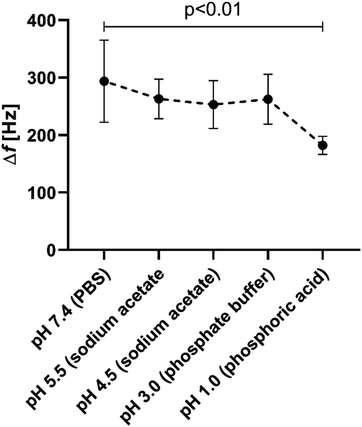
To investigate the stability of the crosslinked Alg/PLL bilayer system against different pH values (simulation of acid rain), further QCM measurements were performed and the mass changes (measured as frequency change) at different pH values were analyzed (Fig. 2). The results show that the system is stable up to pH 3. Only at very low pH values of less than pH 3 the bilayer system became destabilized and degraded (pH 7.4: 294 ± 71 Hz versus pH 1: 182 ± 16 Hz, p < 0.01). According to literature, the pH value of acid rain ranges from 4.0 to 4.6.33,34 Since the applied coating is stable in this pH range, it should be suitable for the planned application in perovskite solar cells.Quantitative analysis of lead adsorbed on the PEM layer
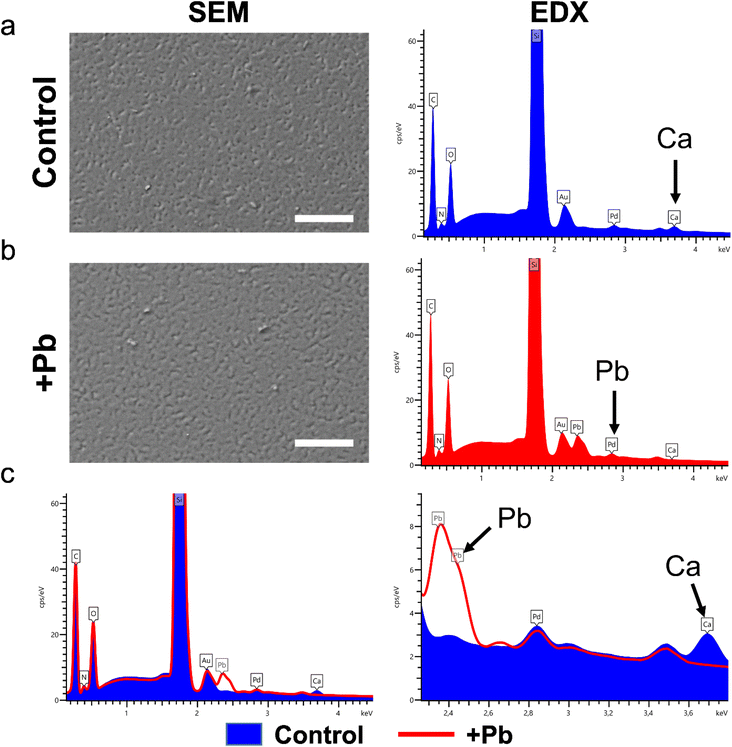
After showing successful multilayer built-up and stability of Alg and PLL on gold substrates and the target material glass, it remained to be tested if the resulting coating displays the same lead binding properties as its individual components in solution. For this purpose, the silicon wafer coated with the bilayer systems were incubated in a lead solution and afterwards scanning electron microscopy (SEM) and an elemental analysis performed (Fig. 3). The SEM images show a homogeneous PEM coating on the silicon wafer (Fig. 3a), which is not affected by lead adsorption (Fig. 3a and b). EDX measurements before lead adsorption showed a distinct calcium peak at 3.7 keV, which can be attributed to the Ca-crosslinking (Fig. 3a and c). After lead adsorption, the calcium peak is decreased. Instead, a prominent peak at 2.4 keV is now visible, which can be assigned to Pb (Fig. 3b and c).Quantification of lead absorption capacity
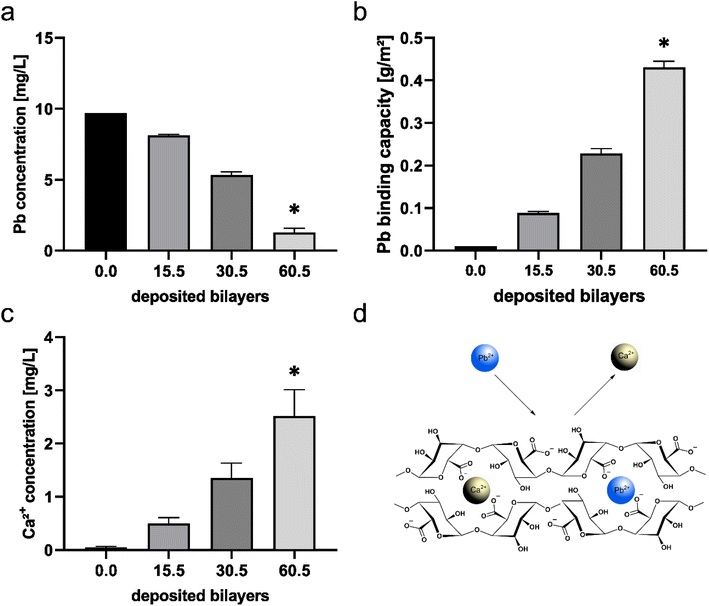
The thickness of the 15.5 Alg/PLL bilayer system, determined by ellipsometry and profilometry revealed 237 ± 27 nm on a silicon wafer (ESI Fig. S3†). Applying twice the number of bilayers, the almost 2-fold increase in coating thickness was observed (415 ± 54 nm). To determine whether the thickness of the bilayer system has an impact on the amount of bound lead, 15.5, 30.5 and 60.5 Alg/PLL bilayer systems were examined with regard to their lead absorption capacity (Fig. 4). For this purpose, the glass slides coated with the bilayer systems were again incubated in a lead solution. The subsequent measurement of the concentration of unbound lead in solution showed a reduced lead concentration with a higher number of deposited bilayers (Fig. 4a). The calculated lead binding capacity significantly increased with a larger bilayer system (Fig. 4b). At the same time, the calcium concentration in the solution increased with the number of bilayers (Fig. 4c) suggesting that there is an ion exchange in the cross-linked alginate layer from Ca2+ to Pb2+ (Fig. 4d). This is backed up by similar observations reported in literature for lead-binding of alginates also claiming this mechanism is a complex combination of ion exchange and chemical coordination processes very similar to the processes present in macroalgae.17,35–37Transfer of the lead binding PEM system on non-woven polyamide scaffolds
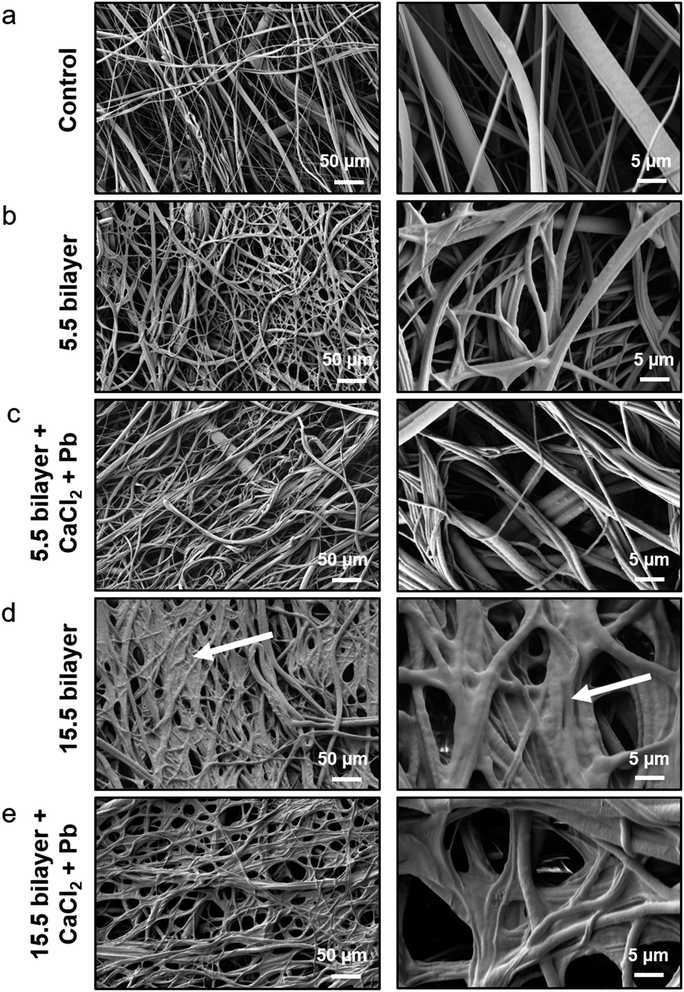
Using 60.5 bilayers, the targeted unit area concentration of 0.5 g m−2 of lead could not be fully achieved. To further increase the lead binding capacity, it was necessary to increase the surface area of the lead adsorption layer per area. This was made possible by using a non-woven polyamide scaffold. In a first step, SEM imaging was used to study the morphology of the scaffolds before and after 5.5 and 15.5 Alg/PLL bilayer deposition and after lead binding (Fig. 5). The fiber and pore structure of the 5.5-bilayer system is not affected by the PEM coating. In the 15.5-bilayer system, the pores are covered and the fibers show a changed morphology (Fig. 6d, white arrows), which indicates the PEM double layer.Quantification of lead absorption capacity on the non-woven polyamide scaffolds
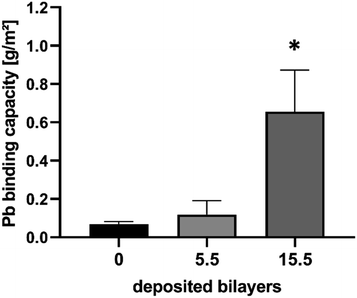
In order to prove whether the PEM coated non-woven scaffold can achieve the desired unit area concentration of 0.5 g m−2 lead, the lead binding capacity was examined on both the 5.5 and 15.5 Alg/PLL bilayer system (Fig. 6). While on the 5.5 bilayer coated scaffold, only 0.1 g m−2 of lead was bound, the 15.5 bilayer system revealed a binding capacity of 0.7 g m−2 lead. This means that the 15.5 bilayer system on a non-woven polyamide scaffold should have a sufficient lead binding capacity to completely prevent lead leakage in case of a broken perovskite solar module. After achieving this requirement, in the following, the lead binding layers were tested in real encapsulated perovskite samples.On-device Pb-sequestration capability
To proof if the developed lead-binding PEMs have any impact on the solar cell parameters, glasses coated with CaCl2-cross-linked PEMs were used as cover glasses for encapsulation of perovskite solar cells. The architecture of the investigated perovskite solar cells was glass/ITO/NiOx/Cs5(MA17FA83)PbI83Br17/PCBM/BCP/Ag. The encapsulation procedure is described in the ESI Fig. S4.† No negative impact of the PEMs on the perovskite solar cell performance was found, neither for freshly prepared nor for samples after damp heat tests (ESI Fig. S5 and S6†). Photographs of samples before and after damp heat test are shown in ESI Fig. S7.† After 500 h of damp heat test, thin yellow stripes next to the silver contacts can be seen for samples without and with PEM encapsulation, indicating some humidity entry for both constructs, independent of the coating.Next, we investigated, if the desired Pb-binding capacity of the PEMs works in a worst-case scenario, where the encapsulation glass of the perovskite solar cell is damaged, and rain can wash out the contained lead. To test this, perovskite solar cells were fabricated on 7.5 × 7.5 cm2 substrates similarly as described for the cells in the ESI Fig. S4,† but after removal of the coating at the edges, the substrate glass was broken in the middle and laminated with a broken cover glass (ESI Fig. S8†). To maintain the mechanical stability of the device, the two cracks had a lateral shift of 0.5 cm.
Four different types of samples were investigated: (a) with non-functionalized cover glass, (b) with PEM-coated cover glass, (c) with integrated polyamide scaffold without Pb-binding functionalization, (d) with PEM-functionalized polyamide scaffold (Fig. 7).
These samples were positioned in an angle of 45° on a hot pad (with 60 °C to simulate the conditions of a solar cell in operation) and water with a pH of 4.5 was dropped with ∼1 mL min−1 along the site of breakage of the substrate glass to simulate rain (ESI Fig. S11†). Two stripes of Kapton tape were placed ∼2–3 mm next to the line of breakage to control the flow direction of the drops.
First, the samples with non-functionalized cover glass and with PEM-coated cover glass were investigated. Within a few minutes, the colour of the perovskite along the line of fracture changed from brown to yellow, indicating the back-reaction of perovskite to lead iodide.8 After 56 minutes, the water dripping was stopped and the collected water was analysed, using lead cuvette tests. In Table 1 exemplary photographs of samples (other samples see ESI Fig. S10†) each without and with PEM-coating after the rain simulation are shown and the amount of eluted lead is given.
It can be seen that samples with Pb-binding cover glass and with uncoated glass look very similar: only a small area of the perovskite is degraded (along the crack of the glass). The analysis of the lead content in the water samples revealed that on average the samples without Pb-binding functionalization show an 8-times higher lead elution (3.9 μg) than samples with PEM-functionalization (0.5 μg). However, the standard deviation is relatively high; this might be due to either differences in the grade of crystallinity of the samples (a more “perfect” crystal should be harder to be destroyed) or due to variation in the gap width of the broken glasses. The gap widths of all samples were measured with a 3D microscope, but no correlation was found.
In contrast, samples with integrated polyamide scaffolds, either without Pb-binding functionalization or with PEM-functionalization are fully degraded. Samples with PEM-functionalized polyamide scaffold look all whitish after the rain simulation test (although the color turned first into yellow during the test and then turned into white, see ESI Fig. S11†) and show a very narrow standard deviation in lead elution. With uncoated polyamide scaffold, the samples turned from brown into yellow-white, only one sample remained mostly unchanged and shows only narrow yellow stripes along the two crack lines of substrate and cover glass, respectively (ESI Fig. S10†). Therefore, the amount of eluted lead is also very variable. From the strongly degraded samples more than 100-times (125 μg) or 25-times (30 μg), respectively, of lead are eluted compared to the mostly unchanged sample (1.1 μg). However, in comparison of samples with PEM-functionalized polyamide scaffold, samples with non-functionalized polyamide scaffold show in average a nearly 25-times higher elution of lead (52 μg) than samples with PEM-functionalized polyamide scaffold.
We assume that the polyamide scaffold acts as a sponge and pulls the water inside the encapsulation, which leads to a rapid and strong degradation of the perovskite layer across the whole area of 25 cm2 (with exception of sample V124, which has a slightly narrower crack width inside the substrate glass). Clearly visible yellow PbI2 is formed and in case of the PEM-functionalized polyamide scaffold, the Pb2+ is exchanged with Ca2+ when it gets in contact with the alginate functional groups (Fig. 4d) and white CaI2 is formed.
It has to be mentioned, that PbI2 has a solubility product of ∼10−8,8 therefore a lot of PbI2 remains inside the sample in the case of non-functionalized polyamide scaffold and leads to the yellow appearance. The fact that samples appear less yellow corresponds well with the fact that more Pb (= more PbI2) is eluted.
Our investigated perovskite samples have an absorber thickness of 350–400 nm and have a mixed-cation composition (Cs5(FA83MA17)95Pb(I83Br17)3), the calculated maximum amount of Pb is ∼51 μg cm−2 (this corresponds well to the literature,8 for perovskite solar cells with a 300 nm thick CH3NH3PbI3-absorber a value of approximately 0.4 g Pb m−2 (corresponding to 40 μg cm−2) is given). As our samples have a coated area of 25 cm2, they should contain approximately 1275 μg Pb in total.
As it can be seen in Table 1, the eluted amount of Pb is 10% at most of the overall amount of Pb without functionalized PA-scaffold (4.1% in average for all three samples). In contrast, for samples with PEM-functionalized PA-scaffolds, the eluted amount of Pb is only 0.17%, which is 24-times lower.
In the case of the samples without polyamide scaffold, much less Pb was eluted: only 0.31% of the overall Pb content for samples without coating and 0.04% for samples with PEM coating. However, for these samples only a narrow area (few mm in width) of the perovskite absorber along the crack line was destroyed and most of the perovskite area was still intact. Therefore, for these samples a smaller area has to be taken as reference. We measured 0.5–1.0 mm on both sides of the crack which leads to an optically degraded area of 0.5–1.0 cm2 (see ESI Fig. S10†). Taken this into account, the eluted Pb for samples without PEM-functionalization is 9.6% of the total Pb content which is more than double than the value of 4.3% for samples with non-functionalized PA-scaffold. For samples with PEM-functionalized cover glass the eluted Pb was with 2.9% of the total Pb content 3-times lower than for the non-functionalized glass samples but 17-times higher than samples with PEM-functionalized PA-scaffold.
Conclusion
Despite of low production costs and high power conversion efficiency, potential lead leakage after damage is still a burden for perovskite solar cell commercialization. To overcome this, we developed a new lead-binding biogenic polyelectrolyte multilayer coating. Our research results show efficient Pb binding and successful transfer on different materials, relevant for solar cell build-up. Applicability was further proven in a simulated rain test, where we have successfully demonstrated that in a worst-case scenario of the perovskite solar cell's encapsulation breakage, the elution of Pb can be strongly reduced by a factor of 3 by using cover glasses coated with the new lead-binding biogenic PEM-coating. The PEM functionalization of the polyamide scaffolds also drastically reduces the lead elution even by a factor of 25 due to the larger volume and surface area compared to simple glass coatings. Taken together, our data show the potential of the new Pb-binding coating for perovskite solar cells, applicable either directly on cover glass or on non-wovens to further increase the potential lead retention area.Author contributions
Fabian Körte contributed to methodology, conceptualization, investigation, data curation and writing the original article. Cordula Daniela Wessendorf contributed to conceptualization, investigation, collection of data, writing the article and funding acquisition. Thomas Schnabel contributed to conceptualization, investigation, collection of data, reviewing and editing the manuscript and designed the rain simulator. Markus Herrmann, Birgit Schröppel, Kathrin Stadelmann, Elsa Arefaine and Luisa Busch contributed to analysis and collection of data. Ruben Daum contributed to data curation, reviewing and editing the manuscript. Luisa Busch contributed to analysis, collection of data and designing of figures. Erik Ahlswede contributed to conceptualization, reviewing and editing the manuscript, and supervision. Hanna Hartmann contributed to conceptualization, reviewing and editing the article, funding acquisition, and supervision.Conflicts of interest
There are no conflicts to declare.Acknowledgements
The authors thank Tobias Walczuch, NMI for his technical assistance. Non-woven polyamide scaffolds were kindly provided by Prof. Michael Buchmeiser, Dr Martin Dauner and Marc Philipp Vocht, DITF, Denkendorf and ICP-OES measurements were performed by Dr Martin Völker and Dr Daniela Lehr, fem, Schwäbisch Gmünd. Dr Oliver Salomon, ZSW, supported the encapsulation process and damp heat tests. This work was financially supported by the Ministry of Economic Affairs, Labour and Tourism of Baden-Württemberg (AZ 3-4332.62-ZSW/55).References
- Best Research-Cell Efficiency Chart, cited 2021, available from, https://www.nrel.gov/pv/cell-efficiency.html.
- Y. Deng, et al., Defect compensation in formamidinium–caesium perovskites for highly efficient solar mini-modules with improved photostability, Nat. Energy, 2021, 6(6), 633–641 CrossRef CAS.
- A. Culu, I. C. Kaya and S. Sonmezoglu, Spray-Pyrolyzed Tantalium-Doped TiO2 Compact Electron Transport Layer for UV-Photostable Planar Perovskite Solar Cells Exceeding 20% Efficiency, ACS Appl. Energy Mater., 2022, 5(3), 3454–3462 CrossRef CAS.
- İ. C. Kaya, et al., A dopant-free 2,7-dioctyl[1]benzothieno[3,2-b][1]benzothiophene (C8-BTBT)-based hole transporting layer for highly stable perovskite solar cells with efficiency over 22%, J. Mater. Chem. A, 2022, 10(23), 12464–12472 RSC.
- R. Sharma, et al., Stability and efficiency issues, solutions and advancements in perovskite solar cells: a review, Sol. Energy, 2022, 244, 516–535 CrossRef CAS.
- S.-Y. Bae, et al., Hazard potential of perovskite solar cell technology for potential implementation of “safe-by-design” approach, Sci. Rep., 2019, 9(1), 4242 CrossRef PubMed.
- F. Meng, et al., Environmental risks and strategies for the long-term stability of carbon-based perovskite solar cells, Mater. Today Energy, 2021, 19, 100590 CrossRef CAS.
- B. Hailegnaw, et al., Rain on Methylammonium Lead Iodide Based Perovskites: Possible Environmental Effects of Perovskite Solar Cells, J. Phys. Chem. Lett., 2015, 6(9), 1543–1547 CrossRef CAS PubMed.
- Lead in Residential Soils: Sources, Testing, and Reducing Exposure, cited 2021; available from, https://extension.psu.edu/lead-in-residential-soils-sources-testing-and-reducing-exposure.
- E. Merian, Metalle in der Umwelt – Verteilung, Analytik und biologische Relevanz, Wiley-VCH, 1984 Search PubMed.
- J. Li, et al., Biological impact of lead from halide perovskites reveals the risk of introducing a safe threshold, Nat. Commun., 2020, 11(1), 310 CrossRef CAS PubMed.
- W. Ke and M. G. Kanatzidis, Prospects for low-toxicity lead-free perovskite solar cells, Nat. Commun., 2019, 10(1), 965 CrossRef PubMed.
- S. Ma, et al., Development of encapsulation strategies towards the commercialization of perovskite solar cells, Energy Environ. Sci., 2022, 15(1), 13–55 RSC.
- Y. Jiang, et al., Reduction of lead leakage from damaged lead halide perovskite solar modules using self-healing polymer-based encapsulation, Nat. Energy, 2019, 4(7), 585–593 CrossRef CAS.
- X. Li, et al., On-device lead sequestration for perovskite solar cells, Nature, 2020, 578(7796), 555–558 CrossRef CAS PubMed.
- S. Chen, et al., Preventing lead leakage with built-in resin layers for sustainable perovskite solar cells, Nat. Sustain., 2021, 4(7), 636–643 CrossRef.
- J. R. Deans and B. G. Dixon, Uptake of Pb2+ and Cu2+ by novel biopolymers, Water Res., 1992, 26(4), 469–472 CrossRef CAS.
- C. H. Ho and J. C. Tiller, Novel synthesis routes towards polylysines, Polym. Mater. Sci. Eng., 2007, 97, 553–554 CAS.
- J. C. Tiller and C. H. Ho, Hyperbranched polylysine-synthesis, characterization and applications, Polym. Mater. Sci. Eng., 2010, 102, 13965–13966 Search PubMed.
- T. D. Andreeva, et al., Regulation of the growth, morphology, mechanical properties and biocompatibility of natural polysaccharide-based multilayers by Hofmeister anions, J. Mater. Chem. B, 2016, 4(44), 7092–7100 RSC.
- H. Hartmann, et al., Hyaluronic acid/chitosan multilayer coatings on neuronal implants for localized delivery of siRNA nanoplexes, J. Controlled Release, 2013, 168(3), 289–297 CrossRef CAS PubMed.
- H. Hartmann and R. Krastev, Biofunctionalization of surfaces using polyelectrolyte multilayers, BioNanoMaterials, 2017, 18(1–2), 20160015 Search PubMed.
- G. Decher, Fuzzy Nanoassemblies: Toward Layered Polymeric Multicomposites, Science, 1997, 277(5330), 1232–1237 CrossRef CAS.
- G. Decher, J. D. Hong and J. Schmitt, Buildup of ultrathin multilayer films by a self-assembly process: III. Consecutively alternating adsorption of anionic and cationic polyelectrolytes on charged surfaces, Thin Solid Films, 1992, 210–211, 831–835 CrossRef CAS.
- M. Elzbieciak, et al., Influence of pH on the Structure of Multilayer Films Composed of Strong and Weak Polyelectrolytes, Langmuir, 2009, 25(5), 3255–3259 CrossRef CAS PubMed.
- G. Sauerbrey, Verwendung von Schwingquarzen zur Wägung dünner Schichten und zur Mikrowägung, Z. Phys., 1959, 155(2), 206–222 CrossRef CAS.
- R. Krastev, et al., Polyelectrolyte Coatings for Surface Modification of Medical Implants, Current Directions in Biomedical Engineering, 2018, 4(1), 217–220 CrossRef.
- L. Séon, et al., Polyelectrolyte Multilayers: A Versatile Tool for Preparing Antimicrobial Coatings, Langmuir, 2015, 31(47), 12856–12872 CrossRef PubMed.
- H. Yang, et al., Chemo-photodynamic combined gene therapy and dual-modal cancer imaging achieved by pH-responsive alginate/chitosan multilayer-modified magnetic mesoporous silica nanocomposites, Biomater. Sci., 2017, 5(5), 1001–1013 RSC.
- X. Yin, et al., Alginate/chitosan multilayer films coated on IL-4-loaded TiO(2) nanotubes for modulation of macrophage phenotype, Int. J. Biol. Macromol., 2019, 132, 495–505 CrossRef CAS PubMed.
- J. Zhou, et al., Layer by layer chitosan/alginate coatings on poly(lactide-co-glycolide) nanoparticles for antifouling protection and folic acid binding to achieve selective cell targeting, J. Colloid Interface Sci., 2010, 345(2), 241–247 CrossRef CAS PubMed.
- M. KolasjDska, R. Krastev and P. WarszzDski, Characteristics of polyelectrolyte multilayers: effect of PEI anchoring layer and posttreatment after deposition, J. Colloid Interface Sci., 2007, 305(1), 46–56 CrossRef PubMed.
- A. Singh and M. Agrawal, Acid rain and its ecological consequences, J. Environ. Biol., 2008, 29(1), 15–24 CAS.
- Saurer Regen: Ein Überblick, 2018, cited 2021, available from, https://www.aces.edu/blog/topics/other-resources-water/acid-rain-an-overview/.
- Y. Dong, et al., Mxene/alginate composites for lead and copper ion removal from aqueous solutions, RSC Adv., 2019, 9(50), 29015–29022 RSC.
- W. Plazinski, Sorption of lead, copper, and cadmium by calcium alginate. Metal binding stoichiometry and the pH effect, Environ. Sci. Pollut. Res., 2012, 19(8), 3516–3524 CrossRef CAS PubMed.
- O. Raize, Y. Argaman and S. Yannai, Mechanisms of biosorption of different heavy metals by brown marine macroalgae, Biotechnol. Bioeng., 2004, 87(4), 451–458 CrossRef CAS PubMed.
Footnote |
| † Electronic supplementary information (ESI) available. See DOI: https://doi.org/10.1039/d2ra05692e |
| This journal is © The Royal Society of Chemistry 2022 |


