 Open Access Article
Creative Commons Attribution 3.0 Unported Licence
Nitrogen defect-containing polymeric carbon nitride for efficient photocatalytic H2 evolution and RhB degradation under visible light irradiation†
Man Li‡
,
Xin Bai‡ ,
Xi Rao
 ,
Shaohui Zheng
 * and
Yongping Zhang
 *
*
School of Materials and Energy, Southwest University, Chongqing 400715, China. E-mail: shaohuizheng@swu.edu.cn; zhangyyping6@swu.edu.cn
First published on 31st August 2022
Abstract
Introducing defects in polymeric carbon nitride (CN) in a predetermined way is a great challenge to explicate the effect of defects on the photocatalytic activity. Herein, we provide a pathway to synthesize g-C3N4 with nitrogen defects by simply calcining melamine and trithiocyanuric acid at elevated temperature. Nitrogen defects at the N-bridging sites lead to an intermediate energy gap between the valence band and the conduction band, which greatly increases the photon absorption in the visible light range. Electron paramagnetic resonance (EPR) and photoluminescence (PL) verify that the significantly improved light utilization efficiency and rapid charge transfer correlate with nitrogen defects. The hydrogen evolution rate of 2SCN reached 41.4 μmol h−1, about 20.7 times that of pure g-C3N4, and its degradation rate for rhodamine B (RhB) is about 2.5 times that of CN. The experimental results proved that the photoinduced electron–hole pairs react with adsorbed O2 to form ˙O2−, facilitating the photodegradation of organic pollutants.
1. Introduction
Polymeric carbon nitride (g-C3N4), a direct band gap semiconductor with a two-dimensional graphene like structure, is considered to be one of the most promising materials in photocatalytic pollutant degradation and photocatalytic hydrogen evolution via water splitting due to its high stability, low cost, non-toxicity, environmental friendliness and appropriate band gap.1–3 However, some shortcomings, such as the small specific surface area, high recombination rate of photogenerated electrons/holes and low absorption efficiency of visible light, restricted the pristine polymeric carbon nitride in photocatalytic application. Many perspectives were explored to improve its photocatalytic activity, including element doping,4–6 forming semiconductor heterojunctions,7 engineering defects in catalysts,8 and metal cluster loading.9It has been proved that the construction of defects in g-C3N4 can promote the transmission of charge carriers, so as to effectively enhance the photocatalytic activity. According to previous studies, it is found that higher specific surface area can be obtained after strong acid treatment, which increases the number of active sites.10,11 Recently, many workers found that polymeric carbon nitride with defective structure can be obtained by treating the precursor of polymeric carbon nitride with the weak reducibility of organic acid with weak acidity.12 It can not only increase the specific surface area, but also produce defects, which is conducive to the utilization of charge carriers.13 According to different preparation methods, carbon defects or nitrogen defects can be obtained,14,15 which will also form a sub band gap, so as to greatly expand the optical response and improve the survival elapse of photogenerated carriers. Moreover, defects can induce greater specific surface area and pore structure, increase light absorption area and improve light absorption capacity,16,17 which are conducive to photocatalytic reaction. At molecular scale, the defect origin and site were not well established in those studies. Further experimental and theoretical explorations were needed to understand defect structure and its effect on photocatalytic activity.
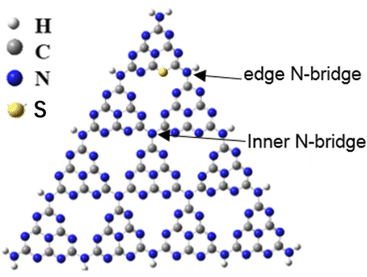
The crystallinity, degree of polymerization, defect formation of C3N4 molecular structure exhibit profound effect on its photocatalytic performance. Our recent study revealed that nitrogen defects in polymeric carbon nitride molecules by cutting the network nodes is the main factor to enhance the photocatalytic performance, besides the crystallinity and polymerization degree.18 Some literature reported that nanostructured and S-doping g-C3N4 catalysts were prepared with similar co-polymerization method by calcining melamine and trithiocyanuric acid, and ascribed the enhanced photocatalytic performance to synergetic effect of extended light absorption and more catalytic sites.19–21 However, the detailed molecular structure of g-C3N4 remained unexplored. How to isolate the solitary defect factor and study its effect on photocatalytic activity is especially important for understanding the mechanism of defects. There exist two kind of sp3 tertiary N–[C]3 nitrogen vacancies, inner N-bridge vacancies characterized the N defects and edge N-bridge vacancies increased the amino group C–NHx, as shown in Scheme 1. We proposed a pathway to introduce nitrogen vacancy in the sp3 N–[C]3 linkage by calcining melamine and trithiocyanuric acid, in order to clarify the effect of nitrogen defect on the photocatalytic enhancement.
In this work, a series of g-C3N4 with nitrogen defects and pore structure were prepared by simple thermal condensation of melamine and trithiocyanuric acid. Due to the increase of reaction active sites and abundant defect structures, the photocatalytic activity of the samples has been greatly improved.
2. Experimental details
2.1 Reagents
Melamine (C3H6N6, 99%), and trithiocyanuric acid (C3H3N3S3, 95%) were purchased from Sinopharm Chemical Reagent Co. Ltd. All chemicals were analytical grade and used without further purification. Deionized water was used throughout this study.2.2 Catalyst preparation
0.01 mol melamine and different amount of trithiocyanuric acid (0.0075 mol, 0.01 mol, 0.0125 mol) were dissolved in 60 ml deionized water under ultrasonic stirring for 12 h, then dried in an oven at 60 °C for 3 h. The dried precipitates were heated at 600 °C for 2 h in a tubular furnace at N2 environment, with a ramp rate of 3 °C min−1, respectively. Accordingly, the catalysts were denoted as 1SCN, 2SCN and 3SCN for trithiocyanuric acid of 0.0075 mol, 0.01 mol, and 0.0125 mol, respectively. 0.01 mol melamine was heated at 600 °C for 2 h through a similar process without adding trithiocyanuric acid to obtain the pure g-C3N4, denoted as CN.2.3 Characterization
Morphologies and structures were observed using a thermal field emission scanning electron microscope (FESEM, JSM-7800F), transmission electron microscope (TEM, Zeiss Libra 200FE), and X-ray diffraction (XRD, Shimadzu XRD7000) with Cu Kα as radiation source (λ = 1.5418 Å). The vibration state of chemical states were measured by Fourier transform infrared spectroscopy (FTIR, Model Frontier), X-ray photoelectron spectroscopy (XPS, VG ESCALAB 250Xi) with radiation source of Al Kα (hν = 1486.8 eV). The UV-vis diffuse reflectance spectra were performed on an Agilent Cary 5000 UV-vis NIR system with 100% BaSO4 as the reflection sample. The photoluminescence (PL) spectra were recorded on a Hitachi F-7000 spectrophotometer with a 150 W xenon light as the excitation source. N2 adsorption–desorption isotherms were carried out on a Quadrasorbevo 2QDS-MP-30 specific surface area tester (BET, Quadrasorbevo 2QDS-MP-30). The transient photocurrent response curve (I–t), Mott–Schottky curve, electrochemical impedance spectroscopy (EIS) were performed using AUTOLAB (model PGSTAT302N) electrochemical workstation. A 500 W xenon lamp was used as the light source, and 0.25 M Na2SO4 solution as the electrolyte. Free radical trapping experiments were carried out on electron paramagnetic resonance (EPR) spectrometer (Bruke, EMXnano) with 420 nm LED as excitation source.2.4 Photocatalytic hydrogen evolution
The photocatalytic hydrogen evolution evaluation was carried out in a photocatalysis evaluation system (Suncat Instrument, Beijing). The 500 W Xe lamp (zolix, gloria-x500a) with intensity of 110 mW cm−2 was used as the simulated solar light with a wavelength λ ≥ 420 nm. The reactor was maintained at 20 °C with an external circulation cooling system. 10 mg photocatalyst was dispersed in 30 ml aqueous solution with 17 vol% triethanolamine (TEOA) as sacrificing agent and 3 wt% Pt ion (H2PtCl6 H2O) as co-catalyst. Before turning on the light, the reactor is pumped to a high vacuum of 10−8 torr, and then filled with argon. Under the light irradiation process, the reaction suspension is stirred continuously. 1 ml of gas was extracted automatically from the reactor at interval of 30 min, and analyzed with a gas chromatograph (GC-2018, Shimadzu) with TDX-01 molecular sieve, thermal conductivity detector and Ar carrier gas.2.5 Photocatalytic removal of rhodamine B (RhB)
10 mg photocatalyst was dispersed in 60 ml rhodamine B aqueous solution (25 mg L−1). The light source was a 300 W HSX-F300 xenon lamp. The solution was kept in the dark for 30 min to reach the adsorption equilibrium. Then the solution was exposed to visible light for degradation. At 3 min interval, 1 ml suspension was taken out and centrifuged, and measured the characteristic UV-vis absorption spectra. The maximum absorption peak was recorded and used to evaluate the concentration of RhB. The degradation rate of RhB aqueous solution at time t can be calculated by the following formula:| Degradation rate = (1 − Ct/C0) × 100% |
3. Results and discussion
Catalysts 1SCN, 2SCN, and 3SCN presents a similar XRD patterns as CN, shown in Fig. 1 (a), in which the strong peak at 27.3° is attributed to the (002) diffraction plane of the interplanar stacking of conjugated aromatic units, and the weak (100) at 13.1° is associated with the in-plane repeated motif of the tri-s-triazine ring.22–25 Detailed analyses revealed the intensity of the (002) diffraction peaks for SCN decreases dramatically compared to CN with introducing nitrogen defects and S doped g-C3N4, which indicates that introducing certain amount of nitrogen defects reduces the compactness of repeating layers. EPR signals in Fig. 1(b) showed the obvious symmetrical peak with g = 2.0038, characterizing the density of nitrogen defects. The weak signal for pure CN is caused by the unpaired C atom in the aromatic heterocycles in g-C3N4.26 As for SCN, the signal for unpaired electronic augments drastically, indicating the increase nitrogen defects. With the increase of ratio of trithiocyanuric acid, the nitrogen defect content increases accordingly, then reaches a plateau at certain point, further increase the defects means more missing the edge N-bridge atoms, thus explains that 2SCN has highest defects density. N2 adsorption–desorption isotherms in Fig. 1(c) depicted that all catalysts exhibit a typical type IV isotherm with a H3 hysteresis loop, indicating the presence of mesopores.27 The specific surface area is 23.2 m2 g−1, 65.3 m2 g−1, 70.8 m2 g−1, and 54.6 m2 g−1, for CN, 1SCN, 2SCN, and 3SCN, respectively. That indicates that the introducing nitrogen defects have a significant effect on the specific surface area of the samples, and 2SCN with highest specific surface area among all samples. The total pore volume is 0.16 m3 g−1, 0.32 m3 g−1, 0.38 m3 g−1, and 0.22 m3 g−1, for CN, 1SCN, 2SCN, and 3SCN, respectively. The corresponding mesoporous distribution of the sample is shown in Fig. 1(d). The mesoporous size is mainly distributed in the range of 2–6 nm. The mesoporous distribution on the material surface helps to increase the specific surface area of the material and enhance the photocatalytic activity. The presence of mesopores favors multiple light scattering/reflection, resulting in enhanced harvesting of the exciting light and thus improved photocatalytic activity.28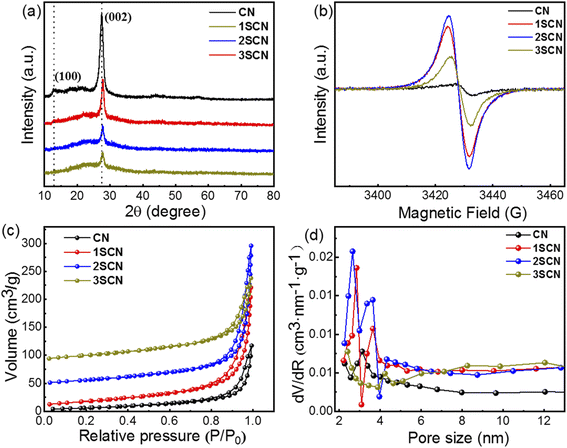 | ||
| Fig. 1 XRD patterns (a), EPR spectra (b) BET isotherms (c) and pore size distribution (d) of CN and SCN at different nitrogen defects. | ||
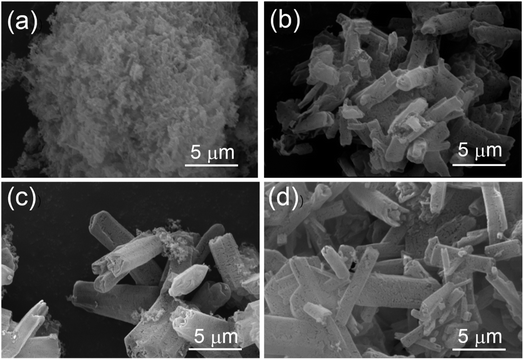
SEM images in Fig. 2(a) showed that the pure g-C3N4 appeared as the stacked bulk structures. SCN appeared as irregular nanorods with length of around 5 μm and diameter around several hundred micrometers. There existed many microporous features and small cracks, the density of micro-cracks and pores on the surface of the samples increase, as shown in Fig. 2(b–d). That is consistent with the BET data.
XPS survey spectra in Fig. 3(a) showed there exist the C 1s, and N 1s signals, and the signal for S is almost illegible. XPS N 1s spectra in Fig. 3(b) could be fitted into three peaks with binding energy at 398.5 eV, 399.7 eV, 400.8 eV, corresponding to sp2 aromatic N atoms in aromatic tri-s-triazine C–N skeleton (N1, C–N![[double bond, length as m-dash]](https://www.rsc.org/images/entities/char_e001.gif) C), sp3 hybrid tertiary amine N atoms (N2, N–[C]3), amino functional groups at the edge of the aromatic ring plane (N3, C–NHx).29–32 XPS S 2p spectra in Fig. 3(c) showed the S atoms mainly exist in one state with binding energy of 163.1 eV, corresponding to the C–S bond formed by substituting N atom in the aromatic tri-s-triazine. The S atomic ratio remains relatively low for samples 1SCN, 2SCN, and 3SCN, indicating only fractional S atoms were doped in g-C3N4. There exist two kind of sp3 tertiary N–[C]3 nitrogen vacancies, inner N-bridge vacancies characterized the N defects and edge N-bridge vacancies increased the amino group C–NHx. The percentage of N-containing species is listed in Table 1. With the increase of trithiocyanuric acid, the percentage of N atoms in amino groups (N3, C–NHx) increases gradually, and the ratio of N–[C]3 nitrogen decreases accordingly. The percentage of the bridging tertiary N atoms (N2, N–[C]3) decrease, indicating some tertiary N atoms are missing to form nitrogen defects located at the tertiary nitrogen lattice sites.18 The inner N-bridge vacancies are related to the N defects, and formation of edge N-bridge vacancies induces the additional NHx group. That explains why 2SCN has highest content of N defects observed in EPR spectra.
C), sp3 hybrid tertiary amine N atoms (N2, N–[C]3), amino functional groups at the edge of the aromatic ring plane (N3, C–NHx).29–32 XPS S 2p spectra in Fig. 3(c) showed the S atoms mainly exist in one state with binding energy of 163.1 eV, corresponding to the C–S bond formed by substituting N atom in the aromatic tri-s-triazine. The S atomic ratio remains relatively low for samples 1SCN, 2SCN, and 3SCN, indicating only fractional S atoms were doped in g-C3N4. There exist two kind of sp3 tertiary N–[C]3 nitrogen vacancies, inner N-bridge vacancies characterized the N defects and edge N-bridge vacancies increased the amino group C–NHx. The percentage of N-containing species is listed in Table 1. With the increase of trithiocyanuric acid, the percentage of N atoms in amino groups (N3, C–NHx) increases gradually, and the ratio of N–[C]3 nitrogen decreases accordingly. The percentage of the bridging tertiary N atoms (N2, N–[C]3) decrease, indicating some tertiary N atoms are missing to form nitrogen defects located at the tertiary nitrogen lattice sites.18 The inner N-bridge vacancies are related to the N defects, and formation of edge N-bridge vacancies induces the additional NHx group. That explains why 2SCN has highest content of N defects observed in EPR spectra.
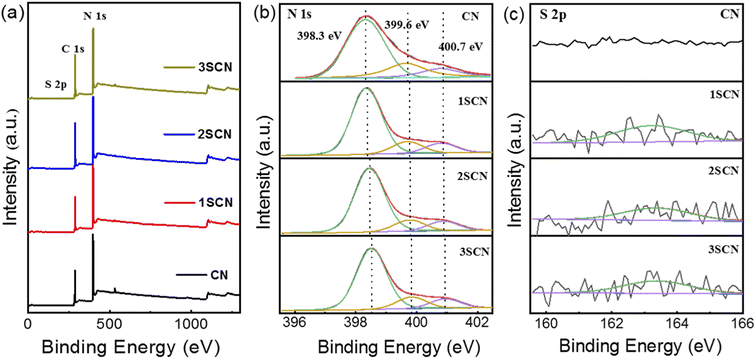 | ||
| Fig. 3 XPS core level survey spectra (a), and high-resolution N 1s (b), and S 2p (c) of the samples. | ||
| Samples | Binding energy (eV) | Peak assignment | Atomic percentage |
|---|---|---|---|
| CN | 398.3 | C–N![[double bond, length as m-dash]](https://www.rsc.org/images/entities/char_e001.gif) C (sp2) C (sp2) |
76.14 |
| 399.4 | N–[C]3 (sp3) | 13.43 | |
| 400.7 | C–NHX | 10.43 | |
| 1SCN | 398.4 | C–N![[double bond, length as m-dash]](https://www.rsc.org/images/entities/char_e001.gif) C (sp2) C (sp2) |
76.18 |
| 399.7 | N–[C]3 (sp3) | 12.97 | |
| 400.8 | C–NHX | 10.85 | |
| 2SCN | 398.5 | C–N![[double bond, length as m-dash]](https://www.rsc.org/images/entities/char_e001.gif) C (sp2) C (sp2) |
76.11 |
| 399.7 | N–[C]3 (sp3) | 12.86 | |
| 400.8 | C–NHX | 11.03 | |
| 3SCN | 398.5 | C–N![[double bond, length as m-dash]](https://www.rsc.org/images/entities/char_e001.gif) C (sp2) C (sp2) |
76.14 |
| 399.8 | N–[C]3 (sp3) | 12.77 | |
| 400.9 | C–NHX | 11.09 |
The transient photocurrent response curve in Fig. 4(a) shows that the photocurrent response of S-doped g-C3N4 increases according the trend of nitrogen defect density.33–35 All samples can respond continuously and stabilizedly under the same continuous bias voltage, with 2SCN exhibits the highest photocurrent responses. Fig. 4(b) shows the PL spectrum of the sample at the excitation wavelength of 373 nm. Obviously, the pure phase CN has a strong emission peak near 442 nm. The PL intensity of SCN samples is much lower than that of the pure phase CN. With the increase of N defects, the PL intensity of the sample becomes weaker, and the fluorescence quenching of 2SCN is the most obvious.36,37 EIS in Fig. 4(c) showed that the order of arc radius is 2SCN < 3SCN < 1SCN < CN, which proves that the migration rate of surface migration rate of SCN samples becomes faster with the increase of defect content. The results show that the separation efficiency of photogenerated carriers of the sample has been significantly improved.35 The above results confirm that the introduction of nitrogen defects enhances the electron hole separation efficiency, reduces the charge transfer resistance, improves the stability of charge carriers and enhances the photocurrent density.38
As shown in Fig. 5(a), light harvest intensity at visible light range follows the sequence: 2SCN > 1SCN > 3SCN > CN. Samples with nitrogen defects exhibit strong absorption and extended visible light absorption with wide shoulder tail, denoted as Urbach tail.39,40 The Urbach tail is attributed to the electronic states located within the band gap, known as midgap states.18 According to the Kubelka–Munk function plot shown in Fig. 5(b), the intrinsic band gap value is 2.75 eV for all samples. That means that introduction of N defects increased the visible light absorption, with the intrinsic electronic structure less affected. Mott–Schottky plots in Fig. 5(c) showed that the slopes of the fitted curves of all samples are positive, indicating that the samples are n-type semiconductors.40 The flat band potential vs. Ag/AgCl is −0.82 eV, −1.01 eV, −1.10 eV and −1.18 eV, for CN, 1SCN, 2SCN, and 3SCN, respectively. Then the VB (valence band) and CB (conduction band) position is calculated by adding CB potential with band gap. The midgap is 2.18 eV, 2.10 eV, and 2.01 eV, for 3SCN, 1SCN, and 2SCN, respectively, by the Kubelk-Munk method in Fig. 5(b). The energy band structure of all samples was illustrated in Fig. 5(d). As the midgap states are close to the edge of CB, the electrons can be more easily excited from VB to midgap states. Nitrogen defects in g-C3N4 induced the formation of deeper midgap states to accommodate more charge carriers excited by photons of longer wavelengths, consistent with UV-vis results.
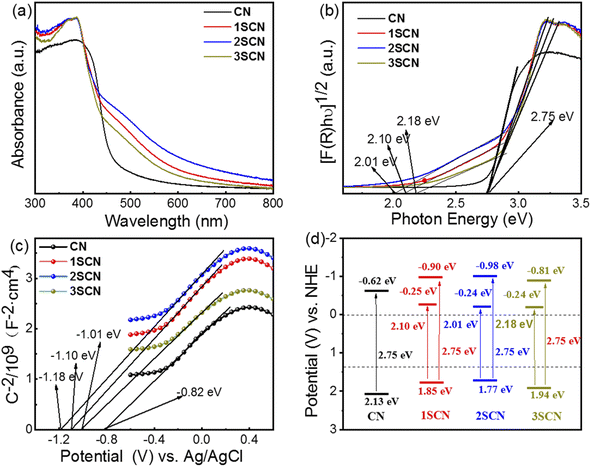 | ||
| Fig. 5 UV-vis diffuse reflectance spectra (a), converted Kubelka–Munk plots (b), Mott–Schottky plots (c), and Schematic band gap structures (d) of the samples. | ||
Fig. 6(a) shows the hydrogen evolution rate of pure g-C3N4 is 2.0 μmol h−1 under visible light irradiation (λ ≥ 420 nm). While the hydrogen evolution rate of 2SCN reached 41.4 μmol h−1, about 20.7 times of that of pure g-C3N4. The average quantum efficiency of 2SCN reaches 11.1%, while the average quantum efficiency of pure g-C3N4 is only 0.3%. It demonstrates that the introduction of nitrogen defects can greatly improve the photocatalytic performance of the catalysts. In order to verify the stability of the sample, the 2SCN was cycled under the same experimental conditions as shown in Fig. 6(b). After four cycles, the hydrogen evolution performance of the sample did not change, which proved that the photocatalysis of the sample was stable and could be reused.
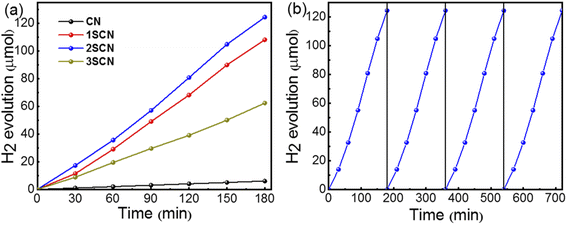 | ||
| Fig. 6 Hydrogen evolution (a) of the samples under visible light irradiation. (b) Stability of SCN600. | ||
Fig. 7 (a) showed the photocatalytic degradation of RhB of the catalysts under visible light irradiation (λ ≥ 420 nm). The photocatalytic degradation rate reaches 45%, 90%, 97%, and 87% in 18 minutes, for CN, 1SCN, 2SCN, and 3SCN, respectively. The degradation rate of 2SCN is about 2.5 times of that of CN. In order to verify the stability of its degradation activity, the catalyst of 2SCN was tested repeatedly for four times. Our results were comparable to that of MoS2.41 As shown in Fig. 7(b), the photocatalytic activity of the sample was still stable after four cycles of testing, indicating that the catalyst had stable physical and chemical properties.
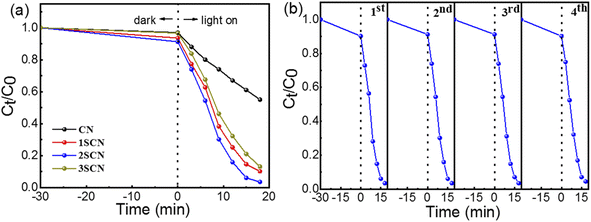 | ||
| Fig. 7 Photocatalytic degradation of RhB (a) under visible light irradiation. (b) Stability of 2SCN. | ||
The degradation rate did not change obviously by adding tert-butyl alcohol (t-BuOH) and methanol (MeOH), as shown in Fig. 8(a), which indicated hydroxyl radicals and holes are not the reactants for the degradation of RhB. While the photocatalytic reactions were inhibited dramatically by adding benzoquinone (BQ), indicating the radical superoxide (˙O2−) is the active radicals in the RhB degradation process. DMPO (5,5-dimethyl-1-pyrrole N-oxide) was used as a free radical trapping agent in electron paramagnetic resonance (EPR) analysis to detect free radical intermediates (˙OH and ˙O2−) generated under specific potential. Upon visible light irradiation, 2SCN in the methanol dispersion system showed obvious 1![[thin space (1/6-em)]](https://www.rsc.org/images/entities/char_2009.gif) :
:![[thin space (1/6-em)]](https://www.rsc.org/images/entities/char_2009.gif) 1
1![[thin space (1/6-em)]](https://www.rsc.org/images/entities/char_2009.gif) :
:![[thin space (1/6-em)]](https://www.rsc.org/images/entities/char_2009.gif) 1
1![[thin space (1/6-em)]](https://www.rsc.org/images/entities/char_2009.gif) :
:![[thin space (1/6-em)]](https://www.rsc.org/images/entities/char_2009.gif) 1 peaks corresponding to ˙O2− and no signals corresponding to ˙OH were observed, as shown in Fig. 8(b). The experimental results proved that the photoinduced electron–hole pairs react with adsorbed O2 to form ˙O2−.42
1 peaks corresponding to ˙O2− and no signals corresponding to ˙OH were observed, as shown in Fig. 8(b). The experimental results proved that the photoinduced electron–hole pairs react with adsorbed O2 to form ˙O2−.42
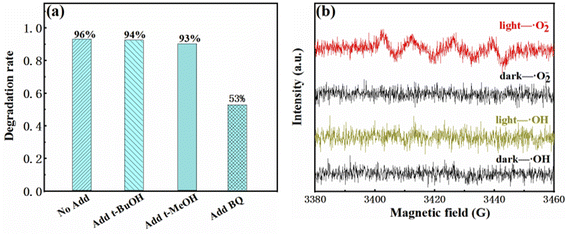 | ||
| Fig. 8 Degradation rate of 2SCN in the presence of various scavengers (a). EPR spectra in a methanol dispersion for DMPO-˙O2− and in an aqueous dispersion for DMPO-˙OH (b). | ||
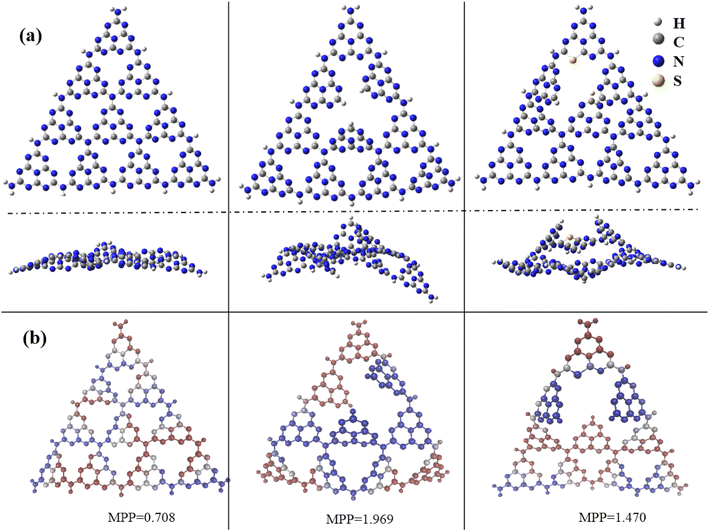
Experimental results verified that nitrogen defects were introduced in g-C3N4, and a trace amount of S atoms were doped as well, which improved the transfer and separation of photoinduced carriers and photocatalytic activity. Further theoretical calculations were performed to understand the effects of N defects and S doping on the electronic structure and catalytic performance of g-C3N4. The pure g-C3N4, N-defected g-C3N4, and SCN were built up by using GaussView Rev 5.0.8,43 as shown in Fig. 9(a). Gaussian 09 Rev E.01 software package44 were selected to perform structural optimization and obtain frontier molecular orbitals including the highest occupied molecular orbital and lowest unoccupied molecular orbital (HOMO/LUMO). All calculations were at the B3LYP/6-31G* theoretical level.45,46 Meanwhile, we used the Multiwfn Rev 3.7 software package45 to gain molecular planarity, the van der Waals volume and surface area. Obviously, as shown in Fig. 9(b), the N defects and S doping make the planarity of the structures worse, increasing the molecular flatness parameter (MPP) by introducing N defects. Furthermore, to explain the performance of catalysis of these compounds, the van der Waals volume and surface area, and molecule specific surface area (SSA) were calculated and presented in Table 2 and Fig. S1.† The order of molecular volume and surface area is pure g-C3N4 < N-defected g-C3N4 < SCN. However, due to the smaller molecular mass, the order of SSA of these compounds is pure g-C3N4 < SCN < N-defected g-C3N4. Not surprisingly, all these compounds have very large SSAs (>4100 m2 g−1), which are larger than that of pure g-C3N4.
| g-C3N4 | N-defected g-C3N4 | SCN | |
|---|---|---|---|
| Molecule volume (Å3) | 1678.03 | 1705.80 | 1719.66 |
| Molecule surface area (Å2) | 1314.10 | 1393.87 | 1400.70 |
| Specific surface area (m2 g−1) | 4109.55 | 4384.06 | 4364.50 |
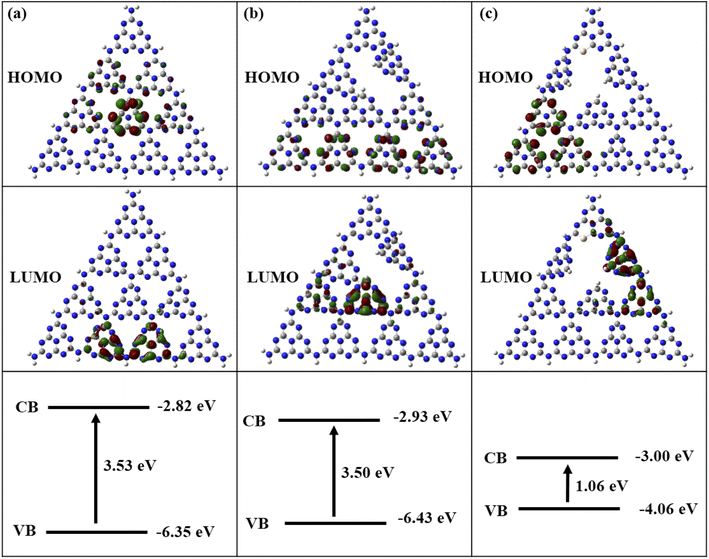
Next, Fig. S2† demonstrates the maps of density of states of all three compounds. Clearly, the valence bands of both pure g-C3N4, N-defected g-C3N4, and SCN are mainly composed of atomic orbitals of N atoms. And the conduction bands of both pure g-C3N4 and N-defected g-C3N4 are contributed by atomic orbitals of C + N atoms, and that of S-doped g-C3N4 with N defection consists of the atomic orbitals of C + N + S atoms. Remarkably, the HOMO energy of SCN is much higher than both of other two compounds.
The HOMO and LUMO images and energy gaps of three compounds are given in Fig. 10. In Fig. 10(a), the HOMO (holes after photoexcitation) map of pure g-C3N4 indicates that the central C and N atoms provide oxygen oxidation sites, while the LUMO (excited electrons after photoexcitation) shows that the edge C and N atoms are the reduction sites for H2. Fig. 10(b) displays that the N defections in g-C3N4 changes the positions of oxidation and reduction sites, which are opposite to those of pure g-C3N4. Fig. 10(c) shows that the combination of N defections and S introductions cause in a clear separation of HOMO and LUMO. Compared to pure g-C3N4, its carrier mobility becomes faster with the longer separation of HOMO (holes) and LUMO (electrons). The band gaps of pure, N-defective, and SCN are 3.53 eV, 3.50 eV, and 1.06 eV, respectively. The band gap of N-defective g-C3N4 is slightly reduced compared to that of pure g-C3N4, and the electron potential well caused by N defects is conducive to electron capture and inhibits electron–hole recombination.
4. Conclusions
In summary, graphite carbon nitride with certain amount of nitrogen defects was synthesize by calcining melamine and thiocyanate acid at different temperatures. For SCN, the percentage of N–[C]3 decreases and the percentage of –NH2 increases with increase the ratio of thiocyanate acid, resulting in the formation of nitrogen defects in inner S–[C]3 linkage. The nitrogen defects induced the midgap states, which provides capture sites for photogenerated carriers, thus effectively preventing the recombination of photogenerated electrons and holes. Therefore, the quantum efficiency of the photocatalyst with nitrogen defect has been greatly improved. DFT modulations verified that N-defective g-C3N4 has a slightly reduced band gap compared to that of pure g-C3N4, and deteriorated molecular flatness and increased specific surface area caused by N defects is conducive to electron capture and inhibits electron–hole recombination, thus enhanced the photocatalytic activity of g-C3N4.Author contributions
The manuscript was written through contributions of all authors. All authors have given approval to the final version of the manuscript.Conflicts of interest
There is no conflicts to declare.Acknowledgements
This work was supported by the National Natural Science Foundation of China (51801164), Fundamental Research Funds for Central Universities (XDJK2020C005), and Venture & Innovation Support Program for Chongqing Overseas Returnees (cx2018080).References
- S. Cao, J. Low, J. Yu and M. Jaroniec, Polymeric Photocatalysts Based on Graphitic Carbon Nitride, Adv. Mater., 2015, 27, 2150–2176 CrossRef CAS PubMed.
- F. Sun, S. Tan, H. Zhang, Z. Xing, R. Yang, B. Mei and Z. Jiang, Uniform Pt quantum dots-decorated porous g-C3N4 nanosheets for efficient separation of electron-hole and enhanced solar-driven photocatalytic performance, J. Colloid Interface Sci., 2018, 531, 119–125 CrossRef CAS PubMed.
- G. Liao, Y. Gong, L. Zhang, H. Gao, G. Yang and B. Fang, Semiconductor polymeric graphitic carbon nitride photocatalysts: the "holy grail" for the photocatalytic hydrogen evolution reaction under visible light, Energy Environ. Sci., 2019, 12, 2080–2147 RSC.
- Z.-H. Ruan, X.-Y. Gao, Y. Yuan and H.-P. Tan, Theoretical insight into the effect of Br, Na co-doping on electronic structure, photocatalytic and optical characteristics of g-C3N4 using first-principles and optical simulations, J. Mater. Sci., 2021, 56, 10382–10392 CrossRef CAS.
- Y. Zhang, T. Mori, J. Ye and M. Antonietti, Phosphorus-Doped Carbon Nitride Solid: Enhanced Electrical Conductivity and Photocurrent Generation, J. Am. Chem. Soc., 2010, 132, 6294–6295 CrossRef CAS PubMed.
- Z. Ni, F. Dong, H. Huang and Y. Zhang, New insights into how Pd nanoparticles influence the photocatalytic oxidation and reduction ability of g-C3N4 nanosheets, Catal. Sci. Technol., 2016, 6, 6448–6458 RSC.
- K.-I. Katsumata, R. Motoyoshi, N. Matsushita and K. Okada, Preparation of graphitic carbon nitride (g-C3N4)/WO3 composites and enhanced visible-light-driven photodegradation of acetaldehyde gas, J. Hazard. Mater., 2013, 260, 475–482 CrossRef CAS PubMed.
- F. Chang, Y. Xie, C. Li, J. Chen, J. Luo, X. Hu and J. Shen, A facile modification of g-C3N4 with enhanced photocatalytic activity for degradation of methylene blue, Appl. Surf. Sci., 2013, 280, 967–974 CrossRef CAS.
- S. Le, T. Jiang, Q. Zhao, X. Liu, Y. Li, B. Fang and M. Gong, Cu-doped mesoporous graphitic carbon nitride for enhanced visible-light driven photocatalysis, RSC Adv., 2016, 6, 38811–38819 RSC.
- H. Yan, Y. Chen and S. Xu, Synthesis of graphitic carbon nitride by directly heating sulfuric acid treated melamine for enhanced photocatalytic H2 production from water under visible light, Int. J. Hydrogen Energy, 2012, 37, 125–133 CrossRef CAS.
- S. Sun, E. Fan, H. Xu, W. Cao, G. Shao, B. Fan, H. Wang and R. Zhang, Enhancement of photocatalytic activity of g-C3N4 by hydrochloric acid treatment of melamine, Nanotechnology, 2019, 30, 315601 CrossRef CAS PubMed.
- C.-Q. Xu, K. Li and W.-D. Zhang, Enhancing visible light photocatalytic activity of nitrogen-deficient g-C3N4 via thermal polymerization of acetic acid-treated melamine, J. Colloid Interface Sci., 2017, 495, 27–36 CrossRef CAS PubMed.
- K. Wang, J. Fu and Y. Zheng, Insights into photocatalytic CO2 reduction on C3N4: Strategy of simultaneous B, K co-doping and enhancement by N vacancies, Appl. Catal., B, 2019, 254, 270–282 CrossRef CAS.
- D. Han, J. Liu, H. Cai, X. Zhou, L. Kong, J. Wang, H. Shi, Q. Guo and X. Fan, High-yield and low-cost method to synthesize large-area porous g-C3N4 nanosheets with improved photocatalytic activity for gaseous nitric oxide and 2-propanol photodegradation, Appl. Surf. Sci., 2019, 464, 577–585 CrossRef CAS.
- Q. Liang, Z. Li, Z.-H. Huang, F. Kang and Q.-H. Yang, Holey Graphitic Carbon Nitride Nanosheets with Carbon Vacancies for Highly Improved Photocatalytic Hydrogen Production, Adv. Funct. Mater., 2015, 25, 6885–6892 CrossRef CAS.
- B. Lin, G. Yang and L. Wang, Stacking-Layer-Number Dependence of Water Adsorption in 3D Ordered Close-Packed g-C3N4 Nanosphere Arrays for Photocatalytic Hydrogen Evolution, Angew. Chem., Int. Ed., 2019, 58, 4587–4591 CrossRef CAS PubMed.
- X. Chen, R. Shi, Q. Chen, Z. Zhang, W. Jiang, Y. Zhu and T. Zhang, Three-dimensional porous g-C3N4 for highly efficient photocatalytic overall water splitting, Nano Energy, 2019, 59, 644–650 CrossRef CAS.
- X. Bai, M. Li, J. Li, X. Rao, S. Zheng and Y. Zhang, Chemical cutting of network nodes in polymeric carbon nitrides for enhanced visible light photocatalytic hydrogen generation, ACS Appl. Nano Mater., 2022, 5, 691–701 CrossRef CAS.
- Y. Jiang, F. Qu, L. Tian, X. Yang, Z. Zou and Z. Lin, Self-assembled g-C3N4 nanoarchitectures with boosted photocatalytic solar-to-hydrogen efficiency, Appl. Surf. Sci., 2019, 487, 59–67 CrossRef CAS.
- L. Feng, Y. Zou, C. Li, S. Gao, L. Zhou, Q. Sun, M. Fan, H. Wang, D. Wang, G. Li and X. Zou, Nanoporous sulfur-doped graphitic carbon nitride microrods: a durable catalyst for visible light driven H2 evolution, Int. J. Hydrogen Energy, 2014, 39, 15373–15379 CrossRef CAS.
- Q. Liang, X. Liu, J. Wang, Y. Liu, Z. Liu, L. Tang, B. Shao, W. Zhang, S. Gong, M. Cheng, Q. He and C. Feng, In-situ self-assembly construction of hollow tubular g-C3N4 isotype heterojunction for enhanced visible light photocatalysis: experiments and theories, J. Hazard. Mater., 2021, 401, 123355 CrossRef CAS PubMed.
- R. You, H. Dou, L. Chen, S. Zheng and Y. Zhang, Graphitic carbon nitride with S and O codoping for enhanced visible light photocatalytic performance, RSC Adv., 2017, 7, 15842–15850 RSC.
- L. Liu, Y. Qi, J. Lu, S. Lin, W. An, Y. Liang and W. Cui, A stable Ag3PO4@g-C3N4 hybrid core@shell composite with enhanced visible light photocatalytic degradation, Appl. Catal., B, 2016, 183, 133–141 CrossRef CAS.
- S. W. Hu, L. W. Yang, Y. Tian, X. L. Wei, J. W. Ding, J. X. Zhong and P. K. Chu, Simultaneous nanostructure and heterojunction engineering of graphitic carbon nitride via in situ Ag doping for enhanced photoelectrochemical activity, Appl. Catal., B, 2015, 163, 611–622 CrossRef CAS.
- G. Liu, G. Zhao, W. Zhou, Y. Liu, H. Pang, H. Zhang, D. Hao, X. Meng, P. Li, T. Kako and J. Ye, In Situ Bond Modulation of Graphitic Carbon Nitride to Construct p–n Homojunctions for Enhanced Photocatalytic Hydrogen Production, Adv. Funct. Mater., 2016, 26, 6822–6829 CrossRef CAS.
- H. Shi, S. Long, S. Hu, J. Hou, W. Ni, C. Song, K. Li, G. G. Gurzadyan and X. Guo, Interfacial charge transfer in 0D/2D defect-rich heterostructures for efficient solar-driven CO2 reduction, Appl. Catal., B, 2019, 245, 760–769 CrossRef CAS.
- X. Han, Y. Wang, J. Lv, L. Kong, L. Tian, X. Lu, J. Wang and X. Fan, An artful and simple synthetic strategy for fabricating low carbon residual porous g-C3N4 with enhanced visible-light photocatalytic properties, RSC Adv., 2016, 6, 83730–83737 RSC.
- Y. Liu, G. Xu, D. Ma, Z. Liu, Z. Yan, A. Xu, W. Zhong and B. Fang, Synergetic effects of g-C3N4 three-dimensional inverse opals and Ag modification toward high-efficiency photocatalytic H2 evolution, J. Clean. Prod., 2021, 328, 129745 CrossRef CAS.
- L. Chen, Y. Man, Z. Chen and Y. Zhang, Ag/g-C3N4 layered composites with enhanced visible light photocatalytic performance, Mater. Res. Express, 2016, 3, 115003 CrossRef.
- D. Gao, Y. Liu, P. Liu, M. Si and D. Xue, Atomically Thin B doped g-C3N4 Nanosheets: High-Temperature Ferromagnetism and calculated Half-Metallicity, Sci. Rep., 2016, 6, 35768 CrossRef CAS PubMed.
- K. Wang, Q. Li, B. Liu, B. Cheng, W. Ho and J. Yu, Sulfur-doped g-C3N4 with enhanced photocatalytic CO2-reduction performance, Appl. Catal., B, 2015, 176, 44–52 Search PubMed.
- Y. Wang, Y. Tian, L. Yan and Z. Su, DFT Study on Sulfur-Doped g-C3N4 Nanosheets as a Photocatalyst for CO2 Reduction Reaction, J. Phys. Chem. C, 2018, 122, 7712–7719 CrossRef CAS.
- Q.-P. Luo, X.-Y. Yu, B.-X. Lei, H.-Y. Chen, D.-B. Kuang and C.-Y. Su, Reduced Graphene Oxide-Hierarchical ZnO Hollow Sphere Composites with Enhanced Photocurrent and Photocatalytic Activity, J. Phys. Chem. C, 2012, 116, 8111–8117 CrossRef CAS.
- B. Liu, L. Ye, R. Wang, J. Yang, Y. Zhang, R. Guan, L. Tian and X. Chen, Phosphorus-Doped Graphitic Carbon Nitride Nanotubes with Amino-rich Surface for Efficient CO2 Capture, Enhanced Photocatalytic Activity, and Product Selectivity, ASC Appl. Mater. Interfaces, 2018, 10, 4001–4009 CrossRef CAS PubMed.
- C. Yao, A. Yuan, Z. Wang, H. Lei, L. Zhang, L. Guo and X. Dong, Amphiphilic two-dimensional graphitic carbon nitride nanosheets for visible-light-driven phase-boundary photocatalysis, J. Mater. Chem. A, 2019, 7, 13071–13079 RSC.
- G. Wu, Y. Gao and B. Zheng, Template-free method for synthesizing sponge-like graphitic carbon nitride with a large surface area and outstanding nitrogen photofixation ability induced by nitrogen vacancies, Ceram. Int., 2016, 42, 6985–6992 CrossRef CAS.
- Y. Wang, Y. Li, J. Zhao, J. Wang and Z. Li, g-C3N4/B doped g-C3N4 quantum dots heterojunction photocatalysts for hydrogen evolution under visible light, Int. J. Hydrogen Energy, 2019, 44, 618–628 CrossRef CAS.
- Y. Li, R. Jin, Y. Xing, J. Li, S. Song, X. Liu, M. Li and R. Jin, Macroscopic Foam-Like Holey Ultrathin g-C3N4 Nanosheets for Drastic Improvement of Visible-Light Photocatalytic Activity, Adv. Energy Mater., 2016, 6, 1601273 CrossRef.
- J. Li, B. Shen, Z. Hong, B. Lin, B. Gao and Y. Chen, A facile approach to synthesize novel oxygen-doped g-C3N4 with superior visible-light photoreactivity, Chem. Commun., 2012, 48, 12017–12019 RSC.
- Y. Oh, J. O. Hwang, E.-S. Lee, M. Yoon, V.-D. Le, Y.-H. Kim, D. H. Kim and S. O. Kim, Divalent Fe Atom Coordination in Two-Dimensional Microporous Graphitic Carbon Nitride, ACS Appl. Mater. Interfaces, 2016, 8, 25438–25443 CrossRef CAS PubMed.
- M. Hao, H. Li, L. Cui, B. Fang, J. Liang, X. Xie, D. Wang and f. Wang, Higher photocatalytic removal of organic pollutants using pangolin-like composites made of 3-4 atomic layer of MoS2 nanosheets deposited on tourmaline, Environ. Chem. Lett., 2021, 19, 3573–3582 CrossRef CAS.
- H. Dou, S. Zheng and Y. Zhang, Graphitic Carbon Nitride with S and Fe(III) Codoping for Improved Photodegradation Performance, Catal. Lett., 2018, 148, 601–611 CrossRef CAS.
- T. A. K. Roy Dennington and J. M. Millam, Semichem Inc., Shawnee Mission, GaussView, Version 5, 2016.
- G. W. T, M. J. Frisch, H. B. Schlegel, G. E. Scuseria, M. A. Robb, J. R. Cheeseman, G. Scalmani, V. Barone, G. A. Petersson, H. Nakatsuji, X. Li, M. Caricato, A. Marenich, J. Bloino, B. G. Janesko, R. Gomperts, B. Mennucci, H. P. Hratchian, J. V. Ortiz, A. F. Izmaylov, J. L. Sonnenberg, D. Williams-Young, F. Ding, F. Lipparini, F. Egidi, J. Goings, B. Peng, A. Petrone, T. Henderson, D. Ranasinghe, V. G. Zakrzewski, J. Gao, N. Rega, G. Zheng, W. Liang, M. Hada, M. Ehara, K. Toyota, R. Fukuda, J. Hasegawa, M. Ishida, T. Nakajima, Y. Honda, O. Kitao, H. Nakai, T. Vreven, K. Throssell, J. A. Montgomery Jr, J. E. Peralta, F. Ogliaro, M. Bearpark, J. J. Heyd, E. Brothers, K. N. Kudin, V. N. Staroverov, T. Keith, R. Kobayashi, J. Normand, K. Raghavachari, A. Rendell, J. C. Burant, S. S. Iyengar, J. Tomasi, M. Cossi, J. M. Millam, M. Klene, C. Adamo, R. Cammi, J. W. Ochterski, R. L. Martin, K. Morokuma, O. Farkas, J. B. Foresman and D. J. Fox, Gaussian 2009, revision E.01, Gaussian, Inc., Wallingford CT, 2016 Search PubMed.
- A. D. Becke, Density-functional thermochemistry. III The role of exact exchange, J. Chem. Phys., 1993, 98, 5648–5652 CrossRef CAS.
- T. Lu and F. Chen, Multiwfn: A multifunctional wavefunction analyzer, J. Comput. Chem., 2012, 33, 580–592 CrossRef CAS PubMed.
Footnotes |
| † Electronic supplementary information (ESI) available: Calculated specific surface areas and molecular volumes and calculated density of states. See https://doi.org/10.1039/d2ra04928g |
| ‡ These authors contributed equally to this work. |
| This journal is © The Royal Society of Chemistry 2022 |

