 Open Access Article
Molecular selectivity in the water flooding heavy oil process from porous rocks
Bo Zhanga,
Zheyu Liu b,
Han Zhangb,
Quan Shi
 a,
Yiqiang Li
 *b and
Chunming Xu*a
aState Key Laboratory of Heavy Oil Processing, China University of Petroleum, Beijing 102249, PR China. E-mail: xcm@cup.edu.cn
bCollege of Petroleum Engineering, China University of Petroleum, Beijing 102249, PR China. E-mail: yiqiangli@cup.edu.cn
First published on 31st August 2022
Abstract
Water flooding increases the recovery factor of crude oil and has been proven to be an economical and viable technique for enhancing the oil recovery of oil fields. The process has been systematically studied previously, in which the oil was considered a substance of constant composition. However, the molecular selectivity during the water flooding process has rarely been addressed, especially for heavy oil. Herein, the properties and compositional changes of heavy oil have been investigated in a simulated water flooding process at 60 °C and 85 °C. The crude oil and produced oils from different water flooding stages were characterized by gas chromatography, gas chromatography-mass spectrometry, and Fourier transform ion cyclotron resonance mass spectrometry. The results show that with the increase in temperature, the content of resins in the produced oils from different water flooding stages decreases, and the content of asphaltenes increases slightly. The viscosity of the produced oils increases at low temperatures and decreases at high temperatures as the water cut increases. The composition of the produced oils from different water flooding stages is different. Compared with the no water cut and high water cut stages, the changes in the produced oils of the low water cut stages are significant at different temperatures. The molecular selectivity of heteroatoms is higher than that of hydrocarbons in the water flooding process. Water flooding preferentially extracts small-molecule low-carbon hydrocarbons and small-molecule heteroatoms with low condensation degrees. The compositional differences between the produced oils were characterized by the double bond equivalent versus carbon number distribution of the S, N, and O-containing compounds. This study can not only provide some explanations on the viscosity-forming mechanism of heavy oil but also explains the watered-out phenomena in the development of oilfields.
1 Introduction
Crude oil is still one of the most important fossil energy sources in the world despite the continuous development of new energy sources.1,2 Crude oil is a complex mixture of organic molecules that contains carbon, hydrogen, sulfur, nitrogen, oxygen, as well as metallic elements.3 The composition and structure of these molecules determine the physical properties and chemical reactivity of crude oil.3–5 The molecular composition is also of great significance in geochemical research.6,7In addition to the formation temperature and pressure, water washing, chromatographic effects, and biodegradation can cause variations in the composition of crude oil during petroleum development.8,9 The light components, which have lower density and viscosity, are extracted first in the development process.9,10 When the water cut of the oil well rises, the dissolved gas in the crude oil will partially dissolve in water. The decrease in saturation pressure and the gas–oil ratio of the petroleum can cause the precipitation of heavy components such as asphaltenes, which could lead to a significant decrease in the freezing point and increase the density and viscosity of the petroleum fluid.11 In the primary recovery stage, clay minerals selectively adsorb the crude oil components with a chromatographic effect, which results in a lower concentration of polar components such as resins and asphaltenes than those in the reservoir oil.12
Water flooding development has the characteristics of low cost, quick effect, and a remarkable effect of enhancing oil recovery, and is commonly used after the primary recovery development of oil fields.13 In the process of oil displacement in the reservoir, the differential solubility of different oil components in water results in the change of oil components because of the water washing effect. The preference for low molecular weight compounds with high water solubility at the beginning of development results in an increase in the average molecular weight and a decrease in the API gravity of the produced oil.10 API gravity, which is revised jointly by the American Petroleum Institute and National Institute of Standards and Technology, expresses the gravity or density of crude oil. Lafargue and Le Thiez14 found that the content of low molecular aromatics decreases, while the content of aromatics above C10 changes little in the produced oil. Additionally, the content of heteroatoms in the produced oil increases during the water flooding process, forming compounds such as dibenzothiophene, which is considered a signature compound.15–18 In the late stage of development, the content of low molecular hydrocarbons in the produced oils decreases with the increase in the recovery factor. Water flooding significantly modifies the distribution of bicyclic aromatics, but only has little effect on the composition of polycyclic aromatic compounds with three or more aromatic rings.19 The concentration of basic nitrogen compounds and petroleum acids decreases in the late stage of water flooding development.12,20
However, some researchers have reported that the content of each composition in the produced oils is generally stable during the anhydrous stage in the water flooding process. The content of aromatics gradually increases with the increase in the water cut.21–23 Small-molecule heteroatoms with low molecular condensation degrees are easy to extract, except those with high molecular polarity.24 The compositional changes observed from different studies in the produced oils are inconsistent because the oils come from different water flooding stages.
The recoverable resource of crude oil in the world has been proved to be 126.7 billion tons, more than 70% of which is heavy oil.25–27 Water flooding has been proven to be an economical and viable technique for enhanced oil recovery.21 Although many studies have reported the compositional changes during the water flooding process for light oil, the molecular selectivity of heavy oil has rarely been addressed.
In this study, core scale water flooding simulation experiments of heavy oil were carried out at 60 °C and 85 °C. The crude oil and produced oils from different water flooding stages were characterized by gas chromatography (GC), gas chromatography-mass spectrometry (GC-MS), and Fourier transform ion cyclotron resonance mass spectrometry (FT-ICR MS) to reveal the molecular selectivity of petroleum compounds during the water flooding process.
2 Experimental section
2.1 Sample
Heavy oil was obtained from the Shengli Oil Field (China), which has a viscosity of 7780 mPa·s at 60 °C after dehydration. Heavy oil is a non-Newtonian fluid at 60 °C and turns into a Newtonian fluid above 85 °C. The experimental water was field-filtered formation water with a salinity of 200 mg L−1. A rectangular artificial core was made of only quartz sand with a length of 30 cm × a width of 4.5 cm × a height of 4.5 cm.2.2 Water flooding experiments
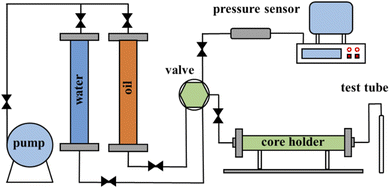
The core physical properties and experimental parameters are shown in Table 1. The porosity, permeability and original oil saturation of the cores were set to be the same as actual reservoir conditions to simulate water flooding experiments from porous rocks. A schematic diagram of the core scale water flooding simulation experiment instrument is shown in Fig. 1. The instrument includes the injection system, artificial core model, liquid measurement system, pressure control system and data acquisition system. The main equipment contains a constant speed pump, plunger, thermostat, pressure sensor and acquisition software.| Parameter | 1 | 2 |
|---|---|---|
| a Porosity: saturated water volume/total core volume.b Permeability: the gas phase permeability of the core using the Darcy formula.c Original oil saturation: saturated oil volume/pore volume. | ||
| Temperature, °C | 60 | 85 |
| Porositya, % | 31.61 | 34.54 |
| Permeabilityb, mD | 4032 | 4112 |
| Original oil saturationc, % | 89.98 | 81.97 |
| Displacement media | Cold water | Hot water |
The core was loaded into a high-temperature resistant core holder and then measured for permeability, vacuumed, saturated with the experimental water and filled with crude oil in turn. The core holder and plunger, which were filled with water, were heated to the experimental temperature using a thermostat; then, the experimental water was injected into the core holder at 1 mL min−1 by the pump. The injection pressure was recorded by a pressure sensor and the outlet pressure was atmospheric pressure in the experimental process. The extracted liquid was collected in test tubes at 10 min intervals. The experiment ends when the injection volume reaches 1.5 multiples of the pore volume. The volumes of oil and water were read after the oil and water were separated completely.
The factor of water cut (fw) shown in eqn (1) is defined as the ratio of water volume to total liquid volume. The recovery factor (rf) shown in eqn (2) is defined as the ratio of oil volume to total liquid volume. The crude oil and produced oils from different water flooding stages (fw = 0, fw ≤ 0.8 and fw > 0.8 stages) were collected in sampling bottles. The viscosity was measured at high shear rates to avoid emulsion effects.
 | (1) |
 | (2) |
2.3 SARA fractionation
The crude oil and the produced oils from different water flooding stages were first dehydrated with anhydrous sodium sulfate and then separated into saturates, aromatics, resins, and asphaltenes (SARA) based on the ASTM D2007-19 method (equivalent to the Chinese industry standard NB/SH/T 0509-2010 method).28Briefly, about 0.5 g of the oil sample was dissolved in 25 mL n-heptane. The mixture was heated with reflux for 1 h and then stored in the dark for 2 h after cooling. The n-heptane precipitate was obtained by filtration using a quantitative filter paper (pore size 30–50 μm). The filter paper with the precipitate was put into the extractor and heated with reflux for 1 h using an n-heptane mixture until the solvent turned colorless. The n-heptane-soluble fraction called maltene was obtained by vacuum rotary evaporation of the n-heptane mixture. The filter paper with the precipitate in the extractor was heated with reflux for 1 h using 30 mL toluene until the solvent turned colorless. Asphaltene was obtained by vacuum rotary evaporation of the toluene mixture. The maltene in n-heptane was concentrated to about 10 mL by vacuum rotary evaporation. Then, maltene was fractionated into saturates, aromatics, and resins using alumina (100–200 mesh, activated at 500 °C for 6 h, with 1 wt% water added) column chromatography with a 50 °C circulating water bath. The saturates and aromatics were eluted with 80 mL n-heptane and 80 mL toluene, respectively. The resins were eluted with 40 mL toluene/ethanol (1![[thin space (1/6-em)]](https://www.rsc.org/images/entities/char_2009.gif) :
:![[thin space (1/6-em)]](https://www.rsc.org/images/entities/char_2009.gif) 1, v/v), 40 mL toluene and 40 mL ethanol. The solvent in each effluent was dried by a vacuum drying oven (110 °C, 0.08 MPa vacuum) and weighed several times until constant weight after cooling.
1, v/v), 40 mL toluene and 40 mL ethanol. The solvent in each effluent was dried by a vacuum drying oven (110 °C, 0.08 MPa vacuum) and weighed several times until constant weight after cooling.
2.4 Simulated distillation
The high-temperature simulated distillation analysis was performed on a modified Agilent 6890N GC system (Analytical Controls, Netherland). An AC HT-750 high-temperature column (5 m × 0.53 mm × 0.18 μm) (Analytical Controls, Netherland) was used for the analysis. The oven was held at 40 °C for 1 min, ramped from 40 °C to 430 °C at 10 °C min−1, and then held at 430 °C for 5 min. Helium was used as the carrier gas at a flow rate of 19 mL min−1. The injector was held at 100 °C for 15 min, programmed to 430 °C at 15 °C min−1, and then held at 430 °C for 22 min. The flame ionization detector (FID) was maintained at 430 °C. The sample injection was 1 μL.2.5 GC-FID
An Agilent 7890A GC coupled with a flame ionization detector (FID) was used to analyze the hydrocarbons of the crude oil and produced oils from different water flooding stages. An HP-1 elastic silica capillary column (60 m × 0.25 mm × 0.25 μm) was used. The column was held at 40 °C for 10 min, ramped from 40 to 70 °C at 4 °C min−1, ramped from 70 to 310 °C at 8 °C min−1, and then held at 310 °C for 40 min. The injector was held at 310 °C and the FID was maintained at 310 °C. Nitrogen was used as the carrier gas at a flow rate of 1 mL min−1. The split ratio was set to 20![[thin space (1/6-em)]](https://www.rsc.org/images/entities/char_2009.gif) :
:![[thin space (1/6-em)]](https://www.rsc.org/images/entities/char_2009.gif) 1.
1.
2.6 GC-MS
An Agilent 7890A GC coupled with a 5975C mass spectrometer was used to analyze the saturates and aromatics. An HP-5 fused silica capillary column (60 m × 0.25 mm × 0.25 μm) was used. For saturates, the column was held at 50 °C for 1 min, ramped from 50 to 120 °C at 20 °C min−1, ramped from 120 to 250 °C at 4 °C min−1, ramped from 250 to 310 °C at 3 °C min−1, and then held at 310 °C for 30 min. Both the injector and transfer line were held at 300 °C. For aromatics, the column was held at 50 °C for 1 min, ramped from 50 to 120 °C at 15 °C min−1, ramped from 120 to 300 °C at 3 °C min−1, and then held at 300 °C for 35 min. The injector was held at 290 °C and the transfer line was held at 250 °C. Helium was used as the carrier gas at a constant flow rate of 1 mL min−1. The ion source temperature of MS was maintained at 250 °C and operated in the electron-impact ionization (EI) mode with an electron beam energy of 70 eV. The mass range was set to m/z 35–600.2.7 FT-ICR MS
A Bruker Apex-Ultra FT-ICR mass spectrometer coupled with a 9.4 T magnet (operating at 9.0 T) was used to analyze the molecular composition of the crude oil and produced oils from different water flooding stages. About 10 mg of the oil sample was dissolved in 1 mL toluene in a beaker flask. Twenty microliters of the toluene solution were diluted with 1 mL toluene/methanol (1![[thin space (1/6-em)]](https://www.rsc.org/images/entities/char_2009.gif) :
:![[thin space (1/6-em)]](https://www.rsc.org/images/entities/char_2009.gif) 3 v/v). The prepared solution was infused into the ion-ionization source at a flow rate of 180 μL min−1. Positive-ion and negative-ion electrospray ionization (ESI) were carried out. The positive-ion and negative-ion ESI conditions were +4/−4 kV spray shield voltage, +4.5/−4.5 kV capillary column introduced voltage, and +320/−320 V capillary column end voltage. The optimized time of flight for the ions extracted from the collision pool to the ICR cell was 0.0012 s. The mass range was set to m/z 150–800. The data size was set to 4 M words. A total of 64 scans of the FT-ICR time-domain data sets were accumulated to enhance the signal-to-noise ratio and detection dynamic range.
3 v/v). The prepared solution was infused into the ion-ionization source at a flow rate of 180 μL min−1. Positive-ion and negative-ion electrospray ionization (ESI) were carried out. The positive-ion and negative-ion ESI conditions were +4/−4 kV spray shield voltage, +4.5/−4.5 kV capillary column introduced voltage, and +320/−320 V capillary column end voltage. The optimized time of flight for the ions extracted from the collision pool to the ICR cell was 0.0012 s. The mass range was set to m/z 150–800. The data size was set to 4 M words. A total of 64 scans of the FT-ICR time-domain data sets were accumulated to enhance the signal-to-noise ratio and detection dynamic range.
3 Results and discussion
3.1 Water flooding experiment and property analysis
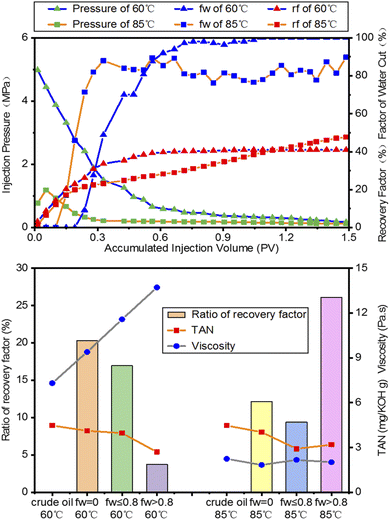
As shown in Fig. 2 (top), the factor of the water cut increases with increasing injection volume. The injection pressure decreases and tends to be constant in the late period of water flooding. The highest pressure of the fw = 0 stage at 60 °C is 5 MPa, much higher than the 1.3 MPa at 85 °C. The decreasing viscosity at 85 °C causes the reduction of injection pressure. The accumulated injection volume of the fw = 0 stage at 60 °C is higher than that at 85 °C, which has an earlier breakthrough moment of water flooding. Water quickly breaks through the core sample and leaves a lot of bypassed oil in the core. After the water flow channel is formed, the rising rate of fw at 60 °C increases rapidly, which is close to that at 85 °C, while a fluctuation of fw of around 80% arises in the fw > 0.8 stage at 85 °C. There is very less chance for water to go into more pores and displace crude oil due to the high capillary pressure gradient. The final recovery factor of the fw = 0 stage at 60 °C is 40%, which is lower than the 49% at 85 °C.As shown in Fig. 2 (bottom), the viscosity of the produced oils from different water flooding stages is higher than that of crude oil at 60 °C. However, with the temperature increasing to 85 °C, the viscosity of the produced oil is lower than that of crude oil. The ratio of the recovery is inversely proportional to the viscosity of the produced oils at different water flooding stages. Compared to other water flooding stages, the fw = 0 stage at 60 °C has a high ratio of recovery and low viscosity of the produced oil, while the ratio of recovery in the fw > 0.8 stage at 85 °C is higher than that of the other two stages. The difference in the recovery factors and pressure and the water cut profiles are mainly from the dramatic change in viscosity. Heavy oil is a non-Newtonian fluid, which has a high viscosity at room temperature. With the increase in temperature, heavy oil shows the properties of a Newtonian fluid with low viscosity,29 and the increasing fluidity of heavy oil makes it easier to extract. The TAN values of the produced oils from different water flooding stages are lower than that of crude oil. The TAN values of the produced oils are inversely proportional to their viscosity at different temperatures. This could be explained by the fact that the petroleum acids in the produced oils decrease and water flooding preferentially extracts the light fractions of the oils. The variation in these two properties indicates that the chemical composition of oils obtained from various flooding stages is different.
The SARA composition of the crude oil and produced oils from different water flooding stages at 60 °C and 85 °C are listed in Table 2. The yields are different and lower than 100% because of the loss of the light components during solvent volatilization and the partial elution of heavy resins. Compared with crude oil, the relative contents of resins in the produced oils from different water flooding stages are lower, but those of asphaltenes are slightly higher than those in crude oil. With the increase in temperature, the relative contents of resins in the produced oils from different water flooding stages decrease and the relative contents of asphaltenes increase slightly. It should be noted that compared with other water flooding stages, the composition changes significantly in the produced oils at the fw ≤ 0.8 stage at different temperatures. In this stage, the interaction between oil composition and water is the strongest due to sufficient contact. The relative contents of aromatics and resins in the produced oils at the fw ≤ 0.8 stage are higher than those at other stages and the contents of asphaltenes are lower at 60 °C. Nevertheless, the changes at 80 °C are opposite to those at 60 °C. Therefore, the composition of the produced oils from different water flooding stages is different.
| Number | Sample | Saturates, wt% | Aromatics, wt% | Resins, wt% | Asphaltenes, wt% | Yield, wt% |
|---|---|---|---|---|---|---|
| 1 | Crude oil | 20.74 | 35.59 | 30.06 | 14.39 | 100.78 |
| 2 | 60 °C fw = 0 | 19.58 | 34.58 | 27.92 | 14.74 | 96.82 |
| 3 | 60 °C fw ≤ 0.8 | 19.48 | 37.08 | 29.59 | 14.46 | 100.61 |
| 4 | 60 °C fw > 0.8 | 15.92 | 34.29 | 27.80 | 15.62 | 93.63 |
| 5 | 85 °C fw = 0 | 18.70 | 36.46 | 27.56 | 15.18 | 97.90 |
| 6 | 85 °C fw ≤ 0.8 | 16.25 | 35.10 | 25.34 | 15.76 | 92.45 |
| 7 | 85 °C fw > 0.8 | 18.22 | 36.50 | 25.45 | 14.94 | 95.11 |
Spiecker et al.30 found that the solubility of the resins in the oil is reduced because of the decreased thermal motion of heavy oil molecules at 60 °C. The adsorption of resin molecules, which continuously precipitate from crude oil, occurs on asphaltene particles. The volume of the resin and asphaltene aggregate increases, and the distance between the particles decreases. The adjacent particles are connected by hydrogen bonds to form a certain spatial network structure, resulting in an increase in the viscosity of heavy oil and a large amount of liquid oil wrapped in it. When the temperature rises to 85 °C, the aggregate structure decomposes because of the breaking of the hydrogen bonds. Heteroatoms of small molecules with strong polarity are continuously precipitated, resulting in the increase in asphaltene content and the change in the asphaltene structure.
The simulated distillation curves of the crude oil and produced oils from different water flooding stages at 60 °C and 85 °C are shown in Fig. 3. Compared with crude oil, the components with boiling points lower than 200 °C of the produced oils are lost during the water flooding process. The high-temperature simulated distillation curves from different water flooding stages at 60 °C and 85 °C seem to be similar. The produced oils contain more light fractions, which could be eluted through the simulated distillation GC column, leading to higher distillation yields than that of crude oil. The produced oils contain mostly volatile components with over 90% yield, but the crude oil contains about 14% non-volatile components not recovered with 86% yield.
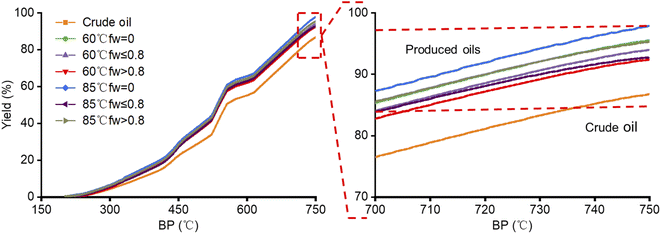 | ||
| Fig. 3 Simulated distillation curves of the crude oil and produced oils from different water flooding stages. | ||
3.2 Characterization of hydrocarbons by GC and GC-MS
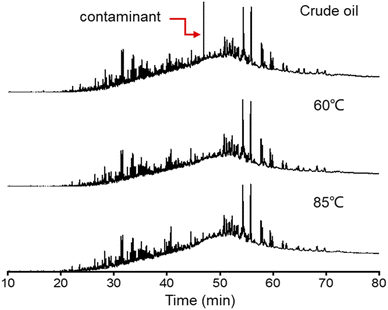
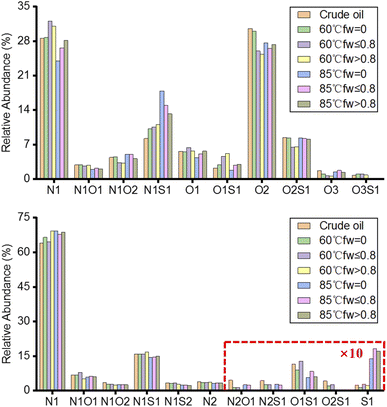
Fig. 4 shows the GC chromatograms of the crude oil and produced oils from different water flooding stages at 60 °C and 85 °C. The crude oil is severely biodegraded as n-alkanes almost disappeared in the GC chromatogram. In the water flooding process, the composition of hydrocarbons in the produced oils is generally not affected by temperature. The chromatograms of the produced oils from different water flooding stages at 60 °C and 85 °C seem to be similar to that of crude oil. The peak at 49.5 min is a contaminant that is identified as a lipid compound imported from the water flooding process.Although n-alkanes are present in trace amounts in oil, they can be observed in the m/z 85 GC-MS mass chromatograms of the saturates. Fig. 5 shows the relative abundance of n-alkanes as a function of carbon number. The relative abundance was normalized based on the peak area of n-alkanes in the mass chromatograms. The n-alkane distributions of the produced oils from different water flooding stages are different from that of crude oil.
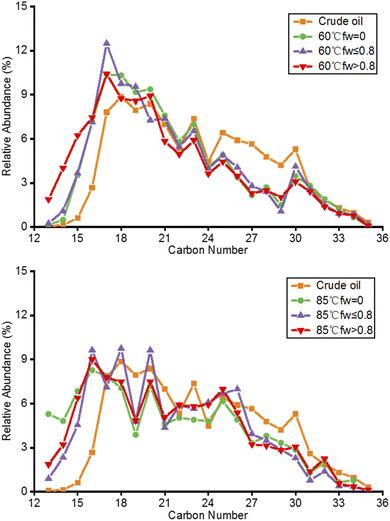 | ||
| Fig. 5 Relative abundance of n-alkanes in the crude oil and produced oils from different water flooding stages at 60 °C (top) and 85 °C (bottom). | ||
Temperature has a great influence on the molecular selectivity of hydrocarbons in the water flooding process. Some large-molecule hydrocarbons in crude oil are not easy to extract by water flooding. The relative abundance of C13–C17 in the produced oils at 60 °C is higher than that in crude oil, and the relative abundance of C23–C30 is lower than that in crude oil (Fig. 5, top). The relative abundance of C17 in the produced oil of the fw ≤ 0.8 stage at 60 °C can reach up to 12%. The relative abundance of C13–C17 in the produced oil at 85 °C is higher than that in crude oil (Fig. 5, bottom). The relative abundance of C16, C18 and C20 in the produced oil of the fw ≤ 0.8 stage at 85 °C can reach up to 10%. Due to the solvent effect, the relative abundance of small molecular hydrocarbons has an effect on the viscosity of the produced oils. The relative abundance of C12–C17 hydrocarbons has the same trend as the viscosity of the produced oils from different water flooding stages at 60 °C. However, the relative abundance has the opposite trend as the viscosity of the produced oils at 85 °C.
3.3 Characterization of heteroatoms by FT-ICR MS
Fig. 6 shows the ESI FT-ICR MS mass spectra of the crude oil and produced oils from different water flooding stages. The mass distribution of the produced oils at 60 °C is generally similar to that of crude oil. However, the mass distribution center of the produced oils shifts from m/z 400 at 60 °C to m/z 300 at 85 °C.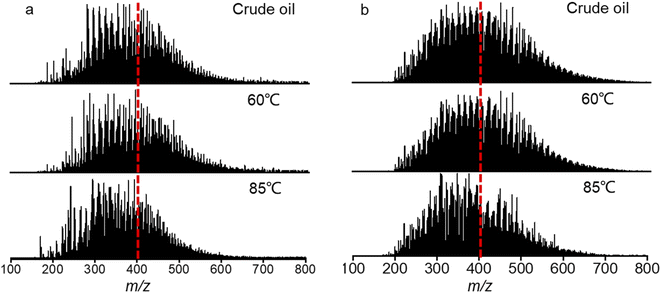 | ||
| Fig. 6 Negative-ion (a) and positive-ion (b) ESI FT-ICR MS mass spectra of the crude oil and produced oils from different water flooding stages. | ||
Fig. 7 shows the relative abundance of the compound classes assigned from the ESI FT-ICR mass spectra of the crude oil and produced oils from different water flooding stages. A total of 10 and 11 classes were detected in the negative-ion and positive-ion ESI analyses, respectively. The produced oils show a higher relative abundance of N1 and O2 classes in the negative-ion ESI FT-ICR mass spectra and N1 and S1 classes in the positive-ion ESI FT-ICR mass spectra. According to previous studies, the N1 classes detected in the negative-ion and positive-ion ESI are neutral nitrogen compounds (carbazoles, benzocarbazoles, dibenzocarbazoles) and basic nitrogen compounds (pyridines, quinolines, anilines), respectively. The O2 class is carboxylic acids and the S1 classes are mainly thiophenes and thioethers. Compared with crude oil, the relative abundance of the acidic O2 class decreases in the produced oils, whereas the relative abundance of the N1S1 classes increases significantly. The relative abundance of the basic nitrogen N1 class shows a slight increase in the produced oils. The relative abundance of the S1 class in the produced oils at 85 °C is much higher than at 60 °C in the positive-ion ESI FT-ICR mass spectra. With the increase in temperature, the S1 classes, which are small molecular compounds with low carbon number and low DBE, are more extracted into the produced oils.
The relative abundance of the O2 class is higher than that of the N1 class in the crude oil and produced oils of the fw = 0 stage at 60 °C and 85 °C in the negative-ion ESI FT-ICR mass spectra. However, the relative abundance of the N1 class is higher than that of the O2 class in the produced oils of the other two stages because of the different solubilities of the O2 class (mainly petroleum acids). Initially, the produced oils have a similar molecular composition as crude oil in the fw = 0 stages due to the effect of water flooding injection pressure difference. After the water flooding breakthrough, the factor of water cut increases, and petroleum acids are partially dissolved in the water. Therefore, the relative abundance of the acidic O2 class in the produced oils is lower than that in the N1 class. At the same time, the solubility of petroleum acid decreases with the increase in temperature. Therefore, the relative content of the O2 class in the produced oils at 60 °C is less than that at 85 °C. There is a competitive ionization problem between the N1 class and O2 class. For example, a decrease in the O2 class would cause the N1 class to increase. Thus, the relative content of N1 in the produced oils at 60 °C is higher than that of the crude oil and produced oils at 85 °C. As shown in Fig. 2 (bottom), the TAN values of the produced oils are also lower than those of crude oil and the relative abundance of the O2 class in the produced oils from different water flooding stages is the same as the TAN values obtained in this study.
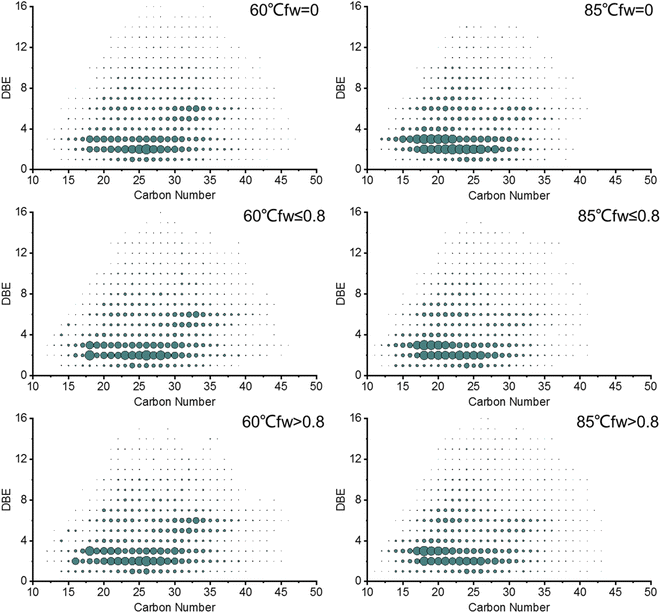
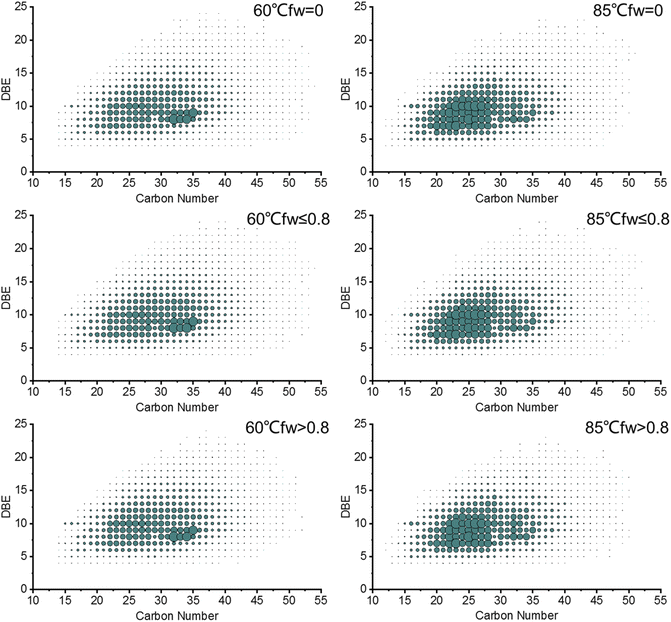
The relative abundance distribution plots of the double bond equivalent (DBE) versus the carbon number of the acidic O2 class and basic nitrogen N1 class of the produced oils are shown in Fig. 8 and 9, respectively. The distribution of the carbon number and DBE in the produced oils from different water flooding stages is generally the same, but the relative abundance distribution centers are different with the increase in temperature.
As shown in Fig. 8, the acidic O2 classes of the produced oils from different water flooding stages at 60 °C and 85 °C have distributions of carbon number and DBE from 12 to 45 and 1 to 16, respectively. The most abundant compounds in the produced oils at 60 °C are compounds that have a carbon number = 18–31 with a DBE = 2–3 and a carbon number = 32–34 with a DBE = 6. However, the relative abundance center of the produced oils at 85 °C is concentrated at a carbon number = 17–28 with a DBE = 2–3 and a carbon number = 21–23 with a DBE = 6.
Fig. 9 shows the basic nitrogen N1 class of the produced oils from different water flooding stages at 60 °C and 85 °C, which indicates that the distributions of the carbon number and DBE are from 15 to 55 and 4 to 25, respectively. The most abundant compounds in the produced oils at 60 °C are compounds that have a carbon number = 32–34 with a DBE = 8 and a carbon number = 35 with a DBE = 9. However, the relative abundance center of the produced oils at 85 °C is concentrated at a carbon number = 20–28 with a DBE = 7–12. Compared with that at 60 °C, the relative abundance distribution centers of DBE versus carbon number for the heteroatoms in the produced oils at 85 °C move to lower carbon numbers and lower DBE due to the heat effect. Water flooding preferentially extracts small-molecule compounds with a low condensation degree.
3.4 Discussion
During the process of water flooding, the produced oils can be divided into three stages according to the different water cut: no water cut (fw = 0), low water cut (fw ≤ 0.8) and high water cut (fw > 0.8). The properties and compositional changes of the produced oils from the three water flooding stages at different temperatures are different. The viscosity increases at low temperatures and decreases at high temperatures compared to that of crude oil. Viscosity is directly related to the recovery factor during the water flooding heavy oil process. The higher the viscosity, the lower the recovery factor. The viscosity of the oils increases with decreasing TAN value in the three water flooding stages, which could be explained by the fact that petroleum acids in the produced oils are partially dissolved in water and water flooding preferentially extracts light fractions of the oils. The relative content of the small-molecular hydrocarbons may affect the viscosity of the produced oils. The variation in these two properties indicates that the chemical compositions of oils obtained from various flooding stages are different.The composition of hydrocarbons in the produced oils from different water flooding stages is generally the same as that of crude oil, mainly because of the severely biodegraded crude oil according to the GC chromatograms. However, GC-MS characterization of the saturates and aromatics from SARA separation shows that the relative contents of small-molecule low-carbon hydrocarbons in the produced oil are lower than those in crude oil during the process of the water flooding of heavy oil. The main reason is that light fractions with high solubility are very sensitive to the water-washing effect. The solubility of aromatics is higher than that of saturates with the same carbon number. The changes in SARA composition are small because the water flooding time is very short in the core scale water flooding simulation experiments. The relative contents of saturates decrease while those of aromatics increase slightly or remain unchanged in the produced oils. With the increase in temperature, the molecular selectivity of heteroatoms increases due to thermal effects in the water flooding process. Water flooding preferentially extracts small molecules, low condensation degree compounds and highly polar heteroatoms, which are mainly distributed in asphaltenes. The content of resins in the produced oils from different water flooding stages decreases because large-molecular polar compounds, which are mainly distributed in the resins, partly remain in the formation.
The molecular selectivity for light hydrocarbons and highly polar heteroatoms can explain why the viscosity of the produced oils varies differently during the water flooding heavy oil process with the increase in temperature. By studying the properties and compositional changes of the produced oils, we can not only provide some explanation of the viscosity-forming mechanism of heavy oil but also explain the watered-out phenomena during the development of oilfields.
4 Conclusions
Heavy oil is not a substance of constant composition during the water flooding process from porous rocks. Viscosity changes with the increase in water cut during the water flooding heavy oil process. The higher the viscosity, the lower the recovery factor. The molecular selectivity for hydrocarbons and heteroatoms is different due to the different solubility of molecules with the increase in temperature. Water flooding experiments demonstrate that:(1) The viscosity of the produced oils increases at low temperatures and decreases at high temperatures as the water cut increases. With the increase in temperature, the content of resins in the produced oils from different water flooding stages decreases, and the content of asphaltenes increases slightly.
(2) The composition of the produced oils from different water flooding stages is different. Compared with the no water cut and high water cut stages, the changes in the produced oils of the low water cut stages are significant at different temperatures.
(3) Water flooding preferentially extracts light fractions of the oils. The relative content of the small-molecular hydrocarbons may affect the viscosity of the produced oils.
(4) The molecular selectivity of heteroatoms increases during the water flooding process with increasing temperature. Water flooding preferentially extracts small-molecule heteroatoms with low condensation degrees.
The study of the properties and compositional changes in the water flooding process can provide explanations for the viscosity-forming mechanism of crude oil and the watered-out phenomenon during development. The property changes of the remaining oil can also be indirectly obtained, which provides a reference for the further development of oilfields.
Author contributions
Bo Zhang: data curation, formal analysis, investigation, methodology, writing-original draft; Zheyu Liu: project administration, supervision, writing-review & editing; Han Zhang: data curation, formal analysis; Quan Shi: project administration, resources, writing-review & editing; Yiqiang Li: project administration, resources, writing-review & editing; chunming Xu: project administration, supervision.Conflicts of interest
The authors declare that they have no known competing financial interests or personal relationships that could have appeared to influence the work reported in this paper.References
- J. H. Duerksen and L. Hsueh, Steam distillation of crude oils, Soc. Pet. Eng. J., 1983, 23(2), 265–271 CrossRef CAS.
- Z. Y. Liu, S. Mendiratta, X. Chen, J. Zhang and Y. Q. Li, Amphiphilic-polymer-assisted hot water flooding toward viscous oil mobilization, Ind. Eng. Chem. Res., 2019, 58(36), 16552–16564 CrossRef CAS.
- K. Guo, H. L. Li and Z. X. Yu, In situ heavy and extra-heavy oil recovery: a review, Fuel, 2016, 185, 886–902 CrossRef CAS.
- E. Y. Kovalenko, V. P. Sergun, R. S. Min and T. A. Sagachenko, Characteristic structural features of asphaltene macromolecules in heavy crude oil from the Usinsk Field, Chem. Technol. Fuels Oils, 2014, 49(6), 522–531 CrossRef CAS.
- A. B. Bazyleva, M. D. Anwaru lHasan, M. Fulem, M. Becerra and J. M. Shaw, Bitumen and heavy oil rheological properties: reconciliation with viscosity measurements, J. Chem. Eng. Data, 2010, 55(3), 1389–1397 CrossRef CAS.
- T. G. Wang and Z. H. Zhang, Theory and practice of reservoir geochemistry, Chin. Sci. Bull., 1997,(19), 2017–2025 CrossRef.
- J. Yang, Z. D. Wang, H. B. Bo, T. Zhang, S. J. Ji and J. Y. Wang, Evolution characteristics of trifluorene compounds in the extracts of oil shale of Xiamaling Formation by thermal simulation test, Nat. Gas Geosci., 2019, 30(7), 1063–1071 Search PubMed.
- X. C. Chang, T. T. Sun, Y. Wang, T. Wang and J. Cui, Geochemical alteration of waterflooded oils and the controlling factors, J. Earth Sci. Environ., 2017, 39(6), 807–825 Search PubMed.
- C. Y. Lin, W. G. Wang, C. M. Dong, X. G. Zhang, L. H. Ren and X. F. Shi, New progress in the quantitative simulation technology of fluid-rock interaction, J. Earth Sci. Environ., 2017, 39(4), 491–515 Search PubMed.
- N. J. L. Bailey, H. R. Krouse, C. R. Evans and M. A. Rogers, Alteration of crude oil by waters and bacteria—evidence from geochemical and isotope studies, Am. Assoc. Pet. Geol. Bull., 1973, 57(7), 1276–1290 CAS.
- C. L. Shi, Y. L. Ji, Q. S. Li and Z. H. Tan, Research on the influnce of water flooding development on crude oil properties, J. Southwest Pet. Univ., Sci. Technol. Ed., 2010, 32(3), 112–116 CAS.
- Y. M. Zhu, H. X. Weng, Z. L. Chen and Q. Chen, Compositional modification of crude oil during oil recovery, J. Pet. Sci. Eng., 2003, 38(1), 1–11 CrossRef CAS.
- X. C. Chang, G. L. Wang, H. H. Guo, J. Cui and T. Wang, A case study of crude oil alteration in a clastic reservoir by waterflooding, J. Pet. Sci. Eng., 2016, 146, 380–391 CrossRef CAS.
- E. Lafargue and P. Le Thiez, Effect of waterwashing on light ends compositional heterogeneity, Org. Geochem., 1996, 24(12), 1141–1150 CrossRef CAS.
- L. C. Kuo, An experimental study of crude oil alteration in reservoir rocks by water washing, Org. Geochem., 1994, 21(05), 465–479 CrossRef CAS.
- X. Wang, W. F. Liu, L. T. Shi, Z. H. Zou, Z. B. Ye, H. Wang and L. J. Han, A comprehensive insight on the impact of individual ions on Engineered Waterflood: With already strongly water-wet sandstone, J. Pet. Sci. Eng., 2021, 207, 109153 CrossRef CAS.
- J. J. Guo, J. F. Chen, F. L. Li, W. B. Duan and Y. F. Wang, Influence of water washing on crude oils during water flooding, Geochimica, 2007, 36(2), 215–221 CAS.
- Y. H. Xu, T. G. Wang, N. X. Chen, C. M. Yang and Q. L. Wang, DBT parameters and dynamic monitoring during reservoir development, and distribution region prediction of remaining oil: a case study on the Sha-33 oil reservoir in the Liubei region, Nanpu sag, Sci. China Earth Sci., 2012, 55(12), 2018–2025 CrossRef CAS.
- X. C. Chang, Y. Wang, Y. H. Xu, J. Cui and T. Wang, On the changes of polycyclic aromatic compounds in waterflooded oil and their implications for geochemical interpretation, Org. Geochem., 2018, 120, 56–74 CrossRef CAS.
- Z. L. Chen, Y. M. Zhu and Q. Chen, The change of crude oil components in different production stages, Acta Sedimentol. Sinica, 2002, 20(1), 169–173 Search PubMed.
- R. K. Chai, Y. T. Liu and Y. T. He, Alteration mechanisms of crude oil components in water-flooding, Pet. Sci. Bull., 2021, 6(1), 114–126 Search PubMed.
- X. C. Chang, M. Z. Wang, H. H. Guo, Q. C. Chen and Y. G. Duan, Dynamic variations of oil compositions during the course of waterflood development, J. China Univ. Min. Technol., 2009, 38(3), 373–379 CAS.
- X. Y. Liu, Y. Q. Li, Z. H. Feng, J. K. Li and S. Q. Guo, The change of crude oil components under different production degrees, Acta Sedimentol. Sinica, 2000, 18(2), 324–326 Search PubMed.
- X. Cao, B. Peng, S. T. Ma, H. X. Ni, L. Z. Zhang, W. L. Zhang, M. Y. Li, C. S. Hsu and Q. Shi, Molecular selectivity in supercritical CO2 extraction of a crude oil, Energy Fuels, 2017, 31(5), 4996–5002 CrossRef CAS.
- L. D. Yu, Distribution of world heavy oil reservoirs and its recovery technologies and future, Spec. Oil Gas Reservoirs, 2003, 43(7), 1141–1148 Search PubMed.
- Q. Jiang, H. J. You, J. J. Pan, Z. Y. Wang, P. Y. Gai, I. Gates and J. L. Liu, Preliminary discussion on current status and development direction of heavy oil recovery technologies, Spec. Oil Gas Reservoirs, 2020, 27(6), 30–39 Search PubMed.
- M. K. Zhai, Q. J. Du, Y. L. liu, G. H. Wu, J. F. Sun, Y. Sha and J. Hou, Potential of a new water-soluble agent for enhancing heavy oil recovery: a pore-scale investigation, J. Pet. Sci. Eng., 2022, 208, 109646 CrossRef CAS.
- D2007-19 ASTM, Standard test method for characteristic groups in rubber extender and processing oils and other petroleum-derived oils by the clay–gel absorption chromatographic method, American Society for Testing and Materials International, West Conshohocken, 2019 Search PubMed.
- L. A. Strelets and S. O. Ilyin, Effect of enhanced oil recovery on the composition and rheological properties of heavy crude oil, J. Pet. Sci. Eng., 2021, 203, 108641 CrossRef CAS.
- P. M. Spiecker, K. L. Gawrys, C. B. Trail and P. K. Kilpatrick, Effects of petroleum resins on asphaltene aggregation and water-in-oil emulsion formation, Colloids Surf., A, 2003, 220(1–3), 9–27 CrossRef CAS.
| This journal is © The Royal Society of Chemistry 2022 |

