DOI:
10.1039/D2RA04473K
(Paper)
RSC Adv., 2022,
12, 29010-29021
Exploration of the interesting photovoltaic behavior of the fused benzothiophene dioxide moiety as a core donor with modification in acceptors for high-efficacy organic solar cells†
Received
19th July 2022
, Accepted 5th September 2022
First published on 11th October 2022
Abstract
Non-fullerene-based chromophores with end-capped acceptor modification used in organic solar cells (OSCs) have proven to offer improved performance. Therefore, eight unique benzothiophene-based molecules (D2–D9) were designed by the end-capped acceptor manipulation of a reference molecule (R1). Density functional theory (DFT) and time-dependent density functional theory (TD-DFT) calculations at the B3LYP level were performed to investigate various parameters such as the optical properties, frontier molecular orbitals (FMOs), transition density matrix (TDM), binding energy, density of states (DOS), open-circuit voltage (Voc), and reorganization energies of electrons (λe) and holes (λh), to better understand the optoelectronic properties of the newly designed compounds. All the derivatives had broader absorption spectra of 737.562–700.555 nm with a reduced energy gap of 2.132–1.851 eV compared to those of the reference (719.082 nm), except for D8 and D9. A comparable value of Voc and lower reorganization energies were found in the derivatives compared to those of R1. Within the studied compounds, D3 was predicted to be a good optoelectronic material for environmentally friendly organic solar cells (EFOSCs) because of its superior optoelectronic capabilities, low-energy band gap (1.851 eV), highest λmax values of 794.516 and 744.784 nm in chloroform and the gas phase, respectively, and lowest transition energy (1.561 eV) than those of the reference and the other derivatives. Subsequently, end-capped acceptor modification was proven to be an effective method to achieve desired optoelectronic characteristics.
1 Introduction
Over the last few years, the performance of organic solar cells has dramatically improved, particularly due to the synthesis of small compounds such as non-fullerene acceptors (NFAs) that can cost-effectively produce an impressive photovoltaic response.1,2 Organic compounds such as non-fullerene electron acceptors have improved solar light-emitting performance and energy efficiency.3 Currently, organic solar cells based on NFAs have a power conversion efficiency (PCE) of 18%. The applications of NFAs with an acceptor–donor–acceptor (A–D–A) structure have been receiving increasing attention due to their charge mobilities, long-range absorption, and fine-tuned energy levels.4 The most powerful NFAs have A–D–A structures, with a fused electron-donating core and two electron-accepting end groups. Therefore, a lot of researchers are working on acceptors other than the fullerene A–D–A structure with optimized charge dispersions, absorption, and energy levels5 to improve the PCE values.6 For quite a long time, silicon was considered the most suitable material for use as a semiconductor in photovoltaic devices. The key factors behind the prominent position of silicon in solar cells during the last 60 years of development include its extensive stability, large natural abundance,7 eco-friendly nature and high PCE of about 46%. However, a limiting factor in these types of solar cells is the increase in cost per watt with the increase in efficiency along with a low light-absorption rate.8 Compared with traditional silicon solar cells, dye-sensitized solar cells (DSSCs) have several merits such as light weight, low cost, easy fabrication and flexibility.9 This might be due to the narrow absorption spectrum range and quick recombination of electron–hole pairs on the surface of the photoanode.10 In recent years, organic solar cells (OSCs) have proved to be an efficient and successful replacement of traditional silicon and DSSCs in terms of energy generation. OSCs have cemented their place in foldable and flexible applications because of their flexibility and light weight. OSCs as an attractive renewable energy platform offer advantages in terms of their flexibility, strength, tunable energy levels, wide area for fabrication and low cost.11 Fullerene-based OSCs offer a notable PCE of 12% in bulk heterojunctions (BHJs), affording a sufficient short-circuit current (Jsc) and open-circuit voltage (Voc).12 OSCs in combination with fullerene acceptors can achieve high isotropic charge mobility13 and low reorganization energy. Despite their good performance, limitations such their high cost, non-tunable capacity of the lowest unoccupied molecular orbital (LUMO) energy, reduced absorption of sunlight in the visible region, low Voc, high band gap and poor morphological reliability make fullerene acceptors less efficient.14 To overcome these downsides, scientists are working on designing organic photovoltaic materials based on non-fullerene acceptors (NFAs). These non-fullerene organic photovoltaic (NF-OPV) materials are good replacements for their fullerene counterparts due to their acclaimed properties such as extended light-absorption ability, low voltage loss, easy molecular engineering for fabrication, solubility, tunable energy levels, and high morphological and photochemical stability.15 Most of the organic non-fullerene acceptor dyes retain the acceptor–donor–acceptor (A–D–A) backbone architecture. The A–D–A combination comprises a central electron-donating core unit blended with two sideways end-capped acceptor moieties. The most prominent reported example of the A–D–A architecture is ITIC,16 which shows promising optoelectronic properties such as a small band gap and long absorption range with a PCE of 16%.17 The most effective strategy to enhance the photovoltaic properties of NF-OSCs is to narrow the HOMO–LUMO energy gap via structural alteration and functional-group modification. Selecting proper electron-donor and -acceptor components can significantly reduce the HOMO–LUMO energy gap, increase the PCE and improve the photovoltaic properties of non-fullerene-based OSCs. Appropriate arrangement of the acceptor, donor and acceptor plays a vital role in designing potential organic compound dyes. Keeping in mind the above discussion, we utilized R1, an NF-SMA with benzothiophene dioxide (BO) terminal groups attached to phenyl side moieties, as a reference molecule.18 A series of eight new fullerene-free acceptor chromophores has been developed from R1. End-capped acceptor modifications were brought about in the reference chromophore. The electronic, photophysical, and photovoltaic materials of the predicted molecules (D2–D9) and their charge transfer in comparison to that of R1 have been illustrated using TDM, FMO, dipole moment, DOS, reorganization energy, Voc and absorption maximum analyses. It is expected that these newly designed derivatives will play a key role in the progress of high-efficacy OSC materials.
2 Results and discussion
2.1 Molecular chemistry
This work used the DFT technique to study the optoelectronic properties of eight novel fullerene-free acceptor molecules (D2–D9) designed via structural manipulation at the terminal acceptors. For this, ITBCR19 was selected as the parent molecule, comprising a central benzo[b]thiophene-3(2H)-one 1,1-dioxide core unit linked by (Z)-2-(2-ethylidene-1,1-dioxidobenzo[b]thiophen-3(2H)-ylidene)malononitrile, which acts as a donor (D) moiety along with terminal electron-withdrawing acceptor (A) units. To eliminate steric hindrance and reduce the computational cost brought about by the long alkyl chains in ITBCR, the alkyl group C6H13 was replaced with a methyl (–CH3) group, as shown in Fig. 1, and its name was changed from ITBCR to R1 (Scheme 1).
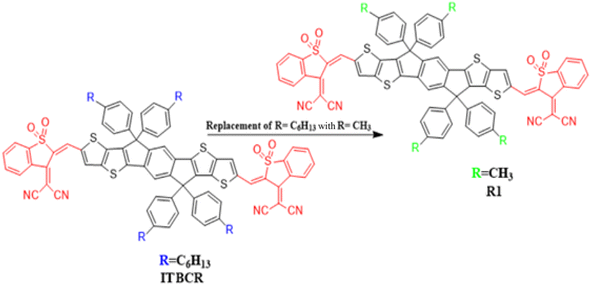 |
| | Fig. 1 Modification of ITBCR into R1 via the substitution of a –CH3 group. | |
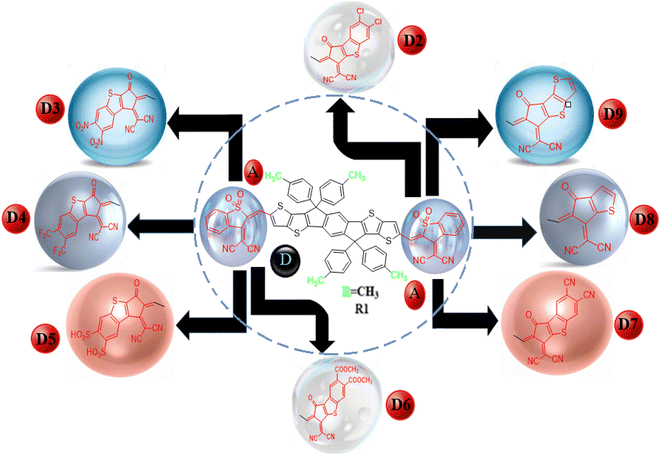 |
| | Scheme 1 Schematic of the non-fullerene acceptor units. | |
We changed the terminal acceptors of R1 with various well-known end-capped acceptors to explore and boost the optoelectronic and photophysical properties of OSCs. The structures of R1 and its derivatives (D2–D9) in optimized form are depicted in Fig. 2.
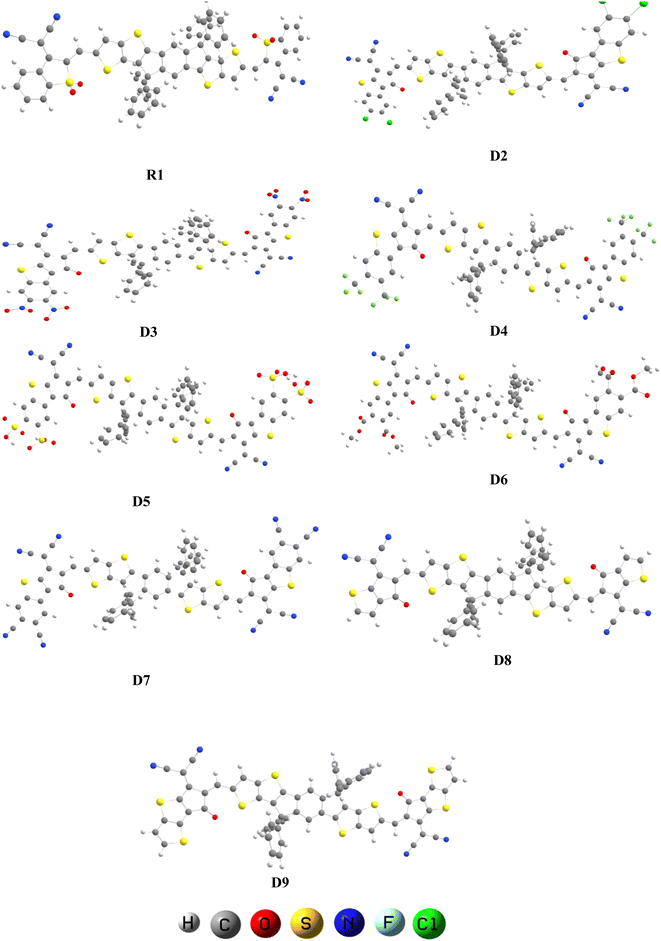 |
| | Fig. 2 Optimized geometries of R1 and D2–D9. | |
2.2 Frontier molecular orbital (FMO) analysis
The electrical and optical properties of R1 and D2–D9 were studied via FMO analysis.20 The HOMO is generally an electron donor, whereas the LUMO is considered to be an electron acceptor. ELUMO − EHOMO is known as the band gap (Eg).21 FMO investigations of R1 and the designed chromophores (D2–D9) were performed using the B3LYP/6-31G(d,p) level of DFT, and the FMO orbitals are shown in Fig. 3. Large EHOMO − ELUMO energy gap molecules are termed as hard molecules with low chemical reactivity and great stability. However, small ELUMO − EHOMO energy gaps are associated with soft molecules possessing high reactivity, low stability and great polarizability.22,23 The energy gap and energies of the HOMO (EHOMO) and LUMO (ELUMO) of R1 and D2–D9 were calculated and the results are shown in Table 1.
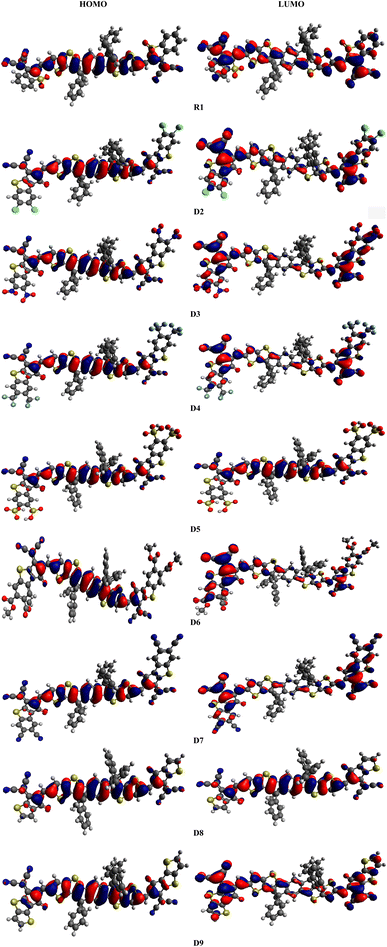 |
| | Fig. 3 Frontier molecular orbital diagrams of R1 and D2–D9. | |
Table 1 Calculated EHOMO, ELUMO and energy gap (ΔE) of compounds R1 and D2–D9a
| Compounds |
EHOMO |
ELUMO |
Band gap |
| Band gap = ELUMO − EHOMO (eV). |
| R1 |
−5.574 |
−3.571 |
2.003 |
| D2 |
−5.476 |
−3.476 |
2.000 |
| D3 |
−5.591 |
−3.740 |
1.851 |
| D4 |
−5.516 |
−3.549 |
1.967 |
| D5 |
−5.580 |
−3.689 |
1.891 |
| D6 |
−5.489 |
−3.519 |
1.970 |
| D7 |
−5.577 |
−3.685 |
1.892 |
| D8 |
−5.427 |
−3.295 |
2.132 |
| D9 |
−5.400 |
−3.297 |
2.103 |
The calculated values of EHOMO and ELUMO for R1 are found to be −5.574 and −3.571 eV, respectively, with an energy gap of 2.003 eV. Meanwhile, the experimental values for the HOMO/LUMO have been determined to be −5.61/−4.13 eV with a 1.48 eV energy gap. A close harmony is thus seen between the DFT and experimental values, which confirms the suitable selection of the functional used for computational analysis.19 Similarly, the EHOMO energies are determined to be −5.476, −5.591, −5.516, −5.580, −5.489, −5.577, −5.427 and −5.400 eV, while the ELUMO values are −3.476, −3.740, −3.549, −3.689, −3.519, −3.685, −3.295 and −3.297 eV for D2–D9, respectively. The most important factor for describing the charge transport and optoelectronic properties in molecules is ΔE, and the energy gaps of R1 and D2–D9 are found to be 2.003, 2.000, 1.851, 1.967, 1.891, 1.97, 1.892, 2.132 and 2.103 eV, respectively (Table 1). The Eg has been found to decrease in all the designed compounds (D3–D7) except for D8 and D9, which exhibited band gaps a little bit larger than that of R1. In D2, a reduction in the band gap (2.000 eV) is found due to the addition of a thiophene ring and chloro (–Cl) groups at the acceptor moiety, which may enhance the electron-withdrawing effect along with the resonance. The band gap in D3 (1.851 eV) is found to decrease because the –Cl groups are replaced with nitro (–NO2) groups at the acceptor unit. As –NO2 groups have a greater negative inductive (−I) effect than –Cl (NO2 > Cl),24 the energy gap of D3 is reduced compared to that of D2. In the case of compound D4, an increase in the band gap (1.967 eV) is found compared to that of D3, as the –NO2 groups at the acceptor are replaced with trifluoromethyl (–CF3) groups. This might be due to –CF3 exhibiting a lower electron-withdrawing ability than the –NO2 group.25 Further decline in the band gap is found in D5 (1.891 eV), in which the –CF3 groups at the acceptor unit are replaced with sulfonic acid (–SO3H) groups. Moreover, with the replacement of the –SO3H group with the acetic acid (–CH3COOH) group at the acceptor moiety, the ΔE of D6 (1.970 eV) is found to increase. This increment in the energy gap might be due to the weaker electron-withdrawing –CH3COOH group (compared to the –SO3H group). The band gap of D7 (1.892 eV) is less than that of D6 (1.970 eV) because of the replacement of –CH3COOH with –CN groups at the acceptor moiety. This reduction in the energy gap is due to the −I effect of the electron-withdrawing –CN groups. In compound D8, the band gap (2.132 eV) is observed to increase compared to that of D7 (1.892 eV) because of the removal of one fragment (2-ethylidene-3-methylene-succinonitrile) from the acceptor unit. Owing to the removal of this fragment, the conjugation of the system is reduced and the Eg was enhanced. Finally, the energy gap of D9 (2.103 eV) is observed to decrease compared to that of D8 (2.132 eV) because of the replacement of a benzene ring with a thiophene ring into the system at the terminal acceptor. Because of this alteration, the conjugation in the molecule is reduced, resulting in an enhancement in the band gap. Overall, in R1 and D2–D9, the ΔE values are found to decrease in the order: D8 > D9 > R1 > D2 > D6 > D4 > D7 > D5 > D3. The electrical cloud transmission phenomenon is frequently described using the contour elements in FMO.26 Pictographs of the molecular orbitals exhibiting the charge densities of the aforementioned compounds are presented in Fig. 3. Generally, the HOMO density lies over the central donor unit and a slight amount of it is over the peripheral acceptors; whereas for the LUMO, the electronic cloud is found predominantly over the end-capped acceptor moieties, and a little amount of it is concentrated over the central donor, except for D5 and D8, where the charge is located over the central part (Fig. 3).
2.3 Optical properties
To elucidate the working potential of optoelectronic devices, UV-vis spectral analysis can provide a clear understanding of the spectral and optoelectronic properties.27 UV-vis spectroscopy is a useful technique for the determination of the nature of transitions and charge-transfer characteristics. The absorption spectra of the designed compounds R1 and D2–D9 were calculated using TD/DFT computation at the B3LYP/6-31G(d,p) functional level in chloroform and in the gaseous phase.28 Various parameters such as the λmax, transition energy, oscillation strength (fos) and molecular orbital contributions of the studied chromophores have been presented in Tables 2 and 3. The simulated absorption spectra of the analyzed chromophores (R1, D2–D9) are portrayed in Fig. 4.
Table 2 Calculated energy (E), wavelength (λmax), oscillation strength (fos) and nature of the molecular orbital (MO) contributions of R1 and D2–D9 in chloroform
| Compound |
λ (nm) |
E (eV) |
fos |
MO contributions |
| R1 |
719.082 |
1.724 |
2.739 |
H → L (99%) |
| D2 |
737.562 |
1.681 |
1.786 |
H → L (97%) |
| D3 |
794.516 |
1.561 |
1.663 |
H → L (98%) |
| D4 |
747.839 |
1.658 |
1.781 |
H → L (97%) |
| D5 |
778.257 |
1.593 |
1.738 |
H → L (98%) |
| D6 |
747.929 |
1.658 |
1.750 |
H → L (97%) |
| D7 |
778.795 |
1.592 |
1.711 |
H → L (97%) |
| D8 |
682.657 |
1.816 |
2.229 |
H → L (98%) |
| D9 |
700.555 |
1.770 |
1.930 |
H → L (96%) |
Table 3 Calculated energy (E), wavelength (λmax), oscillation strength (fos) and nature of the molecular orbital (MO) contributions of R1 and D2–D9 in the gas phase
| Compound |
λ (nm) |
E (eV) |
fos |
MO contributions |
| R1 |
673.242 |
1.842 |
2.375 |
H → L (100%) |
| D2 |
693.928 |
1.787 |
1.498 |
H → L (96%) |
| D3 |
744.784 |
1.665 |
1.343 |
H → L (97%) |
| D4 |
705.217 |
1.758 |
1.465 |
H → L (97%) |
| D5 |
738.749 |
1.678 |
1.387 |
H → L (97%) |
| D6 |
701.030 |
1.769 |
1.433 |
H → L (97%) |
| D7 |
734.504 |
1.688 |
1.374 |
H → L (97%) |
| D8 |
643.773 |
1.926 |
1.885 |
H → L (98%) |
| D9 |
661.955 |
1.873 |
1.618 |
H → L (96%) |
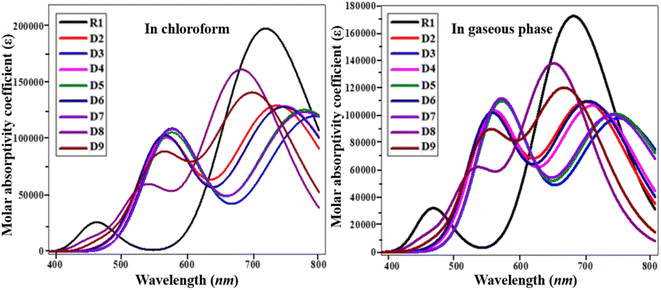 |
| | Fig. 4 UV-visible absorption spectra of the investigated molecules (R1 and D2–D9). | |
In chloroform solvent, the values of the maximum absorbed wavelength exist in the range of 682.657 to 794.516 nm. D3 showed a maximum absorption wavelength of 794.516 nm, the furthest away from the experimental outcome for the parent chromophore (711 nm).29 It also exhibited the lowest E among the reference and derivatives due to its strong electron-withdrawing nitro group in the acceptor unit, with an excitation energy of 1.561 eV. A low excitation energy and low band gap lead to improved charge mobility with a high power conversion efficiency.30 In chloroform, the maximum absorption peaks for the D2–D9 molecules are 737.562, 794.516, 747.839, 778.257, 747.929, 778.795, 682.657 and 700.555 nm, respectively. The lowest value of λmax is in the case of D8 (682.657 nm) due to the attachment of a weakly electron-withdrawing end-capped acceptor group. In the chloroform solvent, the decreasing order of the studied chromophores with respect to their λmax in chloroform is D3 > D7 > D5 > D6 > D4 > D2 > R1 > D9 > D8.
In the gaseous phase, the maximum absorbed wavelength of all the investigated chromophores also lies in the visible region. Herein, the calculated absorbed wavelength was examined in the range of 643.773–744.784 nm. The maximum absorbed wavelength of the reference chromophore (R1) is 673.242 nm. Except for D8 and D9, all the investigated chromophores possess higher wavelengths than the reference molecule. Like in the solvent phase, D3 also exhibited the highest λmax among the investigated molecules. A small decrease in the values of λmax of the studied chromophores in the gas phase is observed, which might be due to the solvent effect,31 as shown in Table 3. In the gas phase, the maximum absorbed wavelength decreases in the order of D3 > D5 > D7 > D4 > D6 > D2 > R1 > D9 > D8. D3 shows the smallest transition energy, the lowest energy gap, and the largest maximum value, which are favorable parameters for utilizing a material's optoelectronic properties in organic solar cell applications.32 The above discussion concludes that red-shifted compounds with a low energy gap and a strong charge-transfer ability, resulting in a good PCE, can be used as efficient materials in non-fullerene OSCs.
2.4 Reorganization energy
The reorganization energy (RE) is an important feature to recognize the relationship between a compound structure and its capacity to transfer charge efficiently.33 The performance and working capability of OSCs is mainly dependent upon the reorganization energy, which is actually the electron and hole transport ability of different materials.34 Therefore, in order to understand the charge mobility, i.e., the hole mobility (λh) and electron mobility (λe), of the studied chromophores, the RE was calculated at the B3LYP/6-31G(d,p) functional level (Table 4).
Table 4 Computed reorganization energies of the R1 and D2–D9 chromophores
| Compounds |
λe (eV) |
λh (eV) |
| R1 |
−0.00002673 |
0.00018773 |
| D2 |
−0.00000762 |
−0.33841872 |
| D3 |
0.00003289 |
0.00009158 |
| D4 |
−0.00003688 |
0.00005475 |
| D5 |
0.00005186 |
0.00007521 |
| D6 |
−0.00004563 |
0.00011363 |
| D7 |
0.00002929 |
0.00008763 |
| D8 |
0.00026435 |
0.00009166 |
| D9 |
0.0001786 |
0.00009157 |
Essentially, the RE can be categorized into the internal reorganization energy (λint) and external reorganization energy (λext). λint provides knowledge about quick changes in the internal structures, whereas λext only deals with the external structural environment. λext has little impact; hence this factor was overlooked in favor of the internal reorganizational energy. The computed λe of the reference and derivatives are found to be −0.00002673, −0.00000762, 0.00003289, −0.00003688, 0.00005186, −0.00004563, 0.00002929, 0.00026435 and 0.0001786 eV, respectively. D6 has the lowest λe value (−0.00004563 eV) of the studied molecules, indicating its faster electron mobility. The descending order of λe is D6 > D4 > R1 > D2 > D7 > D3 > D5 > D9 > D8. Consequently, for R1 and D2–D9, the predicted λh values are 0.00018773, −0.33841872, 0.00009158, 0.00005475, 0.00007521, 0.00011363, 0.00008763, 0.00009166, and 0.00009157 eV, respectively. For the designated molecules, the increasing order of λh is D2 > D4 > D5 > D7 > D9 > D3 > D8 > D6 < R1. The overall discussion concludes that the lower λh values of all the derivatives expressed a greater rate of hole transport in them than in the reference molecule, except for D2. This investigation reveals a greater charge-transport rate in the aforementioned chromophores, which indicated their potential as effective candidates for OSCs.
2.5 Density of states (DOS)
DOS analysis is considered to be an efficient tool to examine the charge densities on the chromophores and provides support for the investigations performed in the FMO study.35,36 Herein, DOS analysis was executed for the studied chromophores to examine the charge-transfer rate, and the resulting graphs are shown in Fig. 5. We separated our compounds into two groups for the purpose of explaining the DOS analysis, i.e., the central donor and sideways acceptors, as shown with black and red lines in the maps, respectively. The electronic distribution patterns on the acceptors for R1 and D2–D9 are found to be 23.9%, 23.1%, 23.7%, 23.1%, 23.6%, 23.1%, 23.6%, 22.0% and 22.8% for the HOMO and 66.5%, 79.4%, 83.8%, 79.8%, 81.7%, 80.8%, 82.3%, 70.4% and 75.4% for the LUMO, respectively. Similarly, the donor contributes 76.1%, 76.9%, 76.3%, 76.9%, 76.4%, 76.9%, 76.4%, 78.0% and 77.2% to the HOMO and 33.5%, 20.6%, 16.2%, 20.2%, 18.3%, 19.2%, 17.7%, 29.6% and 24.6% to the LUMO in R1 and D2–D9, respectively.37 For the HOMO, the charge density is predominantly present on the donor moiety but partly on the acceptor units, whereas the LUMO is found mostly on the acceptor components, as shown by the green and red peaks in the maps. DOS analysis revealed a high degree of charge coherence from the central donor to the end-group acceptor region, especially near the end-capped groups, as well as a significant delocalization of the electronic structure, as discussed in the FMO analysis.
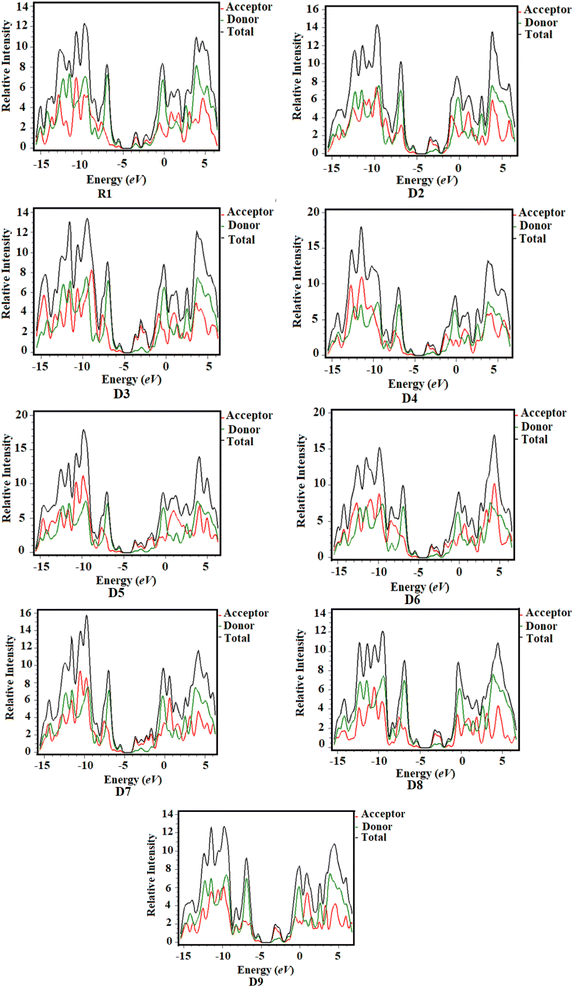 |
| | Fig. 5 Density of states (DOS) of the studied chloroforms as represented graphically. | |
2.6 Open-circuit voltage (Voc) analysis
The Voc is an important parameter that plays a vital role in determining the working potential of OSCs38,39 and is defined as the highest electric current that can readily be obtained from an optical material.40 Certain key factors, such as light intensity, light source, charge-carrier recombination, external fluorescence proficiency and work functions of the electrodes, greatly affect the Voc.41 The Voc can be calculated by taking the difference of the HOMO of the donor polymer molecule and the LUMO of the acceptor molecule. To achieve a higher Voc, the LUMO of the acceptor moiety should be higher than the HOMO of the donor, as this reduces the band gap.42 The theoretically computed results of Voc, calculated using the equation given by Scharber et al.,43 are presented in Table 5.| | |
Voc = (|EDHOMO| − |EALUMO|) − 0.3
| (1) |
Here, E denotes the elementary charge of the acceptors, signifying the charge on each molecule, and 0.3 is the empirical constant. A well-known donor polymer, PM6,44 with HOMO/LUMO energies of 5.171 and −2.524 eV, respectively, has been utilized to examine the Voc values, as shown in Table 5.
Table 5 Open-circuit voltage of the studied compoundsa
| Compounds |
Voc (V) |
ΔE |
| ΔE = EALUMO − EDHOMO |
| R1 |
1.30 |
2.003 |
| D2 |
1.395 |
2.000 |
| D3 |
1.131 |
1.851 |
| D4 |
1.322 |
1.967 |
| D5 |
1.182 |
1.891 |
| D6 |
1.352 |
1.970 |
| D7 |
1.186 |
1.892 |
| D8 |
1.576 |
2.132 |
| D9 |
1.574 |
2.103 |
The computed Voc value of the reference chromophore shows excellent agreement with its experimental value of 0.86 V,19 which indicated the suitable selection of the level of theory for our study of the photovoltaic properties of R1 and D2–D9, whose LUMOacceptor values are 1.3, 1.395, 1.131, 1.322, 1.182, 1.352, 1.186, 1.576 and 1.574 V, respectively. The Voc of the studied chromophores decreased in the order of D8 > D9 > D2 > D6 > D4 > R1 > D7 > D5 > D3. Among all the compounds, D8 had the highest Voc value (1.576 V). The other designed derivatives showed comparable open-circuit voltages with that of the reference molecule. A low-lying LUMO leads to improved Voc values with an enhanced photovoltaic response. The orbital energy diagrams of all the investigated chromophores blended with PM6 are shown in Fig. 6. It is clear from Fig. 6 that the LUMO level of the acceptor molecules (R1 and D2–D9) lies below the HOMO of the donor PM6 polymer. This kind of placement of molecular orbitals enables facile transfer of the electron cloud from PM6 to the acceptor, leading to enhanced optoelectronic behavior.
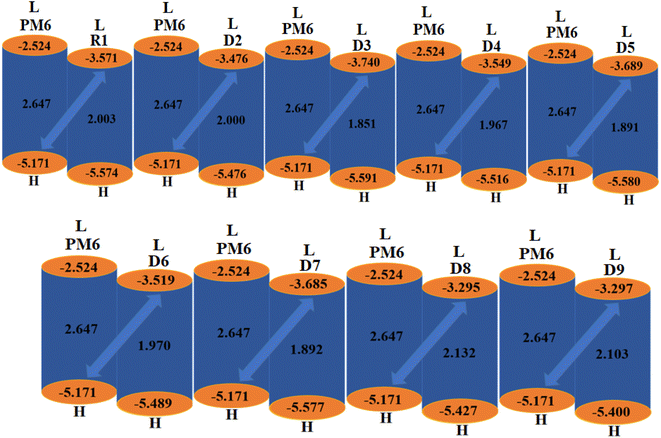 |
| | Fig. 6 Graphical representation of the Voc for the studied chromophores with PM6. | |
2.7 Transition density matrix (TDM)
Various types of transitions in the reference and tailored chromophores were evaluated via TDM analysis. TDM study elucidates the charge transport inside molecules, making it a crucial analysis for determining the performance of OSCs. Applying the B3LYP/6-31G(d,p) functional, the emission and absorption of electronic charges for S1 from the S0 state were calculated (Fig. 7). The contribution of hydrogen to the transition is so minor that it is neglected in the current study. The TDM approach is crucial for estimating the excited state phenomena of electronic excitation and electron–hole localization.45,46 R1 and D2–D9 are split into two segments: the acceptor (the end-capped molecule: A) and donor (the core component: D). Fig. 7 indicates that effective charge is present at the terminal acceptor moieties, as higher-electron intensity green and red spots can be seen over those portions. According to the results obtained from the TDM heat maps, it has been observed that the electronic charge is efficiently transferred in a diagonal way from the donor to the acceptor in all the derivatives without trapping, thus showing charge coherence.
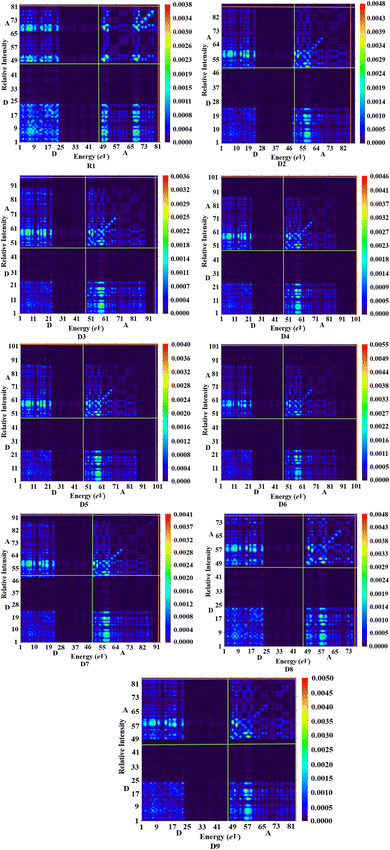 |
| | Fig. 7 TDM analysis in the reference state S1 and for the designed compounds. | |
2.8 Exciton binding energy (Eb)
Eb is defined as the difference between the HOMO and LUMO with the first singlet-to-singlet excitation state energy (Eopt) and is an important component that aids researchers in exploring the photovoltaic response of OSCs.47 The interaction of the coulombic forces between the electrons (λe) and the holes (λh) is measured by the binding energy. Low-binding-energy molecules have a high power conversion efficiency and a high current charge density (Jsc).48,49 Eqn (2) was used to compute the Eb of the R1 and D2–D9 acceptor molecules, where EH–L represents the energy difference between the HOMO and LUMO.
Table 6 shows the DFT-estimated findings of the Eb of the studied compounds in chloroform.
Table 6 Calculated Eb of the R1 and D2–D9 compoundsa
| Compounds |
EH–L |
Eopt |
Eb |
| Units in eV. |
| R1 |
2.003 |
1.724 |
0.279 |
| D2 |
2.000 |
1.681 |
0.319 |
| D3 |
1.851 |
1.561 |
0.290 |
| D4 |
1.967 |
1.658 |
0.309 |
| D5 |
1.891 |
1.593 |
0.298 |
| D6 |
1.97 |
1.658 |
0.312 |
| D7 |
1.892 |
1.592 |
0.300 |
| D8 |
2.132 |
1.816 |
0.316 |
| D9 |
2.103 |
1.770 |
0.333 |
Table 6 shows that all the derivatives exhibited comparable values of binding energies with their reference chromophores. For all the molecules, the descending pattern of Eb is as follows: D9 < D2 < D8 < D6 < D4 < D7 < D5 < D3 < R1. Structures with an Eb of 2.1 eV or below are generally considered to be efficient OSC materials with a high Voc.49 Interestingly, all our compounds exhibited Eb values lower than 2.1 eV, which illustrates their high exciton dissociation rate and large charger transfer rate, as shown in the TDM maps. All these investigations suggest that these designed molecules would be effective photovoltaic materials.
3 Conclusions
Advanced quantum chemistry techniques have been successfully employed to investigate the optoelectronic, photophysical and photovoltaic properties of newly designed A–D–A-type fullerene-free chromophores. Terminal structural tailoring has proven to be the most important strategy for developing high-performance photovoltaic materials with good optoelectronic properties for efficient OSCs. The FMO findings reveal a diminishing energy gap between the HOMO and LUMO with effective charge transfer in the derivatives, which is further supported by TDM and DOS investigations. Comparing the absorption properties, the derivatives show a red shift in their emission spectra (λmax = 794.516–737.562 nm in chloroform and 744.784–693.928 nm in the gas phase) compared to that of R1 (λmax = 719.082 nm in chloroform and 673.242 nm in the gas phase), except for D8 and D9. Furthermore, TDM analysis demonstrated that the end-capped substituents could rapidly extract electron density, resulting in an increased charge-transfer rate when tailored with the acceptors. Moreover, the Voc was also estimated with regards to HOMOPM6–LUMOacceptor and all the derivatives show comparable voltage results with the reference molecule. Our predicted molecules might have good photovoltaic and electronic properties, as evidenced by their excitation binding energies and moderate reorganization. According to our findings, end-capped terminal modification is a useful technique for developing novel and highly competitive photovoltaic materials with good electrical and optical properties. It is suggested that the predicted compounds should be synthesized to create highly efficient organic solar cells.
4 Computational procedure
All the computations of this study were performed with the aid of the Gaussian 09 (ref. 50) program. Gauss View 5.0 (ref. 51) was used to create the input data and to display the results. To optimize the geometry of the reference compound (R1) without symmetry reduction, five exchange–correlation (XC) functionals were utilized: B3LYP,52 CAM-B3LYP,53 MPW1PW9,54 M06 (ref. 55) and M06-2X,56 with the 6-31G(d,p) basis set combination. To select a good theoretical technique, the computed maximum absorbed wavelength of the reference chromophore R1 in chloroform with the abovementioned functionals was compared to the experimentally reported data. The maximum values of the reference compound generated employing the aforementioned functionals were 719.082, 674.487, 526.45, 537.799 and 671.965 nm, respectively, whereas the maximum value of ITBCR measured experimentally was 711 nm.19 At the B3LYP/6-31G(d,p) level of DFT, a good agreement with the experimental findings was seen (Fig. 8); therefore, this functional was selected for further investigations. Moreover, to visualize the optoelectronic and photovoltaic properties, various analyses, such as FMO, DOS, TDM, binding energy, and open-circuit voltage analysis, were performed for R1 and D2–D9. The internal (λint) and external (λext) reorganization energies are the two fundamental types of reorganization energy. The first one, λint, is based on internal structural modification, whereas λext deals with the influence of polarization in the external environment.57 In this report, factors related to external environmental changes were not considered and our only focus was on λint.25 The energies for hole (λh) and electron (λe) rearrangement were calculated using the equations below.58| | |
λe = [E0− − E−] + [E0− − E0]
| (3) |
| | |
λh = [E0+ − E+] + [E0+ − E0]
| (4) |
where E0+ and E0− represent the neutral compound's capabilities as a result of the optimized cation and anion geometries; E− and E+ indicate the energies of anions and cations, respectively; E0− and E0+ represent the cations and anions exhibiting different single point energies (SPEs); and E0 is the neutral molecule of SPE.59
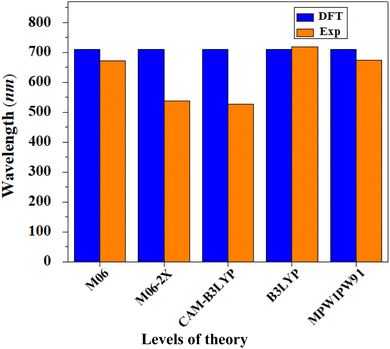 |
| | Fig. 8 Comparison between the theoretical and experimental UV-visible results of R1 in chloroform at various levels with 6-31G(d,p). | |
Conflicts of interest
No conflicts to declare.
Acknowledgements
The authors are grateful to the cooperation and collaboration of A. A. C. B. from IQ-USP Brazil, especially for his continuous support and providing computational lab facilities. Dr Muhammad Khalid gratefully acknowledges the financial support of HEC Pakistan (project no. 20-14703/NRPU/R&D/HEC/2021). M. A. A. appreciates the support of the Research Center for Advanced Materials Science (RCAMS) at King Khalid University Abha, Saudi Arabia, through grant KKU/RCAMS/G015/21.
References
- Y. Lin, J. Wang, Z.-G. Zhang, H. Bai, Y. Li, D. Zhu and X. Zhan, Adv. Mater., 2015, 27, 1170–1174 CrossRef CAS PubMed.
- H. Yao, Y. Cui, D. Qian, C. S. Ponseca, A. Honarfar, Y. Xu, J. Xin, Z. Chen, L. Hong, B. Gao, R. Yu, Y. Zu, W. Ma, P. Chabera, T. Pullerits, A. Yartsev, F. Gao and J. Hou, J. Am. Chem. Soc., 2019, 141, 7743–7750 CrossRef CAS PubMed.
- Z. Liu, L. Krückemeier, B. Krogmeier, B. Klingebiel, J. A. Márquez, S. Levcenko, S. Öz, S. Mathur, U. Rau, T. Unold and T. Kirchartz, ACS Energy Lett., 2019, 4, 110–117 CrossRef CAS.
- M. U. Khan, M. Khalid, R. Hussain, A. Umar, M. Y. Mehboob, Z. Shafiq, M. Imran and A. Irfan, Energy Fuels, 2021, 35, 12436–12450 CrossRef CAS.
- Y. Cui, Y. Wang, J. Bergqvist, H. Yao, Y. Xu, B. Gao, C. Yang, S. Zhang, O. Inganäs, F. Gao and J. Hou, Nat. Energy, 2019, 4, 768–775 CrossRef CAS.
- M. Adnan, J. Iqbal, S. BiBi, R. Hussain, M. N. Akhtar, M. A. Rashid, B. Eliasson and K. Ayub, Z. Phys. Chem., 2017, 231, 1127–1139 CrossRef CAS.
- M. A. Green, Prog. Photovoltaics, 2009, 17, 183–189 CAS.
- O. Vigil-Galán, M. Courel, J. A. Andrade-Arvizu, Y. Sánchez, M. Espíndola-Rodríguez, E. Saucedo, D. Seuret-Jiménez and M. Titsworth, J. Mater. Sci.: Mater. Electron., 2015, 26, 5562–5573 CrossRef.
- K. Kakiage, Y. Aoyama, T. Yano, K. Oya, J. Fujisawa and M. Hanaya, Chem. Commun., 2015, 51, 15894–15897 RSC.
- Z. Han, L. Ren, Z. Cui, C. Chen, H. Pan and J. Chen, Appl. Catal., B, 2012, 126, 298–305 CrossRef CAS.
- C. J. Kettle, D. F. R. P. Burslem and J. Ghazoul, Science, 2011, 333, 36 CrossRef PubMed.
- R. Singh and V. K. Shukla, Sol. Energy, 2019, 178, 90–97 CrossRef CAS.
- Y. He and Y. Li, Phys. Chem. Chem. Phys., 2011, 13, 1970–1983 RSC.
- J. Zhao, Y. Li, H. Lin, Y. Liu, K. Jiang, C. Mu, T. Ma, J. Y. Lin Lai, H. Hu, D. Yu and H. Yan, Energy Environ. Sci., 2015, 8, 520–525 RSC.
- C. Yan, S. Barlow, Z. Wang, H. Yan, A. K.-Y. Jen, S. R. Marder and X. Zhan, Nat. Rev. Mater., 2018, 3, 18003 CrossRef CAS.
- Z. Liu and X. C. Wang, J. Cleaner Prod., 2013, 42, 96–102 CrossRef.
- M. Deng, X. Xu, L. Yu, R. Li and Q. Peng, Dyes Pigm., 2020, 180, 108452 CrossRef CAS.
- H. Huang, Q. Guo, S. Feng, C. Zhang, Z. Bi, W. Xue, J. Yang, J. Song, C. Li, X. Xu, Z. Tang, W. Ma and Z. Bo, Nat. Commun., 2019, 10, 3038 CrossRef PubMed.
- M. S. Ahmad, M. Khalid, M. A. Shaheen, M. N. Tahir, M. U. Khan, A. A. C. Braga and H. A. Shad, J. Phys. Chem. Solids, 2018, 115, 265–276 CrossRef CAS.
- R. Hussain, M. Saeed, M. Y. Mehboob, S. U. Khan, M. Usman Khan, M. Adnan, M. Ahmed, J. Iqbal and K. Ayub, RSC Adv., 2020, 10, 20595–20607 RSC.
- M. R. S. A. Janjua, M. U. Khan, B. Bashir, M. A. Iqbal, Y. Song, S. A. R. Naqvi and Z. A. Khan, Comput. Theor. Chem., 2012, 994, 34–40 CrossRef CAS.
- M. R. S. A. Janjua, M. Amin, M. Ali, B. Bashir, M. U. Khan, M. A. Iqbal, W. Guan, L. Yan and Z. Su, Eur. J. Inorg. Chem., 2012, 2012, 705–711 CrossRef CAS.
- M. Khalid, I. Shafiq, M. Zhu, M. U. Khan, Z. Shafiq, J. Iqbal, M. M. Alam, A. A. C. Braga and M. Imran, J. Saudi Chem. Soc., 2021, 25, 101305 CrossRef CAS.
- M. U. Khan, M. Khalid, M. N. Arshad, M. N. Khan, M. Usman, A. Ali and B. Saifullah, ACS Omega, 2020, 5, 23039–23052 CrossRef CAS PubMed.
- R. Hussain, F. Hassan, M. U. Khan, M. Y. Mehboob, R. Fatima, M. Khalid, K. Mahmood, C. J. Tariq and M. N. Akhtar, Opt. Quantum Electron., 2020, 52, 364 CrossRef CAS.
- M. U. Khan, M. Khalid, M. Ibrahim, A. A. C. Braga, M. Safdar, A. A. Al-Saadi and M. R. S. A. Janjua, J. Phys. Chem. C, 2018, 122, 4009–4018 CrossRef CAS.
- M. Khalid, M. A. Ullah, M. Adeel, M. Usman Khan, M. N. Tahir and A. A. C. Braga, J. Saudi Chem. Soc., 2019, 23, 546–560 CrossRef CAS.
- A. Mahmood, A. Tang, X. Wang and E. Zhou, Phys. Chem. Chem. Phys., 2019, 21, 2128–2139 RSC.
- F. Jilani, J. Iqbal, I. Shahid, M. Yaseen, M. Shabir Mahr, M. Khalid and K. Ayub, Comput. Theor. Chem., 2020, 1187, 112916 CrossRef CAS.
- M. Ans, J. Iqbal, B. Eliasson, M. J. saif and K. Ayub, Comput. Mater. Sci., 2019, 159, 150–159 CrossRef CAS.
- R. Hussain, F. Hassan, M. U. Khan, M. Y. Mehboob, R. Fatima, M. Khalid, K. Mahmood, C. J. Tariq and M. N. Akhtar, Opt. Quantum Electron., 2020, 52, 364 CrossRef CAS.
- M. N. Arshad, M. Khalid, G. Shabbir, M. Asad, A. M. Asiri, M. M. Alotaibi, A. A. C. Braga and A. Khan, RSC Adv., 2022, 12, 4209–4223 RSC.
- M. Khalid, M. N. Arshad, S. Murtaza, I. Shafiq, M. Haroon, A. M. Asiri, S. Figueirêdo de AlcântaraMorais and A. A. C. Braga, RSC Adv., 2022, 12, 13412–13427 RSC.
- M. Khalid, M. U. Khan, E. Razia, Z. Shafiq, M. M. Alam, M. Imran and M. S. Akram, Sci. Rep., 2021, 11, 19931 CrossRef CAS PubMed.
- S. Hussain, S. A. S. Chatha, A. I. Hussain, R. Hussain, M. Y. Mehboob, S. Muhammad, Z. Ahmad and K. Ayub, J. Chem., 2020, 2020, 1–12 Search PubMed.
- S. Hussain, R. Hussain, M. Y. Mehboob, S. A. S. Chatha, A. I. Hussain, A. Umar, M. U. Khan, M. Ahmed, M. Adnan and K. Ayub, ACS Omega, 2020, 5, 7641–7650 CrossRef CAS PubMed.
- M. U. Khan, M. Y. Mehboob, R. Hussain, Z. Afzal, M. Khalid and M. Adnan, Int. J. Quantum Chem., 2020, 120, e26377, DOI:10.1002/qua.26377.
- S. H. Gu, V. Nicolas, A. Lalis, N. Sathirapongsasuti and R. Yanagihara, Infect., Genet. Evol., 2013, 20, 118–123 CrossRef CAS PubMed.
- M. Irfan, J. Iqbal, S. Sadaf, B. Eliasson, U. A. Rana, S. Ud-din Khan and K. Ayub, Int. J. Quantum Chem., 2017, 117, e25363 CrossRef.
- M. Ans, K. Ayub, S. Muhammad and J. Iqbal, Comput. Theor. Chem., 2019, 1161, 26–38 CrossRef CAS.
- S. Tang and J. Zhang, J. Comput. Chem., 2012, 33, 1353–1363 CrossRef CAS PubMed.
- M. U. Khan, R. Hussain, M. Y. Mehboob, M. Khalid, M. A. Ehsan, A. Rehman and M. R. S. A. Janjua, Spectrochim. Acta, Part A, 2021, 245, 118938 CrossRef CAS PubMed.
- M. C. Scharber, D. Mühlbacher, M. Koppe, P. Denk, C. Waldauf, A. J. Heeger and C. J. Brabec, Adv. Mater., 2006, 18, 789–794 CrossRef CAS.
- Z. Zheng, H. Yao, L. Ye, Y. Xu, S. Zhang and J. Hou, Mater. Today, 2020, 35, 115–130 CrossRef CAS.
- A. Mahmood, S. U.-D. Khan and U. A. Rana, J. Comput. Electron., 2014, 13, 1033–1041 CrossRef CAS.
- M. Ans, J. Iqbal, Z. Ahmad, S. Muhammad, R. Hussain, B. Eliasson and K. Ayub, ChemistrySelect, 2018, 3, 12797–12804 CrossRef CAS.
- M. E. Köse, J. Phys. Chem. A, 2012, 116, 12503–12509 CrossRef PubMed.
- A. Dkhissi, Synth. Met., 2011, 161, 1441–1443 CrossRef CAS.
- Q. ul Ain, R. A. Shehzad, U. Yaqoob, A. Sharif, Z. Sajid, S. Rafiq, S. Iqbal, M. Khalid and J. Iqbal, Comput. Theor. Chem., 2021, 1200, 113238 CrossRef CAS.
-
(a) M. J. Frisch, F. R. Clemente, G. Scalmani, V. Barone, B. Mennucci, G. A. Petersson, H. Nakatsuji, M. Caricato, X. Li, H. P. Hratchian, A. F. Izmaylov, J. Bloino and G. Zhe, 2009, pp. 20–44;
(b) M. Frisch, G. Trucks, H. Schlegel, G. Scuseria, M. Robb, J. Cheeseman, G. Scalmani, V. Barone, B. Mennucci and G. Petersson, Gaussian Inc., Wallingford, CT, 2009, vol. 27, p. 34.51.
- C. B. Martin, C. Vandehoef and A. Cook, J. Chem. Educ., 2015, 92, 1364–1368 CrossRef CAS.
- B. Civalleri, C. M. Zicovich-Wilson, L. Valenzano and P. Ugliengo, CrystEngComm, 2008, 10, 405–410 RSC.
- T. Yanai, D. P. Tew and N. C. Handy, Chem. Phys. Lett., 2004, 393, 51–57 CrossRef CAS.
- C. Adamo and V. Barone, J. Chem. Phys., 1998, 108, 664–675 CrossRef CAS.
- V. S. Bryantsev, M. S. Diallo, A. C. T. van Duin and W. A. Goddard, J. Chem. Theory Comput., 2009, 5, 1016–1026 CrossRef CAS PubMed.
- Y. Zhao and D. G. Truhlar, Theor. Chem. Acc., 2008, 120, 215–241 Search PubMed.
- M. U. Khan, J. Iqbal, M. Khalid, R. Hussain, A. A. C. Braga, M. Hussain and S. Muhammad, RSC Adv., 2019, 9, 26402–26418 RSC.
- M. N. Arshad, I. Shafiq, M. Khalid and M. A. Asiri, ACS Omega, 2021, 7, 11606–11617 CrossRef PubMed.
- M. U. Khan, M. Y. Mehboob, R. Hussain, R. Fatima, M. S. Tahir, M. Khalid and A. A. C. Braga, J. Phys. Org. Chem., 2021, 34, e4119 CAS.
Footnote |
| † Electronic supplementary information (ESI) available: 2D structures with their IUCAP names, Cartesian co-ordinates and UV-vis data (wave lengths, excitation energies and oscillator strengths) were calculated using B3LYP/6-31G (d,p) for the studied compounds and are represented in the ESI data file. See DOI: https://doi.org/10.1039/d2ra04473k |
|
| This journal is © The Royal Society of Chemistry 2022 |
Click here to see how this site uses Cookies. View our privacy policy here.  Open Access Article
 *ab,
Wajeeha Anwerab,
Muhammad Adeelc,
Zahid Shafiq
 d,
Ataualpa A. C. Braga
 e,
Mohammed A. Assirifg,
Muhammad Imran
 fg and
Aman Ullah*h


