DOI:
10.1039/D2RA03177A
(Paper)
RSC Adv., 2022,
12, 19209-19224
Modification of silica nanoparticles by 2,4-dihydroxybenzaldehyde and 5-bromosalicylaldehyde as new nanocomposites for efficient removal and preconcentration of Cu(II) and Cd(II) ions from water, blood, and fish muscles
Received
19th May 2022
, Accepted 24th June 2022
First published on 1st July 2022
Abstract
Herein, silica nanoparticles were modified by 2,4-dihydroxybenzaldehyde and 5-bromosalicylaldehyde to produce new nanocomposites which were abbreviated as N1 and N2, respectively. The synthesized nanocomposites were used for efficient removal and preconcentration of Cu(II) and Cd(II) ions from water, blood, and fish muscles. FE-SEM, FT-IR, XRD, CHN elemental analysis, and nitrogen gas sorption analyzer were used to characterize the new nanocomposites. The XRD proved that the synthesized oxide is cristobalite with an average crystallite size of 54.80 nm. Due to the formation of the C![[double bond, length as m-dash]](https://www.rsc.org/images/entities/char_e001.gif) N group, the intensity of the XRD peak at 2θ = 21.9° in the N1 and N2 nanocomposites decreased significantly. The FT-IR bands, which appeared at 1603 and 1629 cm−1 in the N1 and N2 nanocomposites, are attributable to the bending vibration of C
N group, the intensity of the XRD peak at 2θ = 21.9° in the N1 and N2 nanocomposites decreased significantly. The FT-IR bands, which appeared at 1603 and 1629 cm−1 in the N1 and N2 nanocomposites, are attributable to the bending vibration of C![[double bond, length as m-dash]](https://www.rsc.org/images/entities/char_e001.gif) N and/or OH, respectively. Also, the FE-SEM analysis shows the morphology of the silica nanoparticles which were identified as spherical and rod-like with slight agglomeration while the N1 and N2 nanocomposites have flaky surfaces due to the formation of C
N and/or OH, respectively. Also, the FE-SEM analysis shows the morphology of the silica nanoparticles which were identified as spherical and rod-like with slight agglomeration while the N1 and N2 nanocomposites have flaky surfaces due to the formation of C![[double bond, length as m-dash]](https://www.rsc.org/images/entities/char_e001.gif) N groups. The maximum Cu(II) ion adsorption capacities of the N1 and N2 nanocomposites are 64.81 and 40.93 mg g−1, respectively. The maximum Cd(II) ion adsorption capacities of the N1 and N2 nanocomposites are 27.39 and 26.34 mg g−1, respectively. The adsorption of Cu(II) or Cd(II) ions using the synthesized nanocomposites is spontaneous, chemical, exothermic, and well-matched with the Langmuir equilibrium isotherm. The recovery findings demonstrate that the preconcentration process is accurate, adaptable, and resulted in quantitative separation because % Recovery is more than 95%. Furthermore, the % RSD was less than 3.5%, indicating good reproducibility.
N groups. The maximum Cu(II) ion adsorption capacities of the N1 and N2 nanocomposites are 64.81 and 40.93 mg g−1, respectively. The maximum Cd(II) ion adsorption capacities of the N1 and N2 nanocomposites are 27.39 and 26.34 mg g−1, respectively. The adsorption of Cu(II) or Cd(II) ions using the synthesized nanocomposites is spontaneous, chemical, exothermic, and well-matched with the Langmuir equilibrium isotherm. The recovery findings demonstrate that the preconcentration process is accurate, adaptable, and resulted in quantitative separation because % Recovery is more than 95%. Furthermore, the % RSD was less than 3.5%, indicating good reproducibility.
1. Introduction
The release of toxic metals, which are produced from different industries, into the environment causes global concern due to its harmful effect on aquatic organisms, humans, soil, and plants.1–3 Cadmium and its compounds are highly toxic where exposure to them causes cancer and damages the cardiovascular system, digestion, breathing, reproductive system, kidneys, and nerves.4–6 Excess amounts of copper may cause liver and brain poisoning, diarrhea, skin rashes, anemia caused by red cell breakage, high blood pressure, heart disease, premenstrual syndrome, nausea, stomach pain, and severe damage to the central nervous system. Excess amounts of copper also accompany psychological and mental illnesses such as autism, behavior problems, hyperactivity in children, depression in adults, dementia, and stuttering.7–9 Pollution with heavy metals such as copper and cadmium is the most dangerous type of pollution as a result of their accumulation in the organs of fish or plants. Hence, human consumption of large quantities of fish or plants, that contain high concentrations of heavy metals, leads to human poisoning.10–12 Maximum allowed concentrations of Cd(II) and Cu(II) in water as recommended by the World Health Organization (WHO) are 3 and 2 μg L−1, respectively.13,14 Until now, heavy metals have been removed and determined using many methods such as precipitation, evaporation, electrochemical, and membrane separation.15–18 Unfortunately, these methods display several disadvantages involving low efficiency, high cost, and secondary damage to the water environment.19 Consequently, it is essential to find an economical and environmentally friendly method for removing and preconcentrating heavy metals from water. The adsorption method is familiar as an efficient and simple method for removing and preconcentrating heavy metals from water.20–26 The adsorption mechanism is typically dependent on the chemical or physical interaction between the adsorbate and the surface of the adsorbent involving complexation reaction, surface adsorption, cation exchange, and electrostatic attraction.27 Bandara et al. used biochar adsorbent, which was derived from agricultural wastes, to remove Cd(II) and Cu(II) ions from aqueous media. They found that the adsorption capacity of this adsorbent towards Cd(II) and Cu(II) ions is 6.28 and 18 mg g−1, respectively.28 Joseph et al. used FAU-type zeolite adsorbent, which was derived from coal fly ash, to remove Cd(II) and Cu(II) ions from aqueous media. They found that the adsorption capacity of this adsorbent towards Cd(II) and Cu(II) ions is 74.074 and 57.803 mg g−1, respectively.29 Ali et al. used thio-functionalized layered double hydroxide (Mn–MoS4) adsorbent to remove Cd(II) and Cu(II) ions from aqueous media. They found that the adsorption capacity of this adsorbent towards Cd(II) and Cu(II) ions is 93.11 and 58.07 mg g−1, respectively.30 Hua et al. used Sulfhydryl functionalized hydrogel adsorbent to remove Cd(II) and Cu(II) ions from aqueous media. They found that the adsorption capacity of this adsorbent towards Cd(II) and Cu(II) ions is 27.40 and 15.60 mg g−1, respectively.31 Khalifa et al. developed a new adsorbent composed of silica nanoparticles enhanced with dibenzoylmethane to remove Cd(II) and Cu(II) ions from aqueous solutions. The adsorption capacity of this adsorbent for Cd(II) and Cu(II) ions was determined to be 35.37 and 31.76 mg g−1, respectively.32 Consequently, our research team aims to synthesizes new inorganic/organic nanocomposites via a simple procedure for efficient removal and preconcentration of Cd(II) and Cu(II) ions from water, blood, and fish muscles. The silica modified with (3-aminopropyl) triethoxysilane reacted with 2,4-dihydroxybenzaldehyde and 5-bromosalicylaldehyde to produce new inorganic/organic nanocomposites. In these nanocomposites, the inorganic support carries the organic molecules which form chelates with metal ions and thus facilitate their removal. The concentration of metal ions is often determined using atomic spectroscopic equipment such as flame atomic absorption spectrometry, graphite furnace atomic absorption spectrometry, and inductively coupled plasma optical emission spectrometry. Nevertheless, a preconcentration procedure is typically required before instrumental measurement in order to eliminate any predicted matrix influences and increase the instrument's sensitivity by reducing the detection limit. Several separating and preconcentration techniques, such as ionic liquid extraction, cloud point extraction, electrochemical deposition, ion exchange, coprecipitation, and solid phase extraction, are employed to achieve this objective. Owing to its simplicity, selectivity, and versatility, solid phase extraction is generally favored over alternative methods.33 Before analyzing real samples with flame atomic absorption spectrometry, Cu(II) and Cd(II) ions were preconcentrated using the synthesized nanocomposites. Consequently, this research presents new and innovative environmental effects.
2. Experimental
2.1. Chemicals
Sodium metasilicate pentahydrate (Na2SiO3·5H2O), nitric acid (HNO3), (3-aminopropyl)triethoxysilane (C9H23NO3Si), ethanol (C2H6O), thiourea (CH4N2S), 2,4-dihydroxybenzaldehyde (C7H6O3), 5-bromosalicylaldehyde (C7H5BrO2), xylene (C8H10), hydrochloric acid (HCl), concentrated sulfuric acid (H2SO4), cadmium(II) chloride monohydrate (CdCl2·H2O), potassium chloride (KCl), sodium hydroxide (NaOH), copper(II) chloride dihydrate (CuCl2·2H2O), and ethylenediaminetetraacetic acid disodium salt dihydrate (C10H14N2Na2O8·2H2O) were obtained from Sigma Aldrich Company and consumed without additional refinement (purity = 99.99%).
2.2. Synthesis of 2,4-dihydroxybenzaldehyde/silica and 5-bromosalicylaldehyde/silica nanocomposites
Firstly, the SiO2 nanoparticles were synthesized as the following; 80 g of sodium metasilicate pentahydrate was dissolved in 400 mL of distilled water. After that, pH was set at 9 then the formed gel was stirred for 1 h. Besides, the formed gel was separated and thoroughly washed several times with warm distilled water to get rid of sodium chloride. Moreover, the produced gel was dried at 60 °C for 12 h then ignited at 600 °C for 5 h to obtain SiO2 nanoparticles. Secondly, SiO2 sample was modified with (3-aminopropyl)triethoxysilane according to the method described by Khalifa et al.32 as the following; 2 g of SiO2 sample was refluxed at 150 °C with 2.20 mL of (3-aminopropyl)triethoxysilane in 60 mL of xylene for 24 h. Besides, the modified silica was separated and thoroughly washed repeatedly with warm ethanol and water then dried at 60 °C for 12 h. Lastly, 2 g of the SiO2 sample, which was modified with (3-aminopropyl)triethoxysilane, was refluxed at 150 °C for 24 h with 30 mL ethanolic solution containing 2 g of 2,4-dihydroxybenzaldehyde or 5-bromosalicylaldehyde accompanied by a few droplets of sulfuric acid. Then, the formed nanocomposites were separated and thoroughly washed repeatedly with warm ethanol and water then dried at 60 °C for 12 h. The nanocomposites, which were synthesized using 2,4-dihydroxybenzaldehyde and 5-bromosalicylaldehyde, were abbreviated as N1 and N2, respectively.
2.3. Instrumentation
The X-ray diffraction (XRD) patterns of the SiO2, 2,4-dihydroxybenzaldehyde/silica, and 5-bromosalicylaldehyde/silica samples were obtained utilizing an X-ray diffractometer (D8 Advance, Bruker, Billerica, Massachusetts, United States) equipped with Kα copper radiations with a wavelength of 0.15 nm. Also, the Fourier transform (FT-IR) spectra of the SiO2, 2,4-dihydroxybenzaldehyde/silica, and 5-bromosalicylaldehyde/silica samples, were obtained utilizing Fourier transform infrared spectrophotometer (Nicolet, Waltham, Massachusetts, United States). The morphologies of the SiO2, 2,4-dihydroxybenzaldehyde/silica, and 5-bromosalicylaldehyde/silica samples were examined utilizing scanning electron microscopy (SEM, JEOL, SEM-JSM-5410LV, Akishima, Tokyo, Japan). BET surface area, average pore radius, and total pore volume of the SiO2, 2,4-dihydroxybenzaldehyde/silica, and 5-bromosalicylaldehyde/silica samples were determined utilizing a nitrogen gas sorption analyzer (Quantachrome, NOVA, Boynton Beach, United States). CHN analyses of the 2,4-dihydroxybenzaldehyde/silica and 5-bromosalicylaldehyde/silica nanocomposites were determined utilizing CHN Elemental Analyzer (PerkinElmer, 2400, Waltham, United States).
2.4. Removal of Cu(II) and Cd(II) ions from aqueous media
For studying the effect of pH, the pH values of 75 mL of 200 mg L−1 of Cu(II) or Cd(II) solutions were adapted to different values (from 4 to 6 in the case of Cu(II) ions or from 4 to7 in the case of Cd(II) ions) before the addition of nanocomposites using 0.1 M HCl or NaOH. After that, 0.15 g of the N1 or N2 nanocomposites is added to each Cu(II) or Cd(II) solution then the mixture was stirred for 180 min.
For studying the effect of time, the pH values of 75 mL of 200 mg L−1 of Cu(II) or Cd(II) solutions were adapted to 6 in the case of Cu(II) ions or 7 in the case of Cd(II) ions before the addition of nanocomposites. After that, 0.15 g of the N1 or N2 nanocomposites is added to each Cu(II) or Cd(II) solution then the mixture was stirred for different times (10–180 min).
For studying the effect of temperature, the pH values of 75 mL of 200 mg L−1 of Cu(II) or Cd(II) solutions were adapted to 6 in the case of Cu(II) ions or 7 in the case of Cd(II) ions before the addition of nanocomposites. After that, 0.15 g of the N1 or N2 nanocomposites is added to each Cu(II) or Cd(II) solution. The mixture was then stirred for 120 min at different temperatures (298–328 kelvins).
For studying the effect of concentration, the pH values of 75 mL of 50–200 mg L−1 of Cu(II) or Cd(II) solutions were adapted to 6 in the case of Cu(II) ions or 7 in the case of Cd(II) ions before the addition of nanocomposites. After that, 0.15 g of the N1 or N2 nanocomposites is added to each Cu(II) or Cd(II) solution. The mixture was then stirred for 120 min at 298 kelvins.
After completing the study of each of the previous effects, the N1 or N2 nanocomposites are separated using centrifugation. After that, the remaining concentrations of Cu(II) or Cd(II) ions in the filtrate are estimated using atomic absorption spectrophotometer.
The quantity of the adsorbed Cu(II) or Cd(II) ions per gram of the N1 or N2 nanocomposites (Q, mg g−1) was calculated using eqn (1).
| |
 | (1) |
The % removal (% R) of the Cu(II) or Cd(II) ions using the N1 or N2 nanocomposites was calculated using eqn (2).
| |
 | (2) |
where,
Mi (mg L
−1) represents the initial concentration of Cu(
II) or Cd(
II) ions while
Me (mg L
−1) represents their equilibrium concentration in the filtrate. Besides,
V (L) is the volume of Cu(
II) or Cd(
II) solution whereas
W (g) is the quantity of the nanocomposites.
For studying the effect of desorption, 0.15 g of the N1 or N2 nanocomposites was stirred with 75 mL of 5 mg L−1 of Cu(II) or Cd(II) solution (pH = 6 in the case of Cu(II) ions or 7 in the case of Cd(II) ions) for 120 min. Besides, the N1 or N2 nanocomposites were separated using centrifugation then thoroughly washed repeatedly with distilled water to remove the non-adsorbed Cu(II) or Cd(II) ions. Also, the loaded nanocomposites with Cu(II) or Cd(II) ions were then stirred for 15 min with 5.00 mL of 0.50 M of different eluents (HCl, HNO3, thiourea, and EDTA disodium salt). Moreover, for studying the reusability (three cycles of adsorption/desorption process), 0.15 g of the regenerated N1 or N2 nanocomposites was stirred for 120 min with 75 mL of 5 mg L−1 of Cu(II) or Cd(II) solution (pH = 6 in the case of Cu(II) ions or 7 in the case of Cd(II) ions). 0.5 M of EDTA disodium salt is used to regenerate the N1 or N2 nanocomposites after each cycle.
The % desorption (% D) using different eluents was calculated using eqn (3).
| |
 | (3) |
where,
Md (mg L
−1) is the concentration of Cu(
II) or Cd(
II) ions in the eluent whereas
Vd (L) is the volume of the eluent.
The point of zero charge (pHPZC) of the N1 or N2 nanocomposites was determined as revealed by Khalifa et al.32 as the following; the pH values of 0.01 M of KCl solutions were adapted to different values (pHinitial = 2–12) before the addition of the N1 or N2 nanocomposites using 0.1 M HCl or NaOH. After that, 0.15 g of the N1 or N2 nanocomposites was added to each KCl solution then the mixture was stirred for 6 h. After that, the N1 or N2 nanocomposites were separated using centrifugation. Then, the final pH values (pHfinal) of the filtrates were determined. pHfinal values were plotted against pHinitial values. The pHpzc is the pHfinal level where a characteristic plateau was gotten.32
2.5. Preconcentration of real samples
Sea water (from Ras Elbar-Mediterranean Sea-Egypt) and tap water (from Benha City-Egypt) samples were collected and filtered using filter paper to remove any solid suspensions. After that, the samples were kept in containers made of polypropylene pre-washed with 10% nitric acid. The blood sample was placed in tubes containing K2EDTA to prevent blood coagulation. The tilapia fish was purchased from a market in Benha City, Egypt. Then, the skin of the fish was removed, its muscles dried at 100 °C and it was stored in bags made of polyethylene. To accomplish a fast process, the previous real samples were digested utilizing a microwave-assisted acid digestion method. Using teflon digesting tubes, 0.6 g of dry sample was mixed with 2.5 mL of 30% hydrogen peroxide and 5 mL of nitric acid. After 10 min at room temperature, the tubes were sealed then heated according to the following one-step technique (power: 1650 W; temperature: 200 °C; ramp time: 12 min; cooling time: 12 min; hold time: 12 min). After cooling the tubes to room temperature, nearly all of the solutions were evaporated and then diluted to 75 mL with distilled water. In a conical flask, 75 mL of digested solution or water sample was combined with 0.15 g of the N1 or N2 nanocomposite. The pH of the solution was adapted to 6 in the case of Cu(II) ions or 7 in the case of Cd(II) ions. Then, the contents were stirred for 120 min then the N1 or N2 nanocomposite was separated, dried, and transferred into a 25 mL beaker. After adding 5 mL of 0.5 M EDTA disodium salt, the mixture was stirred for 15 min to allow the studied metal ions to desorb. The filtrate was then analyzed for determining the concentration of studied metal ions using an atomic absorption spectrometer.
3. Results and discussion
3.1. Characterization of 2,4-dihydroxybenzaldehyde/silica and 5-bromosalicylaldehyde/silica nanocomposites
Fig. 1A–C represents the X-ray diffraction patterns of the SiO2, N1, and N2 samples, respectively. The diffraction peaks showed that the formed silica nanoparticles and the average crystalline size (54.80 nm) were in good shape and size, which are confirmed by the JCPDS card number 00-039-1425 of cristobalite. Also, the results suggested that the silica nanoparticles had a tetragonal structure.34 Due to the formation of Schiff bases, as depicted in Scheme 1, the strength of the XRD peak at 2θ = 21.9° in the N1 and N2 nanocomposites decreased significantly. The FT-IR spectra of the SiO2, N1, and N2 samples are depicted in Fig. 2A–C, respectively. The bands that appeared in the SiO2, N1, and N2 samples at 468, 474, and 469 cm−1 are due to the bending vibration of O–Si–O, respectively. The bands that appeared in the SiO2, N1, and N2 samples at 620 and 792 cm−1 are due to the symmetrical stretching vibration of Si–O–Si. The bands that appeared in the SiO2, N1, and N2 samples at 1071, 1087, and 1073 cm−1 are due to the asymmetrical stretching vibration of Si–O–Si, respectively. The bands that appeared at 1620 and 3440 cm−1 in the SiO2 sample are due to the bending and stretching vibration of OH, respectively.35 The bands that appeared in the N1 and N2 samples at 1603 and 1629 cm−1, are due to the bending vibration of C![[double bond, length as m-dash]](https://www.rsc.org/images/entities/char_e001.gif) N, respectively. The bands that appeared in the N1 and N2 samples at 3263 and 3260 cm−1 are due to the stretching vibration of OH, respectively. The bands that appeared in the N1 and N2 samples at 2940 and 2941 cm−1 are due to the stretching vibration of aliphatic CH, respectively. The bands that appeared in the N1 and N2 samples at 3003 and 3005 cm−1 are due to the stretching vibration of aromatic CH, respectively. The bands that appeared in the N1 and N2 samples in the range 1436–1506 cm−1 and 1435–1510 cm−1 are due to the stretching vibration of aromatic C
N, respectively. The bands that appeared in the N1 and N2 samples at 3263 and 3260 cm−1 are due to the stretching vibration of OH, respectively. The bands that appeared in the N1 and N2 samples at 2940 and 2941 cm−1 are due to the stretching vibration of aliphatic CH, respectively. The bands that appeared in the N1 and N2 samples at 3003 and 3005 cm−1 are due to the stretching vibration of aromatic CH, respectively. The bands that appeared in the N1 and N2 samples in the range 1436–1506 cm−1 and 1435–1510 cm−1 are due to the stretching vibration of aromatic C![[double bond, length as m-dash]](https://www.rsc.org/images/entities/char_e001.gif) C, respectively. The band that appeared in the N1 and N2 samples at 1374 and 1377 cm−1 are due to the bending vibration of CH, respectively. The bands that appeared in the N1 and N2 samples in the range 845–920 and 918 cm−1 are due to the out-of-plane bending vibration of CH aromatic, respectively.36 The slight displacement in the band positions of silica and the appearance of organic groups in the synthesized composites confirm the successful loading of the aforementioned organic materials on silica.
C, respectively. The band that appeared in the N1 and N2 samples at 1374 and 1377 cm−1 are due to the bending vibration of CH, respectively. The bands that appeared in the N1 and N2 samples in the range 845–920 and 918 cm−1 are due to the out-of-plane bending vibration of CH aromatic, respectively.36 The slight displacement in the band positions of silica and the appearance of organic groups in the synthesized composites confirm the successful loading of the aforementioned organic materials on silica.
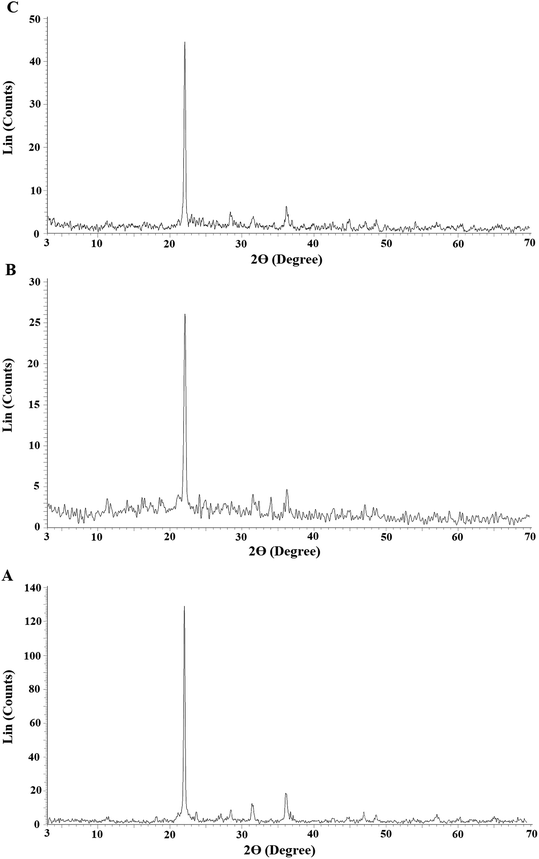 |
| | Fig. 1 The X-ray diffraction patterns of the SiO2 (A), N1 (B), and N2 (C) samples. | |
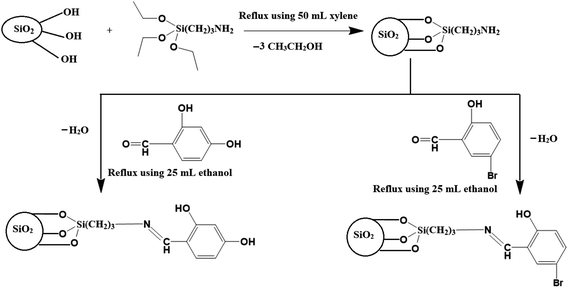 |
| | Scheme 1 The proposed structure of the synthesized nanocomposites. | |
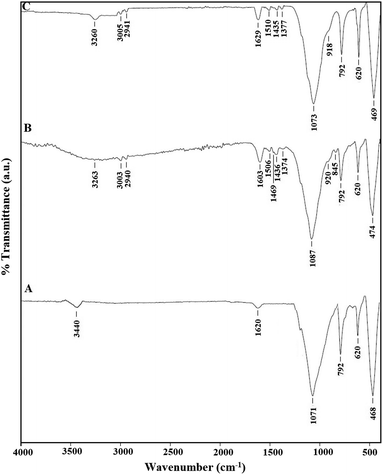 |
| | Fig. 2 The FT-IR spectra of the SiO2 (A), N1 (B), and N2 (C) samples. | |
The percentages of carbon, hydrogen, and nitrogen in the N1 nanocomposite were determined by elemental analysis to be 13.82, 3.50, and 1.53%, respectively. Also, the percentages of carbon, hydrogen, and nitrogen in the N2 nanocomposite were determined by elemental analysis to be 12.67, 3.33, and 1.42%, respectively. Hence, the presence of carbon and nitrogen confirms the successful loading of the organic materials on the silica nanoparticles as revealed in Scheme 1. Also, Fig. 3A–D represents the N2 adsorption/desorption isotherms of SiO2, SiO2/(3-aminopropyl)triethoxysilane, N1, and N2 samples, respectively. The results confirmed that the obtained isotherms belong to type IV.37 Average pore size, BET surface area, and total pore volume were tabulated in Table 1. The total pore volume and BET surface area of the N1 and N2 nanocomposite were reduced because the formed Schiff base molecules block the pores of SiO2. Consequently, this analysis confirms the successful loading of the Schiff bases on the silica nanoparticles as revealed in Scheme 1. Moreover, Fig. 4A–C represents the FE-SEM images of the SiO2, N1, and N2 samples, respectively. Also, the FE-SEM analysis shows the morphology of the silica nanoparticles which identified as spherical and rod with slight agglomeration while the N1 and N2 nanocomposites have flaky surfaces due to the formation of C![[double bond, length as m-dash]](https://www.rsc.org/images/entities/char_e001.gif) N group.
N group.
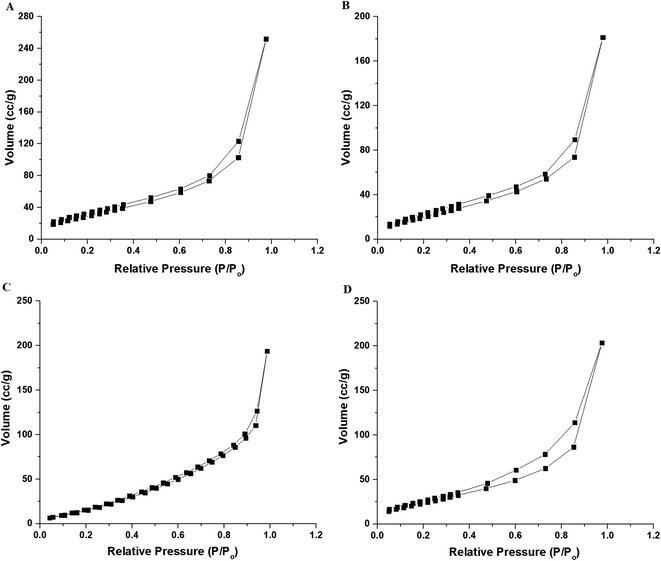 |
| | Fig. 3 The N2 adsorption/desorption isotherms of the SiO2 (A), SiO2/(3-aminopropyl)triethoxysilane (B), N1 (C), and N2 (D) samples. | |
Table 1 Average pore size, BET surface area, and total pore volume of the synthesized samples
| Sample |
BET surface area (m2 g−1) |
Total pore volume (cc g−1) |
Average pore size (nm) |
| SiO2 |
115.260 |
0.391 |
6.777 |
| SiO2/(3−aminopropyl)triethoxysilane |
83.335 |
0.281 |
6.745 |
| N1 |
93.558 |
0.1491 |
3.188 |
| N2 |
96.282 |
0.315 |
6.553 |
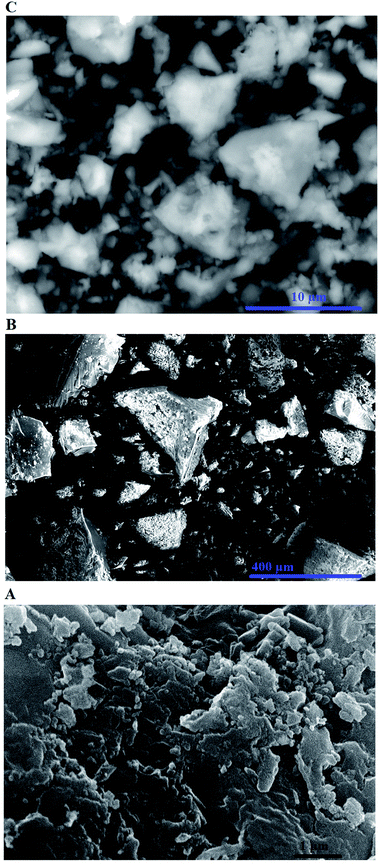 |
| | Fig. 4 The FE-SEM images of the SiO2 (A), N1 (B), and N2 (C) samples. | |
3.2. Analytical factors that influence the removal of Cu(II) and Cd(II) ions from aqueous solutions
3.2.1. Effect of pH. Fig. 5A–B depicts the relationship between % R or Q (mg g−1) and pH for Cu(II) and Cd(II) ions, respectively. In the case of Cu(II) ions, it was found that % R or Q using N1 and N2 nanocomposites increases with the increase in the pH value until it reached 59.60 and 39.20 at pH = 6, respectively. In the case of Cd(II) ions, it was found that % R or Q using N1 and N2 nanocomposites increases with the increase in the pH value until it reached 24.81 and 21.32 at pH = 7, respectively. Fig. 6A–B represents the plot of pHfinal versus pHinitial for several KCl solutions in the case of using N1 and N2 nanocomposites, respectively. Besides, the point of zero charge of the N1 and N2 nanocomposites is 3.27 and 3.20, respectively. If the pH of the Cu(II) or Cd(II) solution is less than point of zero charge of the nanocomposites, the surface of the nanocomposites are surrounded by positive hydrogen ions (H+). Accordingly, % R decreases owing to repulsion between positive hydrogen ions and Cu(II) or Cd(II) ions. On the contrary, if the pH of the Cu(II) or Cd(II) solution is higher than point of the zero charge of the nanocomposites, the surface of the nanocomposites are surrounded by negative hydroxide ions (OH−) which works to ionize the hydroxyl group of the composites easily and hence % R of Cu(II) or Cd(II) ions increases.32
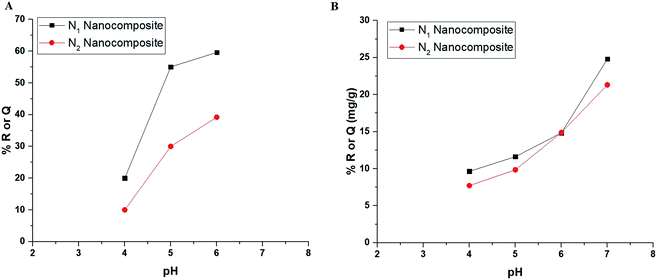 |
| | Fig. 5 The plot of % R or Q (mg g−1) versus pH in the case of Cu(II) (A) and Cd(II) (B) ions. | |
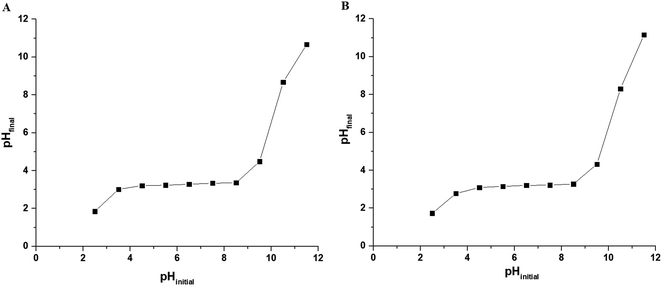 |
| | Fig. 6 The plot of pHfinal versus pHinitial for several KCl solutions in the case of using N1 (A) and N2 (B) nanocomposites. | |
3.2.2. Effect of time. Fig. 7A–B depicts the plot of % R or Q (mg g−1) versus time in the case of Cu(II) and Cd(II) ions, respectively. In the case of Cu(II) ions, it was found that % R or Q using N1 and N2 nanocomposites increases with the increase in the time value until it reached 59.50 and 40.00 after 120 min, respectively. % R or Q was not affected when the time exceeded 120 min as a result of the saturation of the active sites. In the case of Cd(II) ions, it was found that % R or Q using N1 and N2 nanocomposites increases with the increase in the time value until it reached 25 and 22.50 after 120 min, respectively. Due to the saturation of the active sites when the time exceeded 120 min, neither % R nor Q was changed.
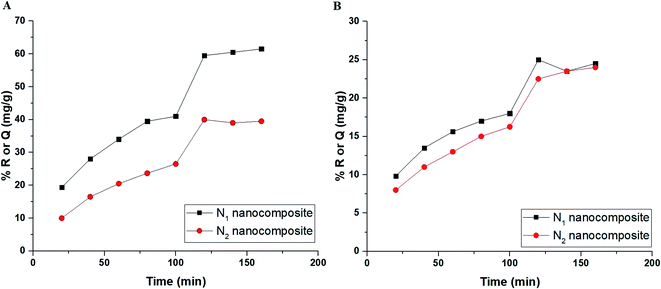 |
| | Fig. 7 The plot of % R or Q (mg g−1) versus time in the case of Cu(II) (A) and Cd(II) (B) ions. | |
Our research group seeks to load organic materials that have not previously been loaded onto nanomaterials to study their effect on separation efficiency via the chelation method. In this regard, the effect of the presence of an electron-withdrawing groups such as Br in the para-position to OH by loading the 5-bromosalicylaldehyde material was studied. In addition, the effect of the presence of an electron-withdrawing group such as OH in the meta-position to OH by loading the 2,4-dihydroxybenzaldehyde material was studied. The presence of the bromine group in the para-position of OH makes the OH ionization relatively slow compared to the presence of the OH group in the meta-position of OH. The formation of chelates between loaded organic materials and studied metal ions is rapid in the case of the fast ionization of OH group and hence 2,4-dihydroxybenzaldehyde is superior to 5-bromosalicylaldehyde in removing the metal ions under study.
3.2.3. Effect of temperature. Fig. 8A–B depicts the plot of % R or Q (mg g−1) versus temperature in the case of Cu(II) and Cd(II) ions, respectively. It was found that % R or Q using N1 and N2 nanocomposites decreases with the increase in the temperature. The optimal temperature, which will be considered for subsequent impacts, is therefore 298 K. The thermodynamic parameters, for example, change in free energy (ΔGo), change in enthalpy (ΔHo), and change in the entropy (ΔSo) were determined using eqn (4) & (5).21–26| |
 | (4) |
where, T (K), KT (L g−1), and R (kJ mol−1 K−1) are the temperature, distribution constant, and gas constant, respectively. The distribution constant (KT) was determined utilizing eqn (6).32| |
 | (6) |
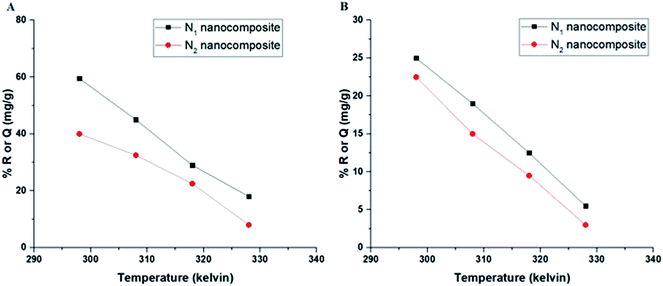 |
| | Fig. 8 The plot of % R or Q (mg g−1) versus temperature in the case of Cu(II) (A) and Cd(II) (B) ions. | |
Fig. 9A–B depicts the relationship between lnKT and T−1 for Cu(II) and Cd(II) ions, respectively. The correlation coefficients (R2) in the case of using N1 and N2 samples for removing Cu(II) ions are 0.992 and 0.860, respectively. The correlation coefficients (R2) in the case of using N1 and N2 samples for removing Cd(II) ions are 0.914 and 0.905, respectively. Hence, this confirms a strong relationship between ln![[thin space (1/6-em)]](https://www.rsc.org/images/entities/char_2009.gif) KT and 1/T. The thermodynamic parameters are listed in Tables 2 and 3. The results clarified that the adsorption of Cu(II) or Cd(II) ions using the N1 and N2 nanocomposites is chemical because the value of ΔHo is more than 40 kJ mol−1.32 Also, the adsorption of Cu(II) or Cd(II) ions using the N1 and N2 nanocomposites is exothermic owing to the negative sign of ΔHo. The N1 and N2 nanocomposites can form chelates with Cu(II) or Cd(II) ions as clarified in Scheme 2. In addition, the spontaneous adsorption of Cu(II) or Cd(II) ions on N1 and N2 nanocomposites is due to the negative sign of ΔGo. Moreover, the disordered adsorption of Cu(II) or Cd(II) ions at the solution boundary/nanocomposite is related to the positive sign of ΔSo.
KT and 1/T. The thermodynamic parameters are listed in Tables 2 and 3. The results clarified that the adsorption of Cu(II) or Cd(II) ions using the N1 and N2 nanocomposites is chemical because the value of ΔHo is more than 40 kJ mol−1.32 Also, the adsorption of Cu(II) or Cd(II) ions using the N1 and N2 nanocomposites is exothermic owing to the negative sign of ΔHo. The N1 and N2 nanocomposites can form chelates with Cu(II) or Cd(II) ions as clarified in Scheme 2. In addition, the spontaneous adsorption of Cu(II) or Cd(II) ions on N1 and N2 nanocomposites is due to the negative sign of ΔGo. Moreover, the disordered adsorption of Cu(II) or Cd(II) ions at the solution boundary/nanocomposite is related to the positive sign of ΔSo.
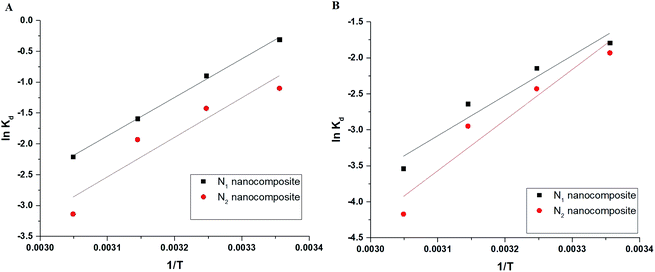 |
| | Fig. 9 The plot of lnKT versus T−1 in the case of Cu(II) (A) and Cd(II) (B). | |
Table 2 Thermodynamic parameters in the case of Cu(II) ions
| Sample |
ΔGo (KJ mol−1) |
ΔSo (KJ mol−1K−1) |
ΔHo (KJ mol−1) |
| Temperature (Kelvin) |
| 298 |
308 |
318 |
328 |
| N1 |
−105.129 |
−106.905 |
−108.679 |
−110.455 |
0.178 |
−52.227 |
| N2 |
−109.376 |
−111.249 |
−113.121 |
−114.993 |
0.187 |
−53.576 |
Table 3 Thermodynamic parameters in the case of Cd(II) ions
| Sample |
ΔGo (KJ mol−1) |
ΔSo (KJ mol−1K−1) |
ΔHo (KJ mol−1) |
| Temperature (Kelvin) |
| 298 |
308 |
318 |
328 |
| N1 |
−97.169 |
−98.869 |
−100.569 |
−102.268 |
0.169 |
−46.523 |
| N2 |
−121.862 |
−123.980 |
−126.099 |
−128.218 |
0.212 |
−58.729 |
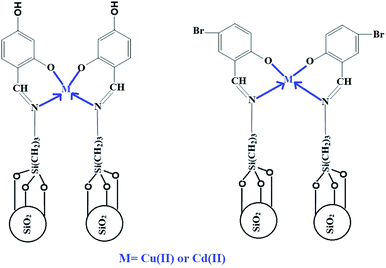 |
| | Scheme 2 The proposed mechanism for the adsorption of Cu(II) and Cd(II) ions. | |
3.2.4. Effect of concentration. Fig. 10A–B depicts the plot of the initial concentration of Cu(II) ions versus % R and Q, respectively. Besides, Fig. 11A–B depicts the plot of the initial concentration of Cd(II) ions versus % R and Q, respectively. It was found that % R decreases whereas Q increases with the increase in the initial concentration of Cu(II) or Cd(II) ions.21–26 The concentration-related results were studied by two equilibrium isotherms, namely: Langmuir (eqn (7)) and Freundlich (eqn (8)).21–26| |
 | (7) |
| |
 | (8) |
where, Qm (mg g−1) is the maximum adsorption capacity of the N1 and N2 nanocomposites. P4 (L mg−1) and P5 (mg g−1) (L mg−1)1/L) refer to the Langmuir and Freundlich constants, respectively. L−1 refers to the heterogeneity constant. eqn (9) can be used to get the Qm from the Freundlich isotherm.21–26
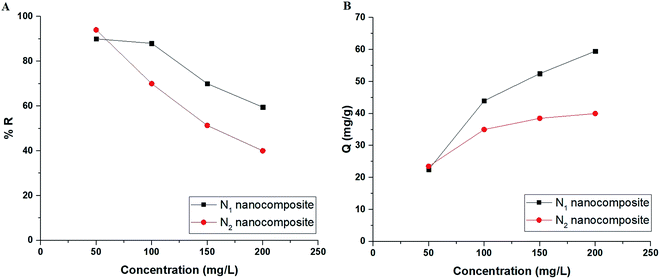 |
| | Fig. 10 The plot of initial concentration of Cu(II) ions versus % R (A) and Q (B). | |
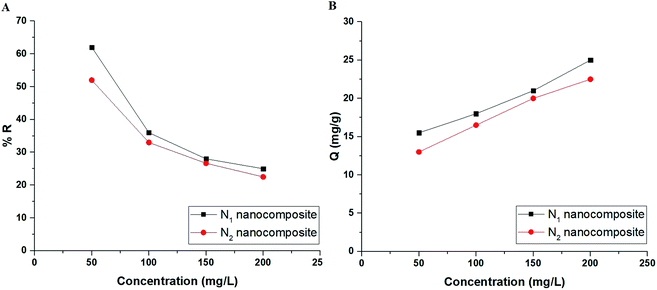 |
| | Fig. 11 The plot of initial concentration of Cd(II) ions versus % R (A) and Q (B). | |
Fig. 12A–B represents the Langmuir (the plot of Me/Qe versus Me) and Freundlich (The plot of ln![[thin space (1/6-em)]](https://www.rsc.org/images/entities/char_2009.gif) Qe versus ln
Qe versus ln![[thin space (1/6-em)]](https://www.rsc.org/images/entities/char_2009.gif) Me) isotherms in the case of Cu(II) ions, respectively. Also, Fig. 13A–B represents the Langmuir (the plot of Me/Qe versus Me) and Freundlich (the plot of ln
Me) isotherms in the case of Cu(II) ions, respectively. Also, Fig. 13A–B represents the Langmuir (the plot of Me/Qe versus Me) and Freundlich (the plot of ln![[thin space (1/6-em)]](https://www.rsc.org/images/entities/char_2009.gif) Qe versus ln
Qe versus ln![[thin space (1/6-em)]](https://www.rsc.org/images/entities/char_2009.gif) Me) isotherms in the case of Cd(II) ions, respectively. Also, the results confirmed that the correlation coefficients (R2) of the Langmuir isotherm are larger than those of the Freundlich as shown in Tables 4 and 5. Therefore, the Langmuir isotherm better described equilibrium results than the Freundlich isotherm. The maximum adsorption capacity of the N1 and N2 nanocomposites toward Cu(II) ions is 64.81 and 40.93 mg g−1, respectively. Also, the maximum adsorption capacity of the N1 and N2 nanocomposites toward Cd(II) ions is 27.39 and 26.34 mg g−1, respectively. A comparison study was made between the adsorption capacity of the synthesized nanocomposites and that of other adsorbents such as biochar, FAU-type zeolite, thio-functionalized layered double hydroxide, sulfhydryl functionalized hydrogel, and silica/dibenzoylmethane composite as shown in Table 6.28–32,38–41 Clearly, the N1 and N2 nanocomposites outperformed the majority of adsorbents because they possess a high adsorption capacity.
Me) isotherms in the case of Cd(II) ions, respectively. Also, the results confirmed that the correlation coefficients (R2) of the Langmuir isotherm are larger than those of the Freundlich as shown in Tables 4 and 5. Therefore, the Langmuir isotherm better described equilibrium results than the Freundlich isotherm. The maximum adsorption capacity of the N1 and N2 nanocomposites toward Cu(II) ions is 64.81 and 40.93 mg g−1, respectively. Also, the maximum adsorption capacity of the N1 and N2 nanocomposites toward Cd(II) ions is 27.39 and 26.34 mg g−1, respectively. A comparison study was made between the adsorption capacity of the synthesized nanocomposites and that of other adsorbents such as biochar, FAU-type zeolite, thio-functionalized layered double hydroxide, sulfhydryl functionalized hydrogel, and silica/dibenzoylmethane composite as shown in Table 6.28–32,38–41 Clearly, the N1 and N2 nanocomposites outperformed the majority of adsorbents because they possess a high adsorption capacity.
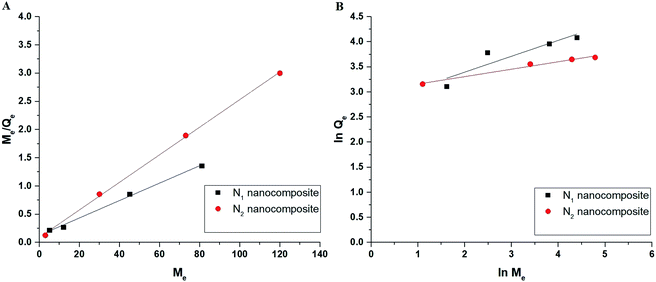 |
| | Fig. 12 The Langmuir (A) and Freundlich (B) isotherms in the case of Cu(II) ions. | |
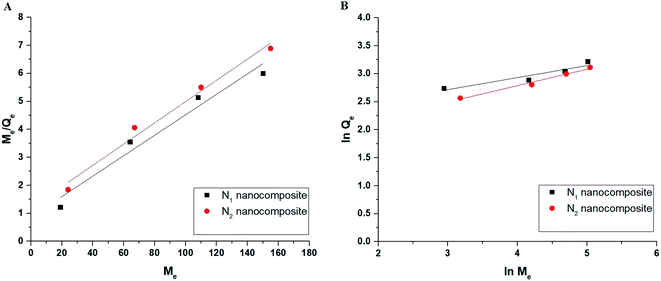 |
| | Fig. 13 The Langmuir (A) and Freundlich (B) isotherms in the case of Cd(II) ions. | |
Table 4 Equilibrium constants in the case of Cu(II) ions
| Sample |
Langmuir |
Freundlich |
| Qm (mg g−1) |
P4 (L mg−1) |
R2 |
Qm (mg g−1) |
P5 (mg g−1)(L mg−1)1/L |
R2 |
| N1 |
64.81 |
0.122 |
0.994 |
84.78 |
15.85 |
0.7735 |
| N2 |
40.93 |
0.272 |
0.999 |
44.47 |
20.30 |
0.975 |
Table 5 Equilibrium constants in the case of Cd(II) ions
| Sample |
Langmuir |
Freundlich |
| Qm (mg g−1) |
P4 (L mg−1) |
R2 |
Qm (mg g−1) |
P5 (mg g−1)(L mg−1)1/L |
R2 |
| N1 |
27.39 |
0.042 |
0.947 |
24.76 |
7.96 |
0.845 |
| N2 |
26.34 |
0.032 |
0.976 |
23.74 |
5.03 |
0.972 |
Table 6 A comparison study between the adsorption capacity of the synthesized nanocomposites and that of other adsorbents
| Adsorbent |
Adsorption capacity (mg g−1) toward Cu(II) ions |
Adsorption capacity (mg g−1) toward Cd(II) ions |
Ref. |
| Biochar |
18 |
6.28 |
28 |
| FAU-type zeolite |
57.803 |
74.074 |
29 |
| Thio-functionalized layered double hydroxide |
58.07 |
93.11 |
30 |
| Sulfhydryl functionalized hydrogel |
15.60 |
27.40 |
31 |
| Silica/dibenzoylmethane composite |
31.76 |
35.37 |
32 |
| Carbon gel/graphite composite |
8.64 |
- |
38 |
| Arabica and robusta roasted coffee beans |
2 |
2 |
39 |
| Natural zeolite |
2.5 |
1.5 |
40 |
| natural clay |
13.41 |
5.25 |
41 |
| N1 nanocomposite |
64.81 |
27.39 |
This study |
| N2 nanocomposite |
40.93 |
26.34 |
This study |
3.2.5. Effect of desorption and reusability. Fig. 14A–B depicts the plot of % D versus some desorbing eluents in the case of Cu(II) and Cd(II) ions, respectively. The utilized desorbing eluents are 0.5 M of HCl, HNO3, thiourea, and EDTA disodium salt. The results confirmed that 0.5 M of EDTA disodium salt is considered the appropriate desorbing eluent required for the maximum recovery (more than 99%) of the adsorbed Cu(II) or Cd(II) ions from the N1 or N2 nanocomposites. Fig. 15A–B depicts the plot of % R versus cycle number in the case of Cu(II) and Cd(II) ions, respectively. The slight decrease in % R confirms that the synthesized N1 and N2 nanocomposites can be used successfully and several times in the removal of Cu(II) and Cd(II) ions from aqueous media.
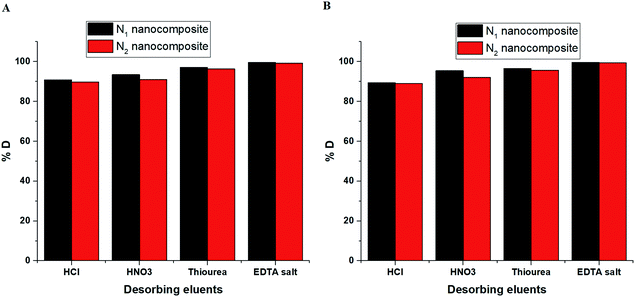 |
| | Fig. 14 The plot of % D versus some desorbing agents in the case of Cu(II) (A) and Cd(II) (B) ions. | |
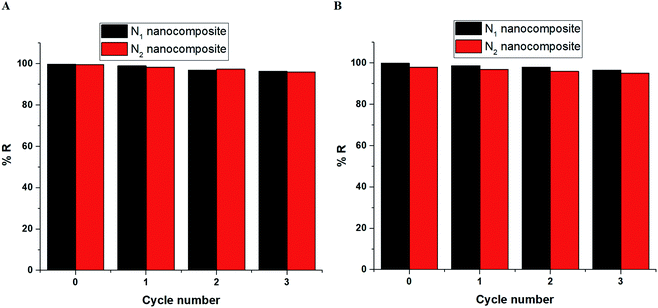 |
| | Fig. 15 The plot of % R or Q (mg g−1) versus cycle number in the case of Cu(II) (A) and Cd(II) (B) ions. | |
3.2.6. Effect of co-existing ions. To determine the effect of various anions and cations on the extraction efficiency of Cu(II) and Cd(II) ions using the present method, the possible interfering ion was introduced at varying concentrations to a 75 mL solution containing 200 μg L−1 of each metal ion under investigation. The extraction technique was carried out using N1 and N2 nanocomposites precisely as described earlier, and its effectiveness was evaluated. The tolerance limit was established as the highest concentration of the accompanying ion that cause an error ≤5% in the recovery of Cu(II) or Cd(II) ions by the procedure. Tables 7 and 8 clearly illustrate that the majority of coexisting ions have a rather high tolerance limit, demonstrating the selectivity of the technique. Consequently, the method can be applied to the analysis of real samples including various components.
Table 7 Removal of Cu(II) and Cd(II) ions from binary mixtures using N1 nanocomposite in the presence of different diverse ions
| Diverse ion |
Tolerance limit (mg L−1) |
% R |
| Cu(II) |
Cd(II) |
| K(I) |
900 |
99.15 |
99.96 |
| Na(I) |
900 |
99.24 |
99.65 |
| Ca(II) |
120 |
98.38 |
99.08 |
| Ba(II) |
80 |
99.08 |
99.18 |
| Mg(II) |
120 |
97.17 |
99.00 |
| Hg(II) |
80 |
98.57 |
98.37 |
| Fe(II) |
120 |
97.39 |
99.14 |
| Mn(II) |
80 |
96.79 |
97.76 |
| Ni(II) |
80 |
95.87 |
96.79 |
| Al(III) |
80 |
98.16 |
98.45 |
| Fe(III) |
100 |
99.46 |
99.53 |
| HCO3− |
1000 |
99.68 |
99.78 |
| NO3− |
1000 |
99.73 |
99.65 |
| Cl− |
1000 |
99.82 |
99.72 |
| SO42− |
1000 |
99.18 |
99.64 |
Table 8 Removal of Cu(II) and Cd(II) ions from binary mixtures using N2 nanocomposite in the presence of different diverse ions
| Diverse ion |
Tolerance limit (mg L−1) |
% R |
| Cu(II) |
Cd(II) |
| K(I) |
900 |
99.26 |
99.78 |
| Na(I) |
900 |
99.37 |
99.89 |
| Ca(II) |
120 |
98.26 |
99.16 |
| Ba(II) |
80 |
99.65 |
99.32 |
| Mg(II) |
120 |
97.28 |
99.43 |
| Hg(II) |
80 |
98.54 |
98.52 |
| Fe(II) |
120 |
97.31 |
98.95 |
| Mn(II) |
80 |
96.64 |
98.15 |
| Ni(II) |
80 |
95.77 |
96.64 |
| Al(III) |
80 |
98.53 |
98.83 |
| Fe(III) |
100 |
99.36 |
99.73 |
| HCO3- |
1000 |
99.47 |
99.58 |
| NO3- |
1000 |
99.17 |
99.28 |
| Cl− |
1000 |
99.63 |
99.71 |
| SO42- |
1000 |
99.13 |
99.82 |
3.2.7. Application. Prior to atomic absorption spectrometer analysis, the proposed separation process was employed to preconcentrate Cu(II) and Cd(II) ions in real samples (sea water, tap water, fish muscles, and blood). The results of the preconcentration of Cu(II) using N1 and N2 nanocomposites, as well as the recoveries for the spiked samples, are presented in Tables 9 and 10, respectively. The results of the preconcentration of Cd(II) using N1 and N2 nanocomposites, as well as the recoveries for the spiked samples, are presented in Tables 11 and 12, respectively. % Recovery was calculated using eqn (10).| |
 | (10) |
Table 9 Determination of Cu(II) ions in real samples using N1 nanocomposite
| Sample |
Added volume from Cu(II) stock solution (1000 mg L−1) |
| 0 mL |
0.2 mL |
0.4 mL |
| Found concentration (mg L−1) |
% Recovery |
% RSD |
Found concentration (mg L−1) |
% Recovery |
% RSD |
Found concentration (mg L−1) |
% Recovery |
% RSD |
| Sea water |
4.600 ± 0.124 |
— |
2.174 |
7.040 ± 0.142 |
97.139 |
1.619 |
9.62 ± 0.309 |
97.362 |
2.589 |
| Tap water |
8.320 ± 0.492 |
— |
2.150 |
10.816 ± 0.255 |
98.709 |
1.901 |
13.580 ± 0.492 |
99.993 |
2.918 |
| Fish muscles |
7.230 ± 0.247 |
— |
2.749 |
9.820 ± 0.254 |
99.490 |
2.087 |
12.400 ± 0.351 |
99.226 |
2.281 |
| Blood |
1.090 ± 0.028 |
— |
2.051 |
3.580 ± 0.104 |
95.551 |
2.337 |
6.358 ± 0.053 |
99.511 |
0.671 |
Table 10 Determination of Cu(II) ions in real samples using N2 nanocomposite
| Sample |
Added volume from Cu(II) stock solution (1000 mg L−1) |
| 0 mL |
0.2 mL |
0.4 mL |
| Found concentration (mg L−1) |
% Recovery |
% RSD |
Found concentration (mg L−1) |
% Recovery |
% RSD |
Found concentration (mg L−1) |
% Recovery |
% RSD |
| Sea water |
4.500 ± 0.124 |
— |
2.222 |
6.990 ± 0.188 |
97.795 |
2.169 |
9.540 ± 0.272 |
97.534 |
2.297 |
| Tap water |
8.300 ± 0.152 |
— |
1.476 |
10.876 ± 0.141 |
99.438 |
1.043 |
13.500 ± 0.412 |
99.550 |
2.457 |
| Fish muscles |
7.060 ± 0.225 |
— |
2.573 |
9.660 ± 0.299 |
99.579 |
2.493 |
12.260 ± 0.208 |
99.451 |
1.365 |
| Blood |
1.082 ± 0.025 |
— |
1.894 |
3.600 ± 0.088 |
96.290 |
1.964 |
6.280 ± 0.195 |
98.413 |
2.495 |
Table 11 Determination of Cd(II) ions in real samples using N1 nanocomposite
| Sample |
Added volume from Cd(II) stock solution (1000 mg L−1) |
| 0 mL |
0.2 mL |
0.4 mL |
| Found concentration (mg L−1) |
% Recovery |
% RSD |
Found concentration (mg L−1) |
% Recovery |
% RSD |
Found concentration (mg L−1) |
% Recovery |
% RSD |
| Sea water |
0.184 ± 0.007 |
— |
2.977 |
2.720 ± 0.104 |
95.671 |
3.076 |
5.390 ± 0.092 |
98.213 |
1.376 |
| Tap water |
0.146 ± 0.005 |
— |
2.837 |
2.754 ± 0.063 |
98.168 |
1.844 |
5.372 ± 0.103 |
98.560 |
1.549 |
| Fish muscles |
21.100 ± 0.679 |
— |
2.596 |
23.400 ± 0.519 |
98.719 |
1.788 |
26.200 ± 0.555 |
99.646 |
1.707 |
| Blood |
1.068 ± 0.037 |
— |
2.762 |
3.564 ± 0.119 |
95.685 |
2.696 |
6.348 ± 0.132 |
99.696 |
1.672 |
Table 12 Determination of Cd(II) ions in real samples using N2 nanocomposite
| Sample |
Added volume from Cd(II) stock solution (1000 mg L−1) |
| 0 mL |
0.2 mL |
0.4 mL |
| Found concentration (mg L−1) |
% Recovery |
% RSD |
Found concentration (mg L−1) |
% Recovery |
% RSD |
Found concentration (mg L−1) |
% Recovery |
% RSD |
| Sea water |
0.171 ± 0.006 |
— |
2.905 |
2.740 ± 0.068 |
96.802 |
1.999 |
5.450 ± 0.088 |
99.534 |
1.297 |
| Tap water |
0.157 ± 0.006 |
— |
2.848 |
2.774 ± 0.054 |
98.503 |
1.563 |
5.440 ± 0.142 |
99.612 |
2.096 |
| Fish muscles |
21.600 ± 0.473 |
— |
1.763 |
24.000 ± 0.760 |
99.165 |
2.552 |
26.730 ± 0.890 |
99.774 |
2.683 |
| Blood |
1.078 ± 0.038 |
— |
2.814 |
3.594 ± 0.089 |
96.232 |
2.002 |
6.334 ± 0.137 |
99.321 |
1.742 |
Also, % RSD (relative standard deviation) was calculated using eqn (11).
| |
 | (11) |
The recovery results indicate the process's precision, adaptability, and quantitative separation because the values of % recovery are more than 95%. In addition, the % RSD was less than 3.5%, showing excellent reproducibility.
4. Conclusions
In this study, silica nanoparticles were modified by 2,4-dihydroxybenzaldehyde and 5-bromosalicylaldehyde to form N1 and N2 new nanocomposites, respectively. The nanocomposites were utilized for the removal and preconcentration of Cu(II) and Cd(II) ions from water, blood, and fish muscles. XRD, FT-IR, CHN elemental analyzer, FE-SEM, and nitrogen gas sorption analyzer were used to characterize the novel nanocomposites. The maximum adsorption capacity of the N1 and N2 nanocomposites toward Cu(II) ions is 64.81 and 40.93 mg g−1, respectively. The maximum adsorption capacity of the N1 and N2 nanocomposites toward Cd(II) ions is 27.39 and 26.34 mg g−1, respectively. The recovery findings demonstrate that the preconcentration process is accurate, adaptable, and resulted in quantitative separation (>95 percent). Furthermore, the % RSD was less than 3.5 percent, indicating good reproducibility.
Conflicts of interest
The authors confirm that there is no conflict of interest for this manuscript.
References
- B. K. Mavakala, P. Sivalingam, A. Laffite, C. K. Mulaji, G. Giuliani, P. T. Mpiana and J. Poté, Evaluation of heavy metal content and potential ecological risks in soil samples from wild solid waste dumpsites in developing country under tropical conditions, Environ. Challenges, 2022, 7, 100461 CrossRef CAS.
- M. A. Rahmat, A. F. Ismail, N. D. Rodzi, E. S. Aziman, W. M. R. Idris and T. Lihan, Assessment of natural radionuclides and heavy metals contamination to the environment: Case study of Malaysian unregulated tin-tailing processing industry, Nucl. Eng. Technol., 2022, 54(6), 2230–2243 CrossRef CAS.
- M. A. Shamim, H. Zia, M. Zeeshan, M. Y. Khan and M. Shahid, Metal organic frameworks (MOFs) as a cutting-edge tool for the selective detection and rapid removal of heavy metal ions from water: Recent progress, J. Environ. Chem. Eng., 2022, 10, 106991 CrossRef CAS.
- M. M. Kwikima, S. Mateso and Y. Chebude, Potentials of agricultural wastes as the ultimate alternative adsorbent for cadmium removal from wastewater, Sci. Afr., 2021, 13, e00934 Search PubMed.
- M. Kumar, A. Kushwaha, L. Goswami, A. K. Singh and M. Sikandar, A review on advances and mechanism for the phycoremediation of cadmium contaminated wastewater, Cleaner Engineering and Technology, 2021, 5, 100288 CrossRef.
- T. Liu, Y. Lawluvy, Y. Shi, J. O. Ighalo, Y. He, Y. Zhang and P. Yap, Adsorption of cadmium and lead from aqueous solution using modified biochar: A review, J. Environ. Chem. Eng., 2022, 10, 106502 CrossRef CAS.
- K. Elewa, A. Belal, O. El Monayeri and A. F. Tawfic, Application of metal-organic framework (Zn-Ph-D CP) for copper ion removal from aqueous solution, Ain Shams Eng. J., 2022, 13, 101670 CrossRef.
- B. Lv, Z. Zhao, X. Deng, C. Fang, B. Xing and B. Dong, Hydrodynamics and adsorption performance of liquid–solid fluidized bed with granular activated carbon for removal of copper ions from wastewater, J. Cleaner Prod., 2021, 328, 129627 CrossRef CAS.
- V. Krstić, T. Urošević and B. Pešovski, A review on adsorbents for treatment of water and wastewaters containing copper ions, Chem. Eng. Sci., 2018, 192, 273–287 CrossRef.
- M. Zaynab, R. Al-Yahyai, A. Ameen, Y. Sharif, L. Ali, M. Fatima, K. A. Khan and S. Li, Health and environmental effects of heavy metals, J. King Saud Univ., Sci., 2022, 34, 101653 CrossRef.
- S. Sandilyan and K. Kathiresan, Decline of mangroves - A threat of heavy metal poisoning in Asia, Ocean Coast. Manag., 2014, 102, 161–168 CrossRef.
- J. Briffa, E. Sinagra and R. Blundell, Heavy metal pollution in the environment and their toxicological effects on humans, Heliyon, 2020, 6, e04691 CrossRef PubMed.
- Y. Zhang, L. Zhang, R. Gao, L. Zhong and J. Xue, CaCO3-coated PVA/BC-based composite for the simultaneous adsorption of Cu(II), Cd(II), Pb(II) in aqueous solution, Carbohydr. Polym., 2021, 267, 118227 CrossRef CAS PubMed.
- Y. Ma, Z. Deng, Z. Li, Q. Lin, Y. Wu and W. Dou, Adsorption characteristics and mechanism for K2Ti4O9 whiskers removal of Pb(II), Cd(II), and Cu(II) cations in wastewater, J. Environ. Chem. Eng., 2021, 9, 106236 CrossRef CAS.
- Q. Hou, H. Zhou, W. Zhang, Q. Chang, J. Yang, C. Xue and S. Hu, Boosting adsorption of heavy metal ions in wastewater through solar-driven interfacial evaporation of chemically-treated carbonized wood, Sci. Total Environ., 2021, 759, 144317 CrossRef CAS PubMed.
- K. Kalaitzidou, A. Zouboulis and M. Mitrakas, Cost evaluation for Se(IV) removal, by applying common drinking water treatment processes: Coagulation/precipitation or adsorption, J. Environ. Chem. Eng., 2020, 8, 104209 CrossRef CAS.
- L. Yang, W. Hu, Z. Chang, T. Liu, D. Fang, P. Shao, H. Shi and X. Luo, Electrochemical recovery and high value-added reutilization of heavy metal ions from wastewater: Recent advances and future trends, Environ. Int., 2021, 152, 106512 CrossRef CAS PubMed.
- A. M. Nasir, P. S. Goh, M. S. Abdullah, B. C. Ng and A. F. Ismail, Adsorptive nanocomposite membranes for heavy metal remediation: Recent progresses and challenges, Chemosphere, 2019, 232, 96–112 CrossRef CAS PubMed.
- C. Zamora-Ledezma, D. Negrete-Bolagay, F. Figueroa, E. Zamora-Ledezma, M. Ni, F. Alexis and V. H. Guerrero, Heavy metal water pollution: A fresh look about hazards, novel and conventional remediation methods, Environ. Technol. Innovation, 2021, 22, 101504 CrossRef CAS.
- E. A. Abdelrahman, D. A. Tolan and M. Y. Nassar, A Tunable Template-Assisted Hydrothermal Synthesis of Hydroxysodalite Zeolite Nanoparticles Using Various Aliphatic Organic Acids for the Removal of Zinc(II) Ions from Aqueous Media, J. Inorg. Organomet. Polym. Mater., 2019, 29, 229–247 CrossRef CAS.
- A. M. Hameed, A. Alharbi, E. A. Abdelrahman, E. M. Mabrouk, R. M. Hegazey, F. K. Algethami, Y. O. Al-Ghamdi and H. M. Youssef, Facile Hydrothermal Fabrication of Analcime and Zeolite X for Efficient Removal of Cd(II) Ions From Aqueous Media and Polluted Water, J. Inorg. Organomet. Polym. Mater., 2020, 30, 4117–4128 CrossRef CAS.
- E. A. Abdelrahman, A. Alharbi, A. Subaihi, A. M. Hameed, M. A. Almutairi, F. K. Algethami and H. M. Youssef, Facile fabrication of novel analcime/sodium aluminum silicate hydrate and zeolite Y/faujasite mesoporous nanocomposites for efficient removal of Cu(II) and Pb(II) ions from aqueous media, J. Mater. Res. Technol., 2020, 9, 7900–7914 CrossRef CAS.
- H. M. Youssef, R. K. Shah, F. K. Algethami, R. M. Hegazey, A. M. Naglah, M. A. Al-Omar, A. A. Alluhaybi, H. A. Alherbish, E. M. Mabrouk and E. A. Abdelrahman, Facile Hydrothermal Procedure for the Synthesis of Sodium Aluminum Silicate Hydrate/Analcime and Analcime for Effective Removal of Manganese(II) Ions From Aqueous Solutions, J. Inorg. Organomet. Polym. Mater., 2021, 31, 1035–1046 CrossRef CAS.
- E. A. Abdelrahman and R. M. Hegazey, Utilization of waste aluminum cans in the fabrication of hydroxysodalite nanoparticles and their chitosan biopolymer composites for the removal of Ni(II) and Pb(II) ions from aqueous solutions: Kinetic, equilibrium, and reusability studies, Microchem. J., 2019, 145, 18–25 CrossRef CAS.
- E. A. Abdelrahman, Y. G. Abou El-Reash, H. M. Youssef, Y. H. Kotp and R. M. Hegazey, Utilization of rice husk and waste aluminum cans for the synthesis of some nanosized zeolite, zeolite/zeolite, and geopolymer/zeolite products for the efficient removal of Co(II), Cu(II), and Zn(II) ions from aqueous media, J. Hazard. Mater., 2021, 401, 123813 CrossRef CAS PubMed.
- E. A. Abdelrahman and R. M. Hegazey, Exploitation of Egyptian insecticide cans in the fabrication of Si/Fe nanostructures and their chitosan polymer composites for the removal of Ni(II), Cu(II), and Zn(II) ions from aqueous solutions, Composites, Part B, 2019, 166, 382–400 CrossRef CAS.
- C. Duan, T. Ma, J. Wang and Y. Zhou, Removal of heavy metals from aqueous solution using carbon-based adsorbents: A review, J. Water Process Eng., 2020, 37, 101339 CrossRef.
- T. Bandara, J. Xu, I. D. Potter, A. Franks, J. B. A. J. Chathurika and C. Tang, Mechanisms for the removal of Cd(II) and Cu(II) from aqueous solution and mine water by biochars derived from agricultural wastes, Chemosphere, 2020, 254, 126745 CrossRef CAS PubMed.
- I. V. Joseph, L. Tosheva and A. M. Doyle, Simultaneous removal of Cd(II), Co(II), Cu(II), Pb(II), and Zn(II) ions from aqueous solutions via adsorption on FAU-type zeolites prepared from coal fly ash, J. Environ. Chem. Eng., 2020, 8, 103895 CrossRef CAS.
- J. Ali, H. Wang, J. Ifthikar, A. Khan, T. Wang, K. Zhan, A. Shahzad, Z. Chen and Z. Chen, Efficient, stable and selective adsorption of heavy metals by thio-functionalized layered double hydroxide in diverse types of water, Chem. Eng. J., 2018, 332, 387–397 CrossRef CAS.
- R. Hua and Z. Li, Sulfhydryl functionalized hydrogel with magnetism: Synthesis,
characterization, and adsorption behavior study for heavy metal removal, Chem. Eng. J., 2014, 249, 189–200 CrossRef CAS.
- M. E. Khalifa, E. A. Abdelrahman, M. M. Hassanien and W. A. Ibrahim, Application of Mesoporous Silica Nanoparticles Modified with Dibenzoylmethane as a Novel Composite for Efficient Removal of Cd(II), Hg(II), and Cu(II) Ions from Aqueous Media, J. Inorg. Organomet. Polym. Mater., 2020, 30, 2182–2196 CrossRef CAS.
- I. M. M. Kenawy, Y. G. Abou El-Reash, M. M. Hassanien, N. R. Alnagar and W. I. Mortada, Use of microwave irradiation for modification of mesoporous silica nanoparticles by thioglycolic acid for removal of cadmium and mercury, Microporous Mesoporous Mater., 2018, 258, 217–227 CrossRef CAS.
- S. Xue, H. Xie, H. Ping, Q. Li, B. Su and Z. Fu, Induced Transformation of Amorphous Silica to Cristobalite on Bacterial Surface, RSC Adv., 2015, 5, 71844–71848 RSC.
- V. Correcher, J. Garcia-Guinea, M. A. Bustillo and R. Garcia, Study of the thermoluminescence emission of a natural α-cristobalite, Radiat. Eff. Defects Solids, 2009, 164, 59–67 CrossRef CAS.
- Z. P. Xu and P. S. Braterman, High affinity of dodecylbenzene sulfonate for layered double hydroxide and resulting morphological changes, J. Mater. Chem., 2003, 13, 268–273 RSC.
- E. A. Abdelrahman, R. M. Hegazey and R. E. El-Azabawy, Efficient removal of methylene blue dye from aqueous media using Fe/Si, Cr/Si, Ni/Si, and Zn/Si amorphous novel adsorbents, J. Mater. Res. Technol., 2019, 8(6), 5301–5313 CrossRef CAS.
- M. Osińska, Removal of lead(II), copper(II), cobalt(II) and nickel(II) ions from aqueous solutions using carbon gels, J. Sol-Gel Sci. Technol., 2017, 81, 678–692 CrossRef.
- E. Lichtfouse, J. Schwarzbauer and D. Robert, Environmental chemistry, Springer, 2001, pp. 119–259, DOI:10.1021/ed078p1169.
- N. Elboughdiri, The use of natural zeolite to remove heavy metals Cu(II), Pb(II) and Cd(II), from industrial wastewater, journal Cogent Engineering, 2020, 7, 1782623 CrossRef.
- B. Abbou, I. Lebkiri, H. Ouaddari, L. Kadiri, A. Ouass, A. Habsaoui, A. Lebkiri and E. H. Rifi, Removal of Cd(II), Cu(II), and Pb(II) by adsorption onto natural clay: A kinetic and thermodynamic study, Turk. J. Chem., 2021, 45, 362–376 CrossRef CAS PubMed.
|
| This journal is © The Royal Society of Chemistry 2022 |
Click here to see how this site uses Cookies. View our privacy policy here.  Open Access Article
 a and
Ehab A. Abdelrahman
 *b
*b
![[double bond, length as m-dash]](https://www.rsc.org/images/entities/char_e001.gif) N group, the intensity of the XRD peak at 2θ = 21.9° in the N1 and N2 nanocomposites decreased significantly. The FT-IR bands, which appeared at 1603 and 1629 cm−1 in the N1 and N2 nanocomposites, are attributable to the bending vibration of C
N group, the intensity of the XRD peak at 2θ = 21.9° in the N1 and N2 nanocomposites decreased significantly. The FT-IR bands, which appeared at 1603 and 1629 cm−1 in the N1 and N2 nanocomposites, are attributable to the bending vibration of C![[double bond, length as m-dash]](https://www.rsc.org/images/entities/char_e001.gif) N and/or OH, respectively. Also, the FE-SEM analysis shows the morphology of the silica nanoparticles which were identified as spherical and rod-like with slight agglomeration while the N1 and N2 nanocomposites have flaky surfaces due to the formation of C
N and/or OH, respectively. Also, the FE-SEM analysis shows the morphology of the silica nanoparticles which were identified as spherical and rod-like with slight agglomeration while the N1 and N2 nanocomposites have flaky surfaces due to the formation of C![[double bond, length as m-dash]](https://www.rsc.org/images/entities/char_e001.gif) N groups. The maximum Cu(II) ion adsorption capacities of the N1 and N2 nanocomposites are 64.81 and 40.93 mg g−1, respectively. The maximum Cd(II) ion adsorption capacities of the N1 and N2 nanocomposites are 27.39 and 26.34 mg g−1, respectively. The adsorption of Cu(II) or Cd(II) ions using the synthesized nanocomposites is spontaneous, chemical, exothermic, and well-matched with the Langmuir equilibrium isotherm. The recovery findings demonstrate that the preconcentration process is accurate, adaptable, and resulted in quantitative separation because % Recovery is more than 95%. Furthermore, the % RSD was less than 3.5%, indicating good reproducibility.
N groups. The maximum Cu(II) ion adsorption capacities of the N1 and N2 nanocomposites are 64.81 and 40.93 mg g−1, respectively. The maximum Cd(II) ion adsorption capacities of the N1 and N2 nanocomposites are 27.39 and 26.34 mg g−1, respectively. The adsorption of Cu(II) or Cd(II) ions using the synthesized nanocomposites is spontaneous, chemical, exothermic, and well-matched with the Langmuir equilibrium isotherm. The recovery findings demonstrate that the preconcentration process is accurate, adaptable, and resulted in quantitative separation because % Recovery is more than 95%. Furthermore, the % RSD was less than 3.5%, indicating good reproducibility.


![[double bond, length as m-dash]](https://www.rsc.org/images/entities/char_e001.gif) N, respectively. The bands that appeared in the N1 and N2 samples at 3263 and 3260 cm−1 are due to the stretching vibration of OH, respectively. The bands that appeared in the N1 and N2 samples at 2940 and 2941 cm−1 are due to the stretching vibration of aliphatic CH, respectively. The bands that appeared in the N1 and N2 samples at 3003 and 3005 cm−1 are due to the stretching vibration of aromatic CH, respectively. The bands that appeared in the N1 and N2 samples in the range 1436–1506 cm−1 and 1435–1510 cm−1 are due to the stretching vibration of aromatic C
N, respectively. The bands that appeared in the N1 and N2 samples at 3263 and 3260 cm−1 are due to the stretching vibration of OH, respectively. The bands that appeared in the N1 and N2 samples at 2940 and 2941 cm−1 are due to the stretching vibration of aliphatic CH, respectively. The bands that appeared in the N1 and N2 samples at 3003 and 3005 cm−1 are due to the stretching vibration of aromatic CH, respectively. The bands that appeared in the N1 and N2 samples in the range 1436–1506 cm−1 and 1435–1510 cm−1 are due to the stretching vibration of aromatic C![[double bond, length as m-dash]](https://www.rsc.org/images/entities/char_e001.gif) C, respectively. The band that appeared in the N1 and N2 samples at 1374 and 1377 cm−1 are due to the bending vibration of CH, respectively. The bands that appeared in the N1 and N2 samples in the range 845–920 and 918 cm−1 are due to the out-of-plane bending vibration of CH aromatic, respectively.36 The slight displacement in the band positions of silica and the appearance of organic groups in the synthesized composites confirm the successful loading of the aforementioned organic materials on silica.
C, respectively. The band that appeared in the N1 and N2 samples at 1374 and 1377 cm−1 are due to the bending vibration of CH, respectively. The bands that appeared in the N1 and N2 samples in the range 845–920 and 918 cm−1 are due to the out-of-plane bending vibration of CH aromatic, respectively.36 The slight displacement in the band positions of silica and the appearance of organic groups in the synthesized composites confirm the successful loading of the aforementioned organic materials on silica.
![[double bond, length as m-dash]](https://www.rsc.org/images/entities/char_e001.gif) N group.
N group.


![[thin space (1/6-em)]](https://www.rsc.org/images/entities/char_2009.gif) KT and 1/T. The thermodynamic parameters are listed in Tables 2 and 3. The results clarified that the adsorption of Cu(II) or Cd(II) ions using the N1 and N2 nanocomposites is chemical because the value of ΔHo is more than 40 kJ mol−1.32 Also, the adsorption of Cu(II) or Cd(II) ions using the N1 and N2 nanocomposites is exothermic owing to the negative sign of ΔHo. The N1 and N2 nanocomposites can form chelates with Cu(II) or Cd(II) ions as clarified in Scheme 2. In addition, the spontaneous adsorption of Cu(II) or Cd(II) ions on N1 and N2 nanocomposites is due to the negative sign of ΔGo. Moreover, the disordered adsorption of Cu(II) or Cd(II) ions at the solution boundary/nanocomposite is related to the positive sign of ΔSo.
KT and 1/T. The thermodynamic parameters are listed in Tables 2 and 3. The results clarified that the adsorption of Cu(II) or Cd(II) ions using the N1 and N2 nanocomposites is chemical because the value of ΔHo is more than 40 kJ mol−1.32 Also, the adsorption of Cu(II) or Cd(II) ions using the N1 and N2 nanocomposites is exothermic owing to the negative sign of ΔHo. The N1 and N2 nanocomposites can form chelates with Cu(II) or Cd(II) ions as clarified in Scheme 2. In addition, the spontaneous adsorption of Cu(II) or Cd(II) ions on N1 and N2 nanocomposites is due to the negative sign of ΔGo. Moreover, the disordered adsorption of Cu(II) or Cd(II) ions at the solution boundary/nanocomposite is related to the positive sign of ΔSo.

![[thin space (1/6-em)]](https://www.rsc.org/images/entities/char_2009.gif) Qe versus ln
Qe versus ln![[thin space (1/6-em)]](https://www.rsc.org/images/entities/char_2009.gif) Me) isotherms in the case of Cu(II) ions, respectively. Also, Fig. 13A–B represents the Langmuir (the plot of Me/Qe versus Me) and Freundlich (the plot of ln
Me) isotherms in the case of Cu(II) ions, respectively. Also, Fig. 13A–B represents the Langmuir (the plot of Me/Qe versus Me) and Freundlich (the plot of ln![[thin space (1/6-em)]](https://www.rsc.org/images/entities/char_2009.gif) Qe versus ln
Qe versus ln![[thin space (1/6-em)]](https://www.rsc.org/images/entities/char_2009.gif) Me) isotherms in the case of Cd(II) ions, respectively. Also, the results confirmed that the correlation coefficients (R2) of the Langmuir isotherm are larger than those of the Freundlich as shown in Tables 4 and 5. Therefore, the Langmuir isotherm better described equilibrium results than the Freundlich isotherm. The maximum adsorption capacity of the N1 and N2 nanocomposites toward Cu(II) ions is 64.81 and 40.93 mg g−1, respectively. Also, the maximum adsorption capacity of the N1 and N2 nanocomposites toward Cd(II) ions is 27.39 and 26.34 mg g−1, respectively. A comparison study was made between the adsorption capacity of the synthesized nanocomposites and that of other adsorbents such as biochar, FAU-type zeolite, thio-functionalized layered double hydroxide, sulfhydryl functionalized hydrogel, and silica/dibenzoylmethane composite as shown in Table 6.28–32,38–41 Clearly, the N1 and N2 nanocomposites outperformed the majority of adsorbents because they possess a high adsorption capacity.
Me) isotherms in the case of Cd(II) ions, respectively. Also, the results confirmed that the correlation coefficients (R2) of the Langmuir isotherm are larger than those of the Freundlich as shown in Tables 4 and 5. Therefore, the Langmuir isotherm better described equilibrium results than the Freundlich isotherm. The maximum adsorption capacity of the N1 and N2 nanocomposites toward Cu(II) ions is 64.81 and 40.93 mg g−1, respectively. Also, the maximum adsorption capacity of the N1 and N2 nanocomposites toward Cd(II) ions is 27.39 and 26.34 mg g−1, respectively. A comparison study was made between the adsorption capacity of the synthesized nanocomposites and that of other adsorbents such as biochar, FAU-type zeolite, thio-functionalized layered double hydroxide, sulfhydryl functionalized hydrogel, and silica/dibenzoylmethane composite as shown in Table 6.28–32,38–41 Clearly, the N1 and N2 nanocomposites outperformed the majority of adsorbents because they possess a high adsorption capacity.


