 Open Access Article
Ionic liquid-immobilized silica gel as a new sorbent for solid-phase extraction of heavy metal ions in water samples†
The Thai Nguyenab,
Tu-Hoai Duy Nguyenab,
Tam Thanh Thi Huynhab,
Minh-Huy Dinh Dangbc,
Linh Ho Thuy Nguyen bc,
Tan Le Hoang Doan
 bc,
Thinh Phuc Nguyenbd,
Mai Anh Nguyen*bd and
Phuong Hoang Tran
 *ab
*ab
aDepartment of Organic Chemistry, Faculty of Chemistry, University of Science, Ho Chi Minh City, Vietnam. E-mail: thphuong@hcmus.edu.vn
bVietnam National University, Ho Chi Minh City, Vietnam. E-mail: namai@hcmus.edu.vn
cCenter for Innovative Materials and Architectures (INOMAR), Ho Chi Minh City, Vietnam
dDepartment of Analytical Chemistry, Faculty of Chemistry, University of Science, Ho Chi Minh City, Vietnam
First published on 7th July 2022
Abstract
In the current study, we have developed a solid-phase extraction (SPE) method with novel C18-alkylimidazolium ionic liquid immobilized silica (SiO2–(CH2)3–Im–C18) for the preconcentration of trace heavy metals from aqueous samples as a prior step to their determination by inductively coupled plasma mass spectrometry (ICPMS). The material was characterized by Fourier-transform Infrared Spectroscopy (FTIR), Scanning Electron Microscopy (SEM), Thermogravimetric Analysis (TGA), Energy-Dispersive X-ray Spectroscopy (EDS), and Brunauer–Emmett–Teller (BET) analysis. A mini-column packed with SiO2–(CH2)3–Im–C18 sorbent was used for the extraction of the metal ions complexed with 1-(2-pyridylazo)-2-naphthol (PAN) from the water sample. The effects of pH, PAN concentration, length of the alkyl chain of the ionic liquid, eluent concentration, eluent volume, and breakthrough volume have been investigated. The SiO2–(CH2)3–Im–C18 allows the isolation and preconcentration of the heavy metal ions with enrichment factors of 150, 60, 80, 80, and 150 for Cr3+, Ni2+, Cu2+, Cd2+, and Pb2+, respectively. The limits of detection (LODs) for Cr3+, Ni2+, Cu2+, Cd2+, and Pb2+ were 0.724, 11.329, 4.571, 0.112, and 0.819 μg L−1, respectively with the relative standard deviation (RSD) in the range of 0.941–1.351%.
1. Introduction
Heavy metals have been widely used in various industries, including batteries, catalysts, dyes, textiles, paints, and cosmetics.1–3 Heavy metals are considered one of the most common and hazardous pollutants in water due to the continuous increase of industry and other human activities.4,5 Hence, metal content at the trace level in the environment has to be strongly regulated and controlled.6 Main sources significantly contribute to the heavy metal contamination in the environment, including fossil fuel combustion, industrial plants, fertilizer usage. Especially, wastewaters were released from industrial zones containing heavy metals brings about a threat not only to aquatic life but also to the whole food chain.7,8 Thus, it is essential to monitor and assess heavy metals pollution in water.The sample preparation, including separation and preconcentration of the analytes, is a significant priority to gain accurate results in the analysis of heavy metal ions in water samples.9 Extraction methods, including liquid–liquid extraction (LLE) and later solid-phase extraction (SPE), have been applied as effective sample pretreatment techniques to analyze metal at trace levels.10,11 However, there are many disadvantages associated with liquid–liquid extraction, for example, incomplete phase separations, disposal of large quantities of organic solvent and manual performance.12 Solid-phase extraction (SPE) provides a practical, reliable, and facile method for the preconcentration of heavy metals due to its low cost, high throughput, less organic solvent consumption, and automation ability.13 SPE can be applied for a broader range of practical design situations than LLE because of the wide variety of sorbent chemistries, fast and automatic procedures.14 Novel materials with various surface chemistries have been prepared, including modified silica,15–17 graphene oxide,6,18,19 imprinted polymers,20,21 magnetic nanoparticles,22 carbon nanotubes,23–25 polymer,26,27 and metal–organic framework28–30 which applied as effective sorbents for the extraction of heavy metals.
Ionic liquids (ILs) are low melting point salts (below 100 °C), which are achieved mainly by bulky asymmetric cations and weakly coordinating anions.31,32 They have attracted much attention due to their unique physical and chemical properties, including non-flammability, excellent conductivity, low vapor pressures, thermal stability, and designable structure.31,33,34 ILs have emerged as potential candidates for sample preparation in several analytical determinations.35 In the last decade, ILs can be tailored from a wide range of cations (tetraalkylammonium, imidazolium, morpholinium, oxazolidium, pyrrolidinium, piperidinium, piperazinium, pyridinium, phosphonium, sulfonium) and anions (chloride, bromide, hydrogensulfate, tosylate, hexafluorophosphate, and tetrafluoroborate) and thereby leading to the name of “designer solvents”. ILs are efficient sorbents for sample preparation because they can be designed to accomplish specific analytes.36
Silica porous materials have been used as supports in the preparation of sorbents due to their large specific surface areas and the ease of surface modification. Recently, IL-immobilized silica gels have been successfully used as efficient adsorbents in the SPE technique.31,37,38 These sorbents can utilize as sorbents for sample preparation with a wide range of mechanisms of sorption, such as anion exchange, hydrogen bonding, and hydrophobic interactions.33 Interestingly, these sorbents have been shown to be efficient sorbents for the separation of heavy metal ions.39,40 Shemirani reported the use of [BMIM][PF6] (1-butyl-3-methylimidazolium hexafluorophosphate) immobilized onto silica gel as the sorbent for solid-phase extraction of Mn2+, Ni2+, Cd2+, Co2+, and Pb2+ ions from tobacco and water samples before FAAS analysis. The IL-immobilized silica gel avoided the disadvantages of liquid–liquid extraction using ILs as extractants, such as slow mass transfer, excess amount of ILs, and leaching loss of ILs to the aqueous phase.41 Thiol- and amino-functionalized ionic liquids were also shown great potential and high selectivity for the SPE of heavy metal ions without the use of complexing reagents.39,42–44
In the presented work, a new type of sorbent composed of silica gel and C18-alkylimidazolium ionic liquid immobilized silica (SiO2–(CH2)3–Im–C18) was firstly utilized for the simultaneous preconcentration of heavy metal cations in water samples. A novel C18-alkylimidazolium ionic liquid was prepared from imidazole as a starting material and immobilized onto silica with full characterizations. The material was developed for the preconcentration of Cr3+, Ni2+, Cu2+, Cd2+, and Pb2+ ions in water samples and determination using inductively coupled plasma mass spectrometry (ICP-MS). In this procedure, the metal ions were first complexed with 1-(2-pyridylazo)-2-naphthol (PAN) in the water; the complexed metals were absorbed on the sorbent via electrostatic interaction. The present method, which was proved to be rapid, efficient, and convenient in sample preparation, coud be potentially applied to separate and enrich trace amounts of Cr3+, Ni2+, Cu2+, Cd2+, and Pb2+ ions from water samples.
2. Experimental section
2.1. Chemical and instrumentation
Silica gel 230–400 mesh (37–63 μm) was purchased from Himedia (India). Imidazole (≥99%), 1-bromooctane (≥97%), 1-bromooctandecane (≥97%), 1-methylmidazole (≥99%), (3-chloropropyl)triethoxysilane (≥95%), sodium hydroxide (>85%), sodium chloride (≥99%), polyethylene glycol tert-octylphenyl ether (Triton X-100) were purchased from Sigma-Aldrich.Stock standard solutions (1000 mg L−1 in HNO3 0.5 mol L−1) of Pb2+, Cd2+, Cu2+, Ni2+, Cr3+ with were obtained from Merck. Working standard solutions were prepared by proper dilutions of stock standard solutions. 1-(2-Pyridylazo)-2-naphthol (PAN), sulfuric acid (≥97.5%), hydrochloric acid (37% in H2O), nitric acid (70% in H2O), ethanol (anhydrous, ≥ 99%), acetonitrile (anhydrous, ≥ 99.8%), toluene (anhydrous, ≥ 99%), methanol (anhydrous, ≥ 99%) were obtained from Merck. Deionized water was prepared by a Milli-Q system.
The reactions in this experiment were conducted on an IKA C-MAG HS7 magnetic stirrer. FT-IR spectra were recorded on a Bruker E400 spectrometer using potassium bromide pellets. Adjustment of pH was performed with Mettler–Toledo pH InLab©Expert Pro–ISM electrode. TGA was measured on a TA Q500 thermal analysis system with a temperature ramp of 5 °C min−1 under airflow. The morphology of materials was observed on XZS – 107T digital microscope coupling with NHV – CAM using eScope software and Hitachi S-4800 scanning electron microscope (SEM). The N2 isotherm measurements were carried out at 77 K on Quantachrome NOVA 3200e system. Energy-dispersive X-ray spectroscopy (EDX) analysis was recorded using an EMAX energy EX-400 EDX device to determine the element contents of sorbents. The concentrations of heavy metal ions were determined by inductively coupled plasma mass spectrometry (Agilent ICP-MS 7700x instrument).
2.2. Synthetic procedure of ionic liquid-grafted silica gel SiO2–(CH2)3–Im–C18
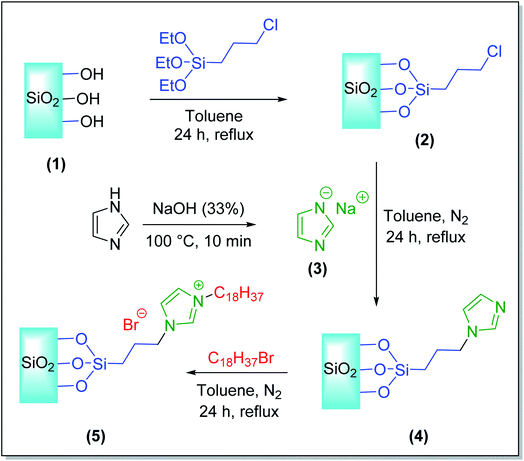
The silica-supported ionic liquids SiO2–(CH2)3–Im–C18 was synthesized via a four-step procedure presented in Scheme 1 as follows:![[thin space (1/6-em)]](https://www.rsc.org/images/entities/char_2009.gif) :
:![[thin space (1/6-em)]](https://www.rsc.org/images/entities/char_2009.gif) 1, w/w) was refluxed at 80 °C for 4 h to activate the silica gel surface and eliminate metal oxide. After washing with distilled water, the activated silica gel was recovered by filtration and washed with distilled water until reached pH 7.0 and dried at 120 °C for 24 h.
1, w/w) was refluxed at 80 °C for 4 h to activate the silica gel surface and eliminate metal oxide. After washing with distilled water, the activated silica gel was recovered by filtration and washed with distilled water until reached pH 7.0 and dried at 120 °C for 24 h.2.3. Preparation of column
0.2 g of the silica-supported ionic liquid material (SiO2–(CH2)3–Im–C18) was added to empty cartridges (6.0 cm length, 0.9 cm internal diameter). Frit was plugged at the ends of cartridges to keep the sorbent inside the tube (please see Fig. S1 in ESI†). Before its application, the SPE column was cleaned and conditioned by passing with 1 mol L−1 HNO3 in methanol solution (10 mL) followed by deionized water (10 mL).2.4. General procedure for solid-phase extraction
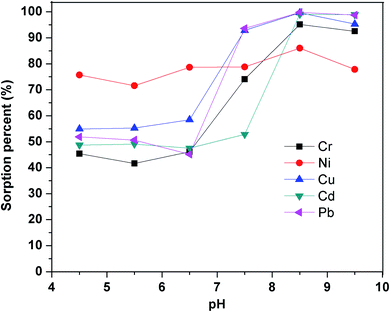
From 1000 mg L−1 stock solutions of 5 metal ions (Pb2+, Cd2+, Cu2+, Ni2+, Cr3+), the working standard mixture containing 50 μg L−1 each was freshly prepared by successive dilutions. The SiO2–(CH2)3–Im–C18 cartridge was first cleaned, preconditioned with 10 mL of HNO3 in methanol (1 M) and 10 mL of deionized water. Standard solution (50 mL) containing metal ions (50 μg L−1) and PAN was adjusted to pH 8.5 using buffer solution and loaded on the conditioned column at a flow rate of 0.8 mL min−1. Subsequently, the metal complexes were eluted from the column using 1 mL HNO3 in ethanol (1 M), filtered through a syringe filter 0.45 μm, and determined by ICP-MS. A blank solution was also subjected to the same procedure without adding any standard solutions and used as a control.3. Results and discussion
3.1. Characterization of silica-supported ionic liquids SiO2–(CH2)3–Im–C18
The ionic liquid immobilized onto silica was synthesized according to the detailed procedure as described in the experimental section (Scheme 1). The structural and morphological properties of the product were confirmed by FTIR, TGA, SEM, EDX, and BET. The chemical immobilization of ILs onto silica was formed through Si–O–Si bridges. The FT-IR spectrum of compound (2) had been described by Adam and coworkers.45 The absorption peaks of the silica shell in the sorbent around 1054 cm−1 and 797 cm−1 were attributed to the antisymmetric and symmetric signals of Si–O–Si bond. Moreover, the band at 1631 cm−1 was also attributed to the Si–OH group. Besides, the alkyl group was also confirmed by absorption peak of the C–H bond at 2923 cm−1 (Fig. 1b) and the weak peak in the region of 800–630 cm−1 could be assigned to C–Cl stretching.45 The synthesis of compound (4) through the alkylation of compound (2) with sodium imidazolide (3) was carried out by a similar procedure reported by Amarasekara et al.46 and Kotadia et al.47 The peak at 1667 cm−1 and 3016 cm−1 was observed, which was caused by vibration of the imidazole ring (Fig. 1c).46,47 Based on the result of Fig. 1d, it could be seen that two sharp peaks of at 2917–2849 cm−1 and one peak at 1465 cm−1 were observed, corresponding to the C–H stretch of the added hydrocarbon chain. Similar signals of FTIR spectrum of C18-alkyl chain grafted onto multiwalled carbon nanotubes was reported by Li and Greennberg.48 The above data indicated that the long-chain C18-alkyl imidazolium ionic liquid was successfully immobilized on activated silica gel.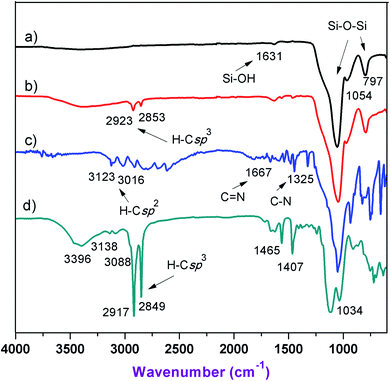 | ||
| Fig. 1 FT-IR spectra of (a) SiO2 (1), (b) SiO2–(CH2)3–Cl (2), (c) SiO2–(CH2)3–Im (4), (d) SiO2–(CH2)3–Im–C18 (5). | ||
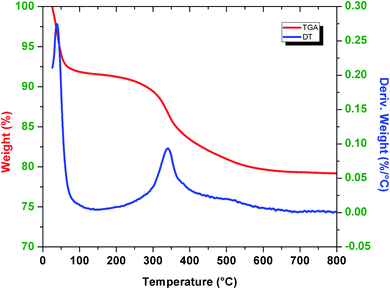
The stability and the mass of ionic liquid coating on the surface of the active silica gel were determined by the thermal gravimetric analysis method (Fig. 2). The measurement was carried out in the 25−800 °C temperature range, with a heating rate of 5 °C min−1 under an air atmosphere. SiO2–(CH2)3–Im–C18 showed a slight decrease in weight (∼7.5%) below 100 °C, attributed to the evaporation of the solvent and H2O residues. The sharp decrease in weight (∼13%) from 200 to 600 °C was attributed to an organic compound corresponding to the ionic liquid. The data of TGA of SiO2–(CH2)3–Im–C18 could be compared with the similar ionic liquid grafted onto silica reported by Amarasekara and Owereh.46 The thermal gravimetric analysis indicated the successful synthesis of ionic liquid-grafted silica gel.
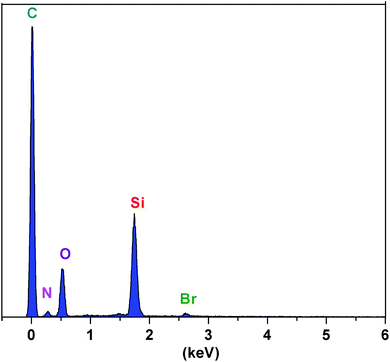
The elemental content of the ionic liquid-functionalized silica gel surface was evaluated by energy-dispersive X-ray spectroscopy (EDX). The EDX diagram confirmed the presence of carbon, nitrogen, oxygen, silicon, and bromine elements in the structure of this sorbent, indicating the successful coating of ionic liquids onto the silica gel surface (Fig. 3).
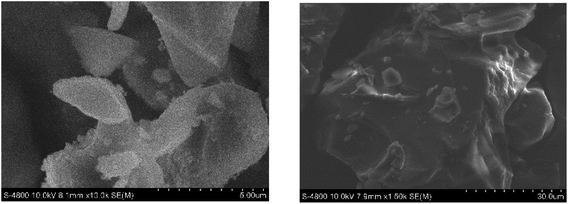
As depicted in Fig. 4, the morphology of the ionic liquid-immobilized silica gel was studied using SEM characterization. The as-prepared SiO2–(CH2)3–Im–C18 had not a regular sphere morphology but a very sharp-cut and rough surface. The results suggested that the ionic liquid immobilized onto silica affected the morphology of the silica. The SEM image of SiO2–(CH2)3–Im–C18 revealed that the material was obtained in micrometer-sized particles and indicated further evidence for the successful preparation of SiO2–(CH2)3–Im–C18.
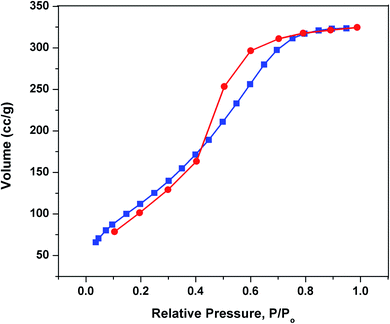
Based on the N2 sorption isotherm at 77 k, the BET-specific surface area of SiO2–(CH2)3–Im–C18 sorbent was 330 m2 g−1 with average half pore width of 18 Å. As seen in Fig. 5, the imobilization of ionic liquid on silica decreased the surface area of the original silica gel (450 m2 g−1). Moreover, the half pore width and pore volume of silica-supported ionic liquids were lower than bare silica gel (Table 1). The results suggested that the ionic liquid immobilized onto silica gel was successfully prepared.
| Material | Specific surface area (m2 g−1) | Half pore width (Å) | Pore volume (cm3 g−1) |
|---|---|---|---|
| Silica gel | 450 | 26 | 0.750 |
| SiO2–(CH2)3–Im–C18 | 330 | 18 | 0.469 |
3.2. Optimization of analytical conditions
| Analyte | LOD (μg L−1) | LOQ (μg L−1) | RSD (%) |
|---|---|---|---|
| Cr | 0.724 | 2.173 | 1.133 |
| Ni | 11.329 | 33.988 | 1.142 |
| Cu | 4.571 | 13.711 | 1.351 |
| Cd | 0.112 | 0.335 | 0.941 |
| Pb | 0.819 | 2.459 | 1.195 |
| Ion | Added salt | Ratio [coexisting ion]/[metal ion] | Recovery (%) | ||||
|---|---|---|---|---|---|---|---|
| Cr | Ni | Cu | Cd | Pb | |||
| Na+ | Na2CO3 | 500 | 67.7 | 97.0 | 103.3 | 98.8 | 65.0 |
| K+ | KCl | 500 | 54.7 | 75.8 | 78.0 | 73.3 | 58.5 |
| Ca2+ | CaCl2 | 500 | 58.1 | 71.5 | 73.4 | 100.2 | 65.5 |
| Mg2+ | MgSO4 | 500 | 81.5 | 96.6 | 99.6 | 93.6 | 68.9 |
| Cl− | KCl | 450 | 54.7 | 75.8 | 78.0 | 73.3 | 58.5 |
| SO42− | MgSO4 | 2000 | 81.5 | 96.6 | 99.6 | 93.6 | 68.9 |
| CO32− | Na2CO3 | 650 | 67.7 | 97.0 | 103.3 | 98.8 | 65.0 |
| Sorbent | Element | Enrichment factor | LOD (μg L−1) | RSD (%) |
|---|---|---|---|---|
| Polyethylene glycol loaded on silica gel (SiO2@PEG)54 | Cu(II), Cd(II), Mn(II) | 66.6 | 0.33–1.20 | 3.42–4.91 |
| Dithioxamide onto activated carbon (AC@DTO)55 | Ni(II), Co(II), Cu(II) | 330 | 0.5–0.8 | <2 |
| 1-(2-Pyridylazo)-2-naphthol loaded on silica gel (SiO2@PAN)56 | Cr(III), Mn(II), Fe(III), Ni(II), Cu(II), Cd(II), Pb(II) | 80–150 | 0.13–4.1 | 5–26 |
| Thiosalicylic acid loaded on silica gel57 | Pb(II) | 150 | 3.7 | <1.5 |
| Dihydroxybenzene loaded on silica gel58 | Cu(II), Pb(II), Fe(III), Zn(II), Co(II), Ni(II), Cd(II) | 250 | 4 | 1.4–7.0 |
| Amberlite XAD-2010 resin59 | Mn(II), Co(II), Ni(II), Cu(II), Cd(II), Pb(II) | 100 | 0.08–0.26 | 1.9–5.1 |
| This work: (SiO2–(CH2)3– Im– C18) | Cr(III), Ni(II), Cu(II), Cd(II), Pb(II) | 60–150 | 0.724–11.329 | 0.941–1.351 |
4. Conclusions
An efficient procedure for the synthesis of a new N-octyldecylimidazolium ionic liquid-immobilized silica sorbent was developed. The characterization of ionic liquid-immobilized silica sorbent was carried out by FTIR, SEM, TGA, BET, and EDX. The as-synthesized ionic liquid-immobilized silica sorbent exhibits effective extraction with good enrichment factor for the Cr3+, Ni2+, Cu2+, Cd2+, and Pb2+, making the sorbent very suitable for SPE of trace heavy metals in the water sample. This research proved that the porous silica material has been used as support in the preparation of sorbents due to their large specific surface areas and the ease of surface modification. The IL-grafted silica has showed the efficient sorbent towards metal-PAN complexes in the SPE technique. The results demonstrated that the method could be effectively used as an alternative method for the simultaneous determination of heavy metal ions in water samples.Author contributions
The Thai Nguyen, Tu-Hoai Duy Nguyen, Tam Thanh Thi Huynh: conceptualization, methodology, data curation, formal analysis, validation. Minh-Huy Dinh Dang, Thuy-Linh Ho Nguyen, Tan Hoang Le Doan: material analysis, data curation, review editing. Thinh Phuc Nguyen, Mai Anh Nguyen: supervision, review, and editing. Phuong Hoang Tran: conceptualization, supervision, writing, review, and editing.Conflicts of interest
The authors have no conflicts to declare.Acknowledgements
We are grateful to the Ho Chi Minh Department of Science and Technology (grant no. 102/2020/HĐ-QPTKHCN) for financial support.References
- Y.-K. Li, T. Yang, M.-L. Chen and J.-H. Wang, Crit. Rev. Anal. Chem., 2021, 51, 353–372 CrossRef CAS PubMed.
- S. Bolisetty, M. Peydayesh and R. Mezzenga, Chem. Soc. Rev., 2019, 48, 463–487 RSC.
- F. Lu and D. Astruc, Coord. Chem. Rev., 2018, 356, 147–164 CrossRef CAS.
- C. Mohod and J. Dhote, Int. J. Innov. Res. Sci. Eng., 2013, 2, 2992–2996 Search PubMed.
- M. L. Sall, A. K. D. Diaw, D. Gningue-Sall, S. Efremova Aaron and J.-J. Aaron, Environ. Sci. Pollut. Res., 2020, 27, 29927–29942 CrossRef CAS PubMed.
- X. Dong, X. Gao, J. Song and L. Zhao, Food Chem., 2021, 360, 130023 CrossRef CAS PubMed.
- L. N. Sibal and M. P. B. Espino, Int. J. Environ. Anal. Chem., 2018, 98, 536–554 CrossRef CAS.
- C. Liu, Q. Wang, F. Jia and S. Song, J. Mol. Liq., 2019, 292, 111390 CrossRef CAS.
- T. Liu and J. Chen, Sep. Purif. Technol., 2021, 276, 119263 CrossRef CAS.
- Y. A. Zolotov, N. M. Kuz'min, O. M. Petrukhin and B. Y. Spivakov, Anal. Chim. Acta, 1986, 180, 137–161 CrossRef CAS.
- B. Buszewski and M. Szultka, Crit. Rev. Anal. Chem., 2012, 42, 198–213 CrossRef CAS.
- S. Büyüktiryaki, R. Keçili and C. M. Hussain, TrAC, Trends Anal. Chem., 2020, 127, 115893 CrossRef.
- B. Hashemi and S. Rezania, Microchim. Acta, 2019, 186, 578 CrossRef CAS.
- A. Andrade-Eiroa, M. Canle, V. Leroy-Cancellieri and V. Cerdà, Trends Anal. Chem., 2016, 80, 655–667 CrossRef CAS.
- B.-L. Su, X.-C. Ma, F. Xu, L.-H. Chen, Z.-Y. Fu, N. Moniotte, S. B. Maamar, R. Lamartine and F. Vocanson, J. Colloid Interface Sci., 2011, 360, 86–92 CrossRef CAS PubMed.
- F. Aydin, R. Çakmak, A. Levent and M. Soylak, Appl. Organomet. Chem., 2020, 34, e5481 CrossRef CAS.
- Y. Uppa, T. Taweetanavanich, C. Kaewtong and N. Niamsa, Environ. Technol., 2021, 42, 1252–1259 CrossRef CAS.
- H. Ahmad and C. Liu, J. Hazard. Mater., 2021, 415, 125661 CrossRef CAS PubMed.
- M. Babaei, P. A. Azar, M. S. Tehrani, M. Farjaminezhad and S. W. Hussain, J. Nanostruct. Chem., 2022, 12, 249–261 CrossRef CAS.
- Y. Sun, Y. Gu and Q. Zha, Chemosphere, 2021, 280, 130611 CrossRef CAS.
- S. Jakavula, N. R. Biata, K. M. Dimpe, V. E. Pakade and P. N. Nomngongo, J. Hazard. Mater., 2021, 416, 126175 CrossRef CAS PubMed.
- M. Hemmati, M. Rajabi and A. Asghari, Microchim. Acta, 2018, 185, 160 CrossRef.
- A. Stafiej and K. Pyrzynska, Microchem. J., 2008, 89, 29–33 CrossRef CAS.
- A. A. Gouda and S. M. Al Ghannam, Food Chem., 2016, 202, 409–416 CrossRef CAS PubMed.
- A. Rohanifar, L. B. Rodriguez, A. M. Devasurendra, N. Alipourasiabi, J. L. Anderson and J. R. Kirchhoff, Talanta, 2018, 188, 570–577 CrossRef CAS.
- T. Wang, Y. Chen, J. Ma, Z. Jin, M. Chai, X. Xiao, L. Zhang and Y. Zhang, Talanta, 2018, 180, 254–259 CrossRef CAS.
- F. Bucatariu, C.-A. Ghiorghita, M.-M. Zaharia, S. Schwarz, F. Simon and M. Mihai, ACS Appl. Mater. Interfaces, 2020, 12, 37585–37596 CrossRef CAS PubMed.
- L. Huang, W. Huang, R. Shen and Q. Shuai, Food Chem., 2020, 330, 127212 CrossRef CAS.
- M. Feng, P. Zhang, H.-C. Zhou and V. K. Sharma, Chemosphere, 2018, 209, 783–800 CrossRef CAS PubMed.
- X. Li, W. Ma, H. Li, Q. Zhang and H. Liu, Coord. Chem. Rev., 2020, 408, 213191 CrossRef CAS.
- N. Fontanals, F. Borrull and R. M. Marcé, Trends Anal. Chem., 2012, 41, 15–26 CrossRef CAS.
- H. Niedermeyer, J. P. Hallett, I. J. Villar-Garcia, P. A. Hunt and T. Welton, Chem. Soc. Rev., 2012, 41, 7780–7802 RSC.
- T. D. Ho, A. J. Canestraro and J. L. Anderson, Anal. Chim. Acta, 2011, 695, 18–43 CrossRef CAS PubMed.
- M. Llaver, M. N. Oviedo, E. F. Fiorentini, P. Y. Quintas and R. G. Wuilloud, Trends Environ. Anal. Chem., 2021, 31, e00131 CrossRef CAS.
- M. Khraisheh, F. AlMomani, M. Inamdar, M. K. Hassan and M. A. Al-Ghouti, J. Mol. Liq., 2021, 337, 116421 CrossRef CAS.
- J. Nawała, B. Dawidziuk, D. Dziedzic, D. Gordon and S. Popiel, TrAC, Trends Anal. Chem., 2018, 105, 18–36 CrossRef.
- M. Sajid, M. K. Nazal and I. Ihsanullah, Anal. Chim. Acta, 2021, 1141, 246–262 CrossRef CAS PubMed.
- L. Vidal, M.-L. Riekkola and A. Canals, Anal. Chim. Acta, 2012, 715, 19–41 CrossRef CAS PubMed.
- S. Platzer, M. Kar, R. Leyma, S. Chib, A. Roller, F. Jirsa, R. Krachler, D. R. MacFarlane, W. Kandioller and B. K. Keppler, J. Hazard. Mater., 2017, 324, 241–249 CrossRef CAS PubMed.
- L. Zhu, L. Guo, Z. Zhang, J. Chen and S. Zhang, Sci. China: Chem., 2012, 55, 1479–1487 CrossRef CAS.
- M. Gharehbaghi and F. Shemirani, Anal. Methods, 2012, 4, 2879 RSC.
- M. Ghaedi, D. Elhamifar, G. Negintaji and M. H. Banakar, Int. J. Environ. Anal. Chem., 2013, 93, 1525–1536 CrossRef CAS.
- S. Sadeghi and A. Z. Moghaddam, Anal. Methods, 2014, 6, 4867 RSC.
- H. M. Marwani, J. Dispersion Sci. Technol., 2013, 34, 117–124 CrossRef CAS.
- F. Adam, H. Osman and K. M. Hello, J. Colloid Interface Sci., 2009, 331, 143–147 CrossRef CAS PubMed.
- A. S. Amarasekara and O. S. Owereh, Catal. Commun., 2010, 11, 1072–1075 CrossRef CAS.
- D. A. Kotadia and S. S. Soni, J. Mol. Catal. A: Chem., 2012, 353–354, 44–49 CrossRef CAS.
- J. Li and H. Grennberg, Chem. - Eur. J., 2006, 12, 3869–3875 CrossRef CAS PubMed.
- J. Gao, G. Hu, J. Kang and G. Bai, Talanta, 1993, 40, 195–200 CrossRef CAS PubMed.
- H. R. Fouladian and M. Behbahani, Food Anal. Methods, 2014, 8, 982–993 CrossRef.
- Z. A. Alothman, E. Yilmaz, M. Habila and M. Soylak, Ecotoxicol. Environ. Saf., 2015, 112, 74–79 CrossRef CAS PubMed.
- M. Khan, E. Yilmaz and M. Soylak, J. Mol. Liq., 2016, 224, 639–647 CrossRef CAS.
- O. Ozalp and M. Soylak, Iran. J. Sci. Technol. Trans. A: Sci., 2021, 45, 1971–1980 CrossRef.
- N. Pourreza, R. Mirzajani, A. Reza Kiasat and R. Abdollahzadeh, Quim. Nova, 2012, 35, 1945–1949 CrossRef CAS.
- M. Ghaedi, F. Ahmadi and M. Soylak, J. Hazard. Mater., 2007, 147, 226–231 CrossRef CAS PubMed.
- S. Tokalioglu, H. Büyükbas and S. Kartal, J. Braz. Chem. Soc., 2006, 17, 98–106 CrossRef CAS.
- C. E. Dogan and G. Akcin, Anal. Lett., 2007, 40, 2524–2543 CrossRef CAS.
- G. Venkatesh, A. K. Singh and B. Venkataramani, Microchim. Acta, 2004, 144, 233–241 CrossRef CAS.
- C. Duran, A. Gundogdu, V. N. Bulut, M. Soylak, L. Elci, H. B. Sentürk and M. Tüfekci, J. Hazard. Mater., 2007, 146, 347–355 CrossRef CAS.
Footnote |
| † Electronic supplementary information (ESI) available. See https://doi.org/10.1039/d2ra02980d |
| This journal is © The Royal Society of Chemistry 2022 |

