
 Open Access Article
 This Open Access Article is licensed under a Creative Commons Attribution-Non Commercial 3.0 Unported Licence
Influence of ITO electrode on the electrochromic performance outcomes of viologen-functionalized polyhedral oligomeric silsesquioxanes†
Gaurav K. Pande,
Fayong Sun,
Do Yeon Kim,
Joo Hee Eom and
Jong S. Park *
*
School of Chemical Engineering, Department of Organic Material Science and Engineering, Pusan National University, Busan 46241, Republic of Korea. E-mail: jongpark@pusan.ac.kr
First published on 26th April 2022
Abstract
Electrochromic devices (ECDs) exhibit reversible optical changes under applied electrical stimuli. Transparent conducting electrodes (TCOs), generally constructed with indium tin oxide (ITO), are a vital component determining transparency and switching behaviors. ITO specifications for TCO materials have not drawn much attention despite the critical role of these materials. Herein we investigate the influence of ITO electrodes in achieving high-performance ECDs containing viologen-functionalized polyhedral oligomeric silsesquioxane (POSS-viologen). Indeed, ITO electrodes exert significant effects on the electrochromic characteristics. A high ITO thickness shows superior color-switching with high optical density and coloration efficiency levels. Enhanced electrical conductivity facilitates diffusion behaviors, an outcome beneficial for electrochromic switching. The surface-charge capacity ratio values are measured and found to be close to one, indicating that no residual current remains, and the prepared devices provide good reversibility during the coloring and bleaching process. Furthermore, with an increase in the ITO thickness, the current required for the coloring and bleaching processes decreases, and the power consumption needed for the operation of the device becomes low. The superiority of POSS-viologen should also be noted, especially when compared to normal viologens, in terms of the electrochromic properties and long-term operational stability. These results demonstrate the critical role of electrical conductivity in ITO electrodes, providing a valuable guideline for TCO specifications for ECD fabrication using viologen derivatives.
1. Introduction
Given the increased demand for information-providing devices, electrochromic devices (ECDs) have been developed as a promising candidate to fulfil such requests due to their low-voltage operation, simple fabrication process, and user-controllable properties.1–3 ECDs can be intelligent windows to protect privacy while blocking harmful ultra-violet radiation.4 Applications have recently been extended to antiglare mirrors, camouflage, and e-paper displays in the industrial market.5 When incorporated into architectural windows, ECDs deliver user-oriented information efficiently while eliminating the need for curtains and blinds to reduce indoor lighting and air conditioning loads. ECDs are electrochemical cells in which the optical properties of redox materials change reversibly under suitable electrical stimuli.6 The corresponding absorption bands are identified as color changes from transparent to colored states.7,8 A wide variety of electrochromic materials have been developed, some of which are conjugated polymers,9 metal oxides,10 and viologens.11 Viologens are popular cathodic materials that undergo a reduction when bias is applied. Various derivatives have been studied in-depth due to their desirable electron-accepting capabilities, stable redox states, and bias tunability of their nitrogen substituents.12 However, viologens have critical drawbacks that prevent their practical applications, such as low coloration efficiency, slow switching speeds, and poor long-term stability.13Transparent conducting electrodes (TCOs) are another vital component determining transparency and switching behaviors when constructing ECDs.14,15 Indium tin oxide (ITO) has been widely adopted as a TCO material due to its low visible contrast and high electrical conductivity, finding use in many applications in optoelectronics, sensors, and solar cells.16,17 However, the effects of the oxide network and surface roughness on the resulting optical contrast have not been studied often.18,19 ITO degrades under repeated anodic or cathodic polarization, slowly deteriorating redox performance capabilities.20,21 Numerous approaches have been presented to improve the electrochromic performances of viologen-based ECDs. Most reports emphasize the composition of the active layer and how it induces the charge transfer and coloration/bleaching process.22,23 Despite the crucial impacts of TCOs when in direct contact with the active layer, not much attention has been directed toward the specifications of ITO electrodes in viologen-based ECDs.
Our previous reports demonstrated that electron-donating/withdrawing substituents, counter anions, asymmetric structures, and nanofiber structures improved electrochromic transitions.24–27 Furthermore, viologen-functionalized polyhedral oligomeric silsesquioxane (POSS-viologen) demonstrated outstanding electrochromic performance capabilities.28,29 The superb electrochromic performances were attributed to the structural rigidity of the POSS fillers and the synthetic versatility of the viologen compounds.
Motivated by previous works, in the current study, we investigate the influence of ITO electrodes in achieving high-performance ECDs containing a POSS-viologen. ITO-coated glass specimens of three different thicknesses were adopted for the electrodes, and single-layered ECDs were prepared using an ion gel composition. The effects of the ITO electrodes on the electrochromic characteristics were examined by estimating the surface charge capacity, operating voltage, diffusion coefficients, power consumption, and coloration/bleaching times. In doing so, the critical role of electrical conductivity in the electrodes and the superiority of the POSS-viologens were verified, especially when compared to normal viologens, in terms of the electrochromic transitions and long-term operational stability.
2. Experimental
2.1. Materials
Poly(vinylidene fluoride-co-hexafluoropropylene) (PVDF-HFP), 1-butyl-3-methylimidazolium tetrafluoroborate ([BMIM][BF4]), and 1-bromohexane were purchased from Sigma Aldrich and were used as received. (3-Chloropropyl)trimethoxysilane, 4,4′-bipyridine, ferrocene (Fc), and ammonium hexafluorophosphate (NH4PF6) were purchased from Alfa Aesar. Dimethylformamide, acetonitrile, methanol, acetone, and diethyl ether were obtained commercially and used without further purification. Indium tin oxide (ITO) coated glass specimens with thicknesses of 68.5 nm, 140.3 nm, and 252.1 nm were purchased from Wooyang GMS (Korea). Before use, the ITO-coated glasses were cleaned successively with deionized water, acetone, and isopropyl alcohol under sonication.2.2. Synthesis
Octa-hexyl viologen-substituted polyhedral oligomeric silsesquioxane, [OHV-POSS][Br]8[Cl]8, was synthesized according to a procedure in the literature.24 The anion-exchanged species, [OHV-POSS][PF6]16, was obtained after a reaction with NH4PF6 in methanol and was employed as the electrochromic species for the ion gel preparation process. Di-hexyl viologen, [DHV][PF6]2, was similarly synthesized for comparison purposes.282.3. Property characterizations
The surface roughness (Ra) and morphology were evaluated using an atomic force microscope (NX10, Park systems) and a scanning electron microscope (FE-SEM, Zeiss SUPRA25), respectively. The electrical conductivity values of the ITO-coated glass slides were evaluated using a four-point probe system (M4P302 and Source Meter, MS-TECH, Keithley). The thickness of the ITO film was confirmed using a KLA instrument (Tencor, D-500). The electrochromic properties were measured in single-layered solid-state ECDs. The ion gel solution was prepared by mixing [OHV-POSS][PF6]16 (300 mg) as an electroactive species, methyl-ferrocene (10 mg) as an anodic species, PVDF-HFP (400 mg) as a polymer matrix, and [BMIM][BF4] (1600 mg) as a room-temperature ionic liquid, in acetone. The solution was stirred at 50 °C for 24 h to form a homogeneous ion gel. The ion gel was coated onto the ITO-coated glass slides by a drop-casting method with a working area of 4 × 5 cm2. Then, Surlyn@ film with a thickness of 60 nm was applied. The deposited ion gel was kept at 70 °C for 1 h to remove the acetone, and the formed film was sandwiched using another ITO-coated glass slide, followed by sealing with epoxy resin. By the same procedures, a single-layered ECD with [DHV][PF6]2 was prepared.Optical and spectroelectrochemical measurements were taken using a UV-1800 UV-vis spectrophotometer (Shimadzu). The electrochemical and spectroelectrochemical properties were measured in a two-electrode system using an SP-150 potentiostat (Biologic). The kinetic stability was estimated by applying constant potential stepping with a potentiostat and monitoring the corresponding transmittance changes with a UV-vis spectrophotometer. The transmittance difference (ΔT), the change in the optical density (ΔOD), and the coloration efficiency (CE) were calculated using the following relationships:30 ΔT = Tmax − Tmin, 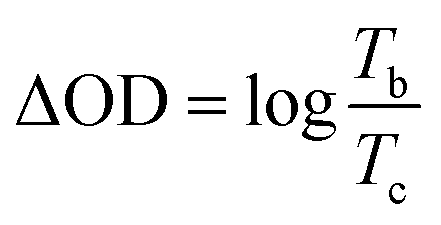 , and
, and 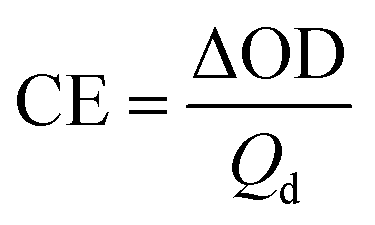 , respectively, where Tb and Tc correspondingly represent the bleached and colored transmittance values, and Qd denotes the injected charge per unit area.
For ionic conductivity measurement, cells were fabricated by placing the prepared ion gel solution on an ITO-coated glass with a long groove width of 100 μm and then sandwiching it with a cover glass using a Surlyn film spacer. The Nyquist impedance graphs were obtained by plotting Re(Z)/Ohm vs. Im(Z)/Ohm, from which the ionic conductivity was calculated according to the Nyquist equation.31
3. Results and discussion
The surface morphology of ITO-coated glass slides of different ITO thicknesses was examined by scanning electron microscopy (SEM) measurements (Fig. 1a–c). The SEM images showed a smooth surface consisting of a network of high-porosity interconnected nanoparticles, which may improve ionic mobility and charge transfer.32,33 The surface roughness of the ITO glass specimens was determined by an atomic force microscopy (AFM) analysis (Fig. 1d–f). The AFM images revealed an island-like surface structure, which became smaller with an increase in the ITO thickness. The glass substrates with ITO thicknesses of 68.5, 140.3, and 252.1 nm showed surface roughness (Ra) values of 10.1, 6.40, and 6.18 nm, respectively. It should be noted that the sheet resistance decreased monotonically with an increase in the ITO thickness (Table 1). With the increase of ITO thickness, the surface roughness of glass decreased, which helped to provide more electrical conductivity and lower the sheet resistance. | ||
| Fig. 1 SEM images of the ITO films having thicknesses of (a) 68.5 nm (ITO-I), (b) 140.3 nm (ITO-II), and (c) 252.1 nm (ITO-III). The corresponding AFM images are shown in (d)–(f). | ||
| ITO glass | ITO coating thickness (nm) | Sheet resistance (Ω □−1) | Surface roughness (Ra) |
|---|---|---|---|
| ITO-I | 68.5 | 26.8 | 10.1 |
| ITO-II | 140.3 | 11.9 | 6.40 |
| ITO-III | 252.1 | 7.27 | 6.18 |
Before evaluating the effects of the ITO electrodes, the ionic conductivity values of ion gel compositions made up of [OHV-POSS] [PF6]16 were estimated and compared with those of [DHV][PF6]2 (Table S1, ESI†). The electrochemical impedance spectroscopy (EIS) results found ionic conductivity values of 6.24 × 10⁻³ S cm−1 and 3.63 × 10⁻³ S cm−1 for OHV-POSS and DHV, respectively (Fig. S1, ESI†). Higher ionic conductivity of OHV-POSS was observed because POSS acts as a nano-building block, facilitating the ion-transport ability of ionic liquids and leading to a significant increase in the ionic conductivity.34,35
The effect of the ITO thickness on the electrochemical was examined by obtaining cyclic voltammetry (CV) curves with various scan rates (Fig. 2). The ECD containing the OHV-POSS-based ion gel (OHV-POSS ECD), fabricated with ITO-I, required relatively high voltage operation at −3.0 V (Fig. 2a). On the other hand, the OHV-POSS ECDs with ITO-II and ITO-III showed lower operation voltages of −2.3 V and −1.9 V, respectively (Fig. 2b and c). The observed difference is attributed to the surface resistance and electrical conductivity of the ITO electrodes. A thin ITO thickness in ITO-I led to the high sheet resistance of 26.8 Ω and a high Ra value of 10.1 nm. In comparison, the thicker ITO layers in ITO-II and ITO-III featured low sheet resistance values of 11.9 Ω □−1 and 7.27 Ω □−1, respectively, and smooth surfaces with low corresponding Ra values of 6.40 nm and 6.18 nm.
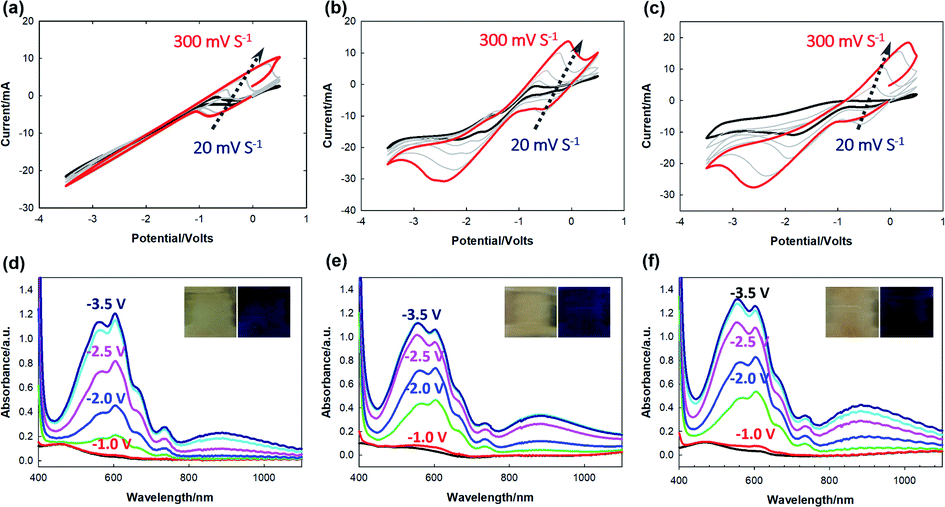 | ||
| Fig. 2 Cyclic voltammetry curves with different scan rates of 20, 50, 100, 200, and 300 mV s−1 for [OHV-POSS] [PF6]16-based ECDs with ITO thicknesses of (a) 68.5 nm, (b) 140.3 nm, and (c) 252.1 nm. The corresponding linear plots of Ipa and Ipc with the applied voltage are shown in the insets. Spectroelectrochemical curves obtained with different applied potentials for [OHV-POSS] [PF6]16 containing ion gel-based ECDs prepared using electrodes with ITO thicknesses of (d) 68.5 nm, (e) 140.3 nm, and (f) 252.1 nm. | ||
With an increase in the scan rate, both the anodic (Ipa) and cathodic (Ipc) peak currents increased, showing linear dependency on the square root of the scan rate. According to the Randle–Sevcik equation, this behavior corresponded to a typical one-electron transfer process, which is diffusion-controlled.36 From the above relationship, the diffusion coefficient values (D) depending on the ITO thickness were evaluated according to the following equation:37
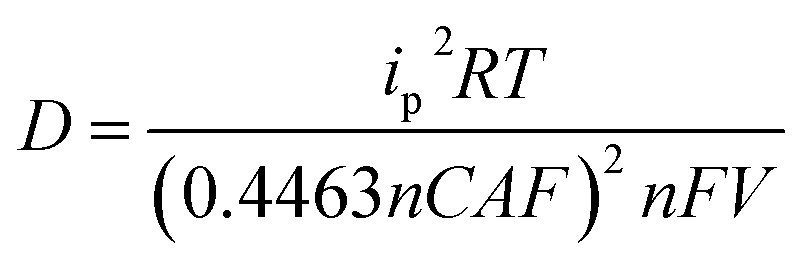
Here, n is the number of electrons, assumed here to be 1; ip is the peak current (A); D is the diffusion coefficient of the anion (cm2 S−1); A is the electrode area (cm2); C is the concentration of active ion (mol cm−3); V is the potential scan rate (V s−1), F is the Faraday constant (96![[thin space (1/6-em)]](https://www.rsc.org/images/entities/char_2009.gif) 485 C mol−1); R is the gas constant; T is the absolute temperature.
485 C mol−1); R is the gas constant; T is the absolute temperature.
For the sake of convenience, the peak current values at a scan rate of 200 mV were extracted from the CV curves (Fig. S2, ESI†). ITO electrodes heavily impacted the diffusion behaviors of the OHV-POSS ECDs. With an increase in the ITO thickness, D on the cathodic side increased. The OHV-POSS ECDs prepared with ITO-III exhibited the highest D values of 9.30 × 10⁻⁷ cm2 S−1 during the reduction process (Table 2). The current flow process features an electrode reaction and charge transport through the polymeric ion gel film in the single-layered device. Clearly, efficient charge diffusion processes are necessary for smooth charge transport. In this regard, high D values are preferred for electrochromic switching, as the diffusion coefficient mainly governs the mass transfer process for electro-neutralizing ions during the electrochemical exchange reaction.
| ITO glass | Cathodic current Ipc (A) | D from Ipc (cm2 S−1) |
|---|---|---|
| ITO-I | −2.04 × 10⁻² | 5.39 × 10⁻⁷ |
| ITO-II | −2.38 × 10⁻² | 7.31 × 10⁻⁷ |
| ITO-III | −2.68 × 10⁻² | 9.30 × 10⁻⁷ |
During the electrochromic switching redox process, charge transport is driven by an electron self-exchange reaction between adjacent redox sites. It is also dominated by charge diffusion based on the redox gradient produced under the electrolyte conditions. The steady-state redox gradient through the sandwiched electrochromic layer is maximized when the anode potential is more positive, and the cathode potential is more negative than E1/2 of the sandwiched layer.
The redox gradient provides the diffusion-limited current density Jlim obtained for the sandwiched device according to the following equation:39
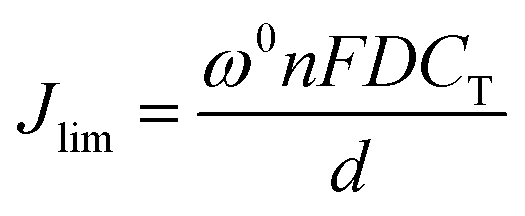
In this equation, CT is the concentration of the pendant redox sites, d is the film thickness, and ω0 is the correction factor for electrostatic coupling between electron and counter-ion motions. The diffusion coefficient D reflects the mass transfer process for the electro-neutralizing ions during the electrochemical exchange reaction in the layer. The observed Jlim for OHV-POSS ECDs prepared with ITO 252.1 nm (−26.89 mA cm−2) coincided with the theoretical value for these devices (−26.83 mA cm−2) (Fig. S3, ESI†).
The effects of the ITO thickness on kinetic behaviors were studied by applying alternating wave potentials between bleached and colored states (Fig. 3). During long-term stability measurements, the OHV-POSS ECDs with ITO-I exhibited a ΔT of 56.7% with an ΔOD of 0.575, producing a CE outcome of 149.4 cm2 C−1. The switching times required for the colored and bleached states were 12 s and 9 s, respectively (Fig. 3a and d). As the ITO thickness was increased to 140.3 nm and 252.1 nm, the ΔT increased to 62.3% and 75.5%, respectively, with corresponding CE values of 172.08 cm2 C−1 and 324.1 cm2 C−1 (Fig. 3b and c). The switching times required for the colored and bleached states were almost unchanged (Fig. 3e and f). Regardless of the ITO thickness, the OHV-POSS ECDs demonstrated excellent cyclic stability for >12000 s with no transmittance losses. Thicker ITO electrodes clearly exhibited better electrochromic performances, both in terms of optical density and coloration efficiency. These outcomes are attributed to the low sheet resistance.
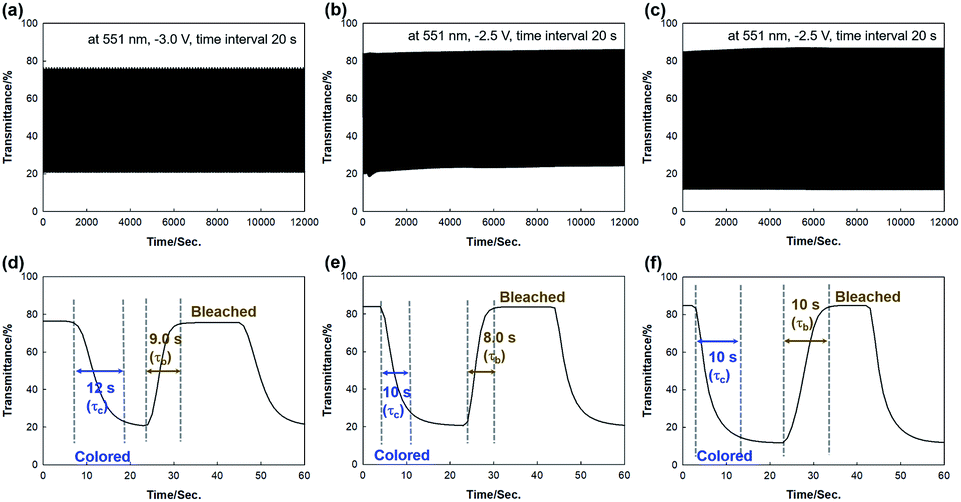 | ||
| Fig. 3 Kinetic stability for [OHV-POSS][PF6]16-based ECDs with ITO thicknesses of (a) 68.5 nm, (b) 140.3 nm, and (c) 252.1 nm during constant potential stepping between (coloration) and short-circuit (bleaching) conditions. The corresponding switching times required for coloration and bleaching of the ECDs are shown in (d)–(f). Resistance for faster electron movement. Moreover, it is also apparent that the OHV-POSS-based ion gel possessed high ionic conductivity, leading to a quicker charge transfer process. | ||
The electrochemical and kinetic behaviors of a normal viologen, [DHV][PF6]2, containing ECDs (DHV ECDs) with different ITO thicknesses were also examined for comparison. DHV ECDs began coloration to blue at −1.1 V with λmax at 605 nm (Fig. S4, ESI†). These samples showed slow coloring and bleaching processes with poor cyclic stability and low CE values (Fig. S5, ESI†). The obtained electrochromic properties are summarized and compared in Table 3.
| Electrochromic material | ITO glass | Transmittance differencea (%) | Optical density (OD) | Switching time to colored stateb (s) | Switching time to bleached statec (s) | Coloration efficiency |
|---|---|---|---|---|---|---|
| a The transmittance difference was calculated by the difference in maximum to minimum transmittance change (%).b Time required for percent transmittance changes from minimum to maximum.c Time required for percent transmittance changes from maximum to a minimum; applied voltage ranges from 0 to −3 V for all ECDs. | ||||||
| [OHV-POSS][PF6]16 | ITO-I | 56.7 | 0.575 | 12 | 9.0 | 149.4 |
| ITO-II | 62.3 | 0.561 | 10 | 8.0 | 172.1 | |
| ITO-III | 75.5 | 0.868 | 10 | 10 | 324.1 | |
| [DHV][PF6]2 | ITO-I | 4.41 | 0.751 | 20 | — | 14.47 |
| ITO-II | 19.4 | 0.364 | 20 | — | 26.30 | |
| ITO-III | 17.05 | 1.42 | 20 | — | 126.9 | |
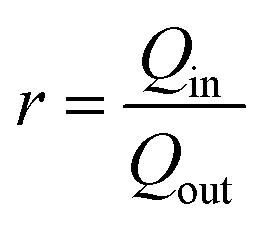
The effect of the ITO thickness on the surface charge capacity ratio (r) was estimated from the intercalation surface charge (Qin) and extraction surface charge (Qout) according to the following equation23 (Fig. 4a):
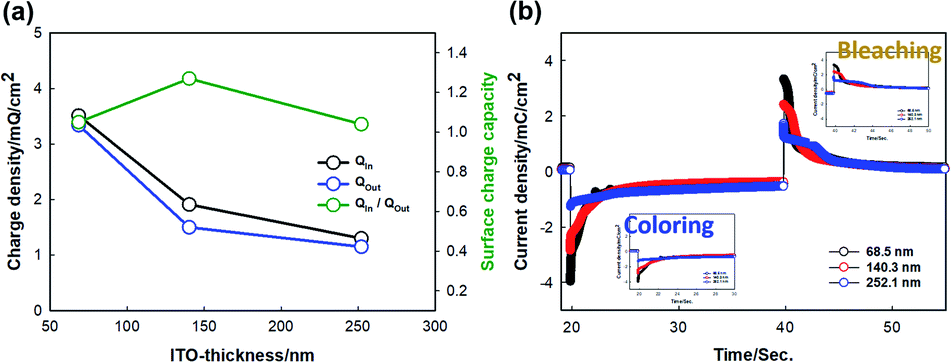 | ||
| Fig. 4 (a) ITO thickness-dependent surface capacity for [OHV-POSS][PF6]16-based ECDs as a function of Qin and Qout. (b) Current density response of [OHV-POSS][PF6]16-based ECDs with ITO thicknesses of 68.5 nm, 140.3 nm, and 252.1 nm. Corresponding current density responses for coloration and bleaching are shown in the inset. | ||
Here, r is defined upon the insertion of the surface charge divided by the extraction of surface charge. For the OHV-POSS ECDs fabricated with ITO thicknesses of 68.5 nm, 140.3 nm, and 252.1 nm, the corresponding intercalated charge densities (Qin) are −3.51, −1.91, and −1.30 mQ cm−2 and the extracted charge densities (Qout) are 3.34, 1.50, and 1.15 mQ cm−2. The calculated charge capacity ratio (r) values were estimated to be 1.05, 1.27, and 1.04, respectively. It should be noted that the r values are close to one, indicating that all devices exhibited good electrochemical reversibility during the coloring and bleaching process.
Fig. 4b shows the chronoamperometric results when applying bias (−2.5 V/+0.5 V). During intercalation with a coloring time from 20 to 30 s, the amounts of charge of the current density were −3.51, −1.91, and −1.30 mC cm−2. The corresponding charge amounts with deintercalation with bleaching times from 40 to 50 s were 3.34, 1.50, and 1.15 mC cm−2. These results indicate that with an increase in the ITO thickness, the current required for the coloring and bleaching processes is decreased.
The power consumption (P) for OHV-POSS ECD operation was calculated from the relationship of P = VJmean, where V is the applied voltage and Jmean is the average current density when voltage is applied to the device. Jmean is obtained from the relationship 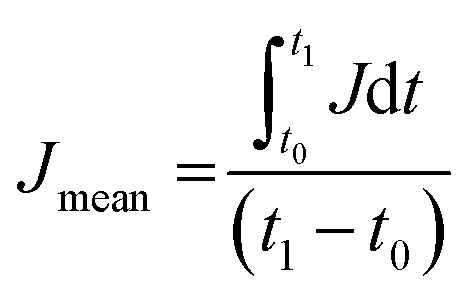 , where J is the current density during the ECD time of t0 to t1.11,38 The Jmean values of OHV-POSS-ECD with ITO-III at −2.5 V and +0.5 V were estimated to be −0.065 and 0.0575 mA cm−1, respectively. The corresponding power consumption outcomes were 162.5 μW cm−2 and 28.7 μW cm−2. On the other hand, the devices with ITO-I and ITO-II exhibited higher power consumption values; the calculated values are summarized in Table 4.
| ITO-thickness (nm) | Cathodic Jmean (mA cm−1) | Anodic Jmean (mA cm−1) | Applied voltage (V) | Power consumption (μW cm−2) | |
|---|---|---|---|---|---|
| Cathodic | Anodic | ||||
| 68.5 | 0.175 | 0.167 | −3.0/+0.5 | 525.0 | 83.5 |
| 140.3 | 0.0955 | 0.075 | −2.5/+0.5 | 238.7 | 37.5 |
| 252.1 | −0.0651 | 0.0575 | −2.5/+0.5 | 162.5 | 28.7 |
An instantaneous voltage drop may occur after switching on the current during ECD operation.40 This behavior is attributed to the internal cell resistance related to the electrode, electrolyte, and solid–solid and solid–liquid interfaces. In electrolytic media, a voltage drop often occurs due to current leakage without any chemical processes.41 Thus, the spontaneous voltage drop represents an energy loss, which should be avoided to ensure acceptable performance. Furthermore, the voltage drop at the beginning of the discharge process may cause the ECD to supply voltage exceeding that required by the external load, which is detrimental for the long-term operation. As a measure to evaluate the ITO effect, the voltage drop was estimated by charge/discharge measurements at an applied current of 0.01 A with applied reduction potential bias (Fig. 5a). It was observed that with an increase in the ITO thickness, the voltage drop in the OHV-POSS ECDs is decreased (Fig. 5b). The ECD with ITO-III nm showed the lowest voltage drop due to the more rapid charge insertion and extraction process. With relatively thick ITO, the sheet resistance is reduced, exhibiting high electrical conductivity, which helps to keep the current density uniform during the electrochemical reaction process.
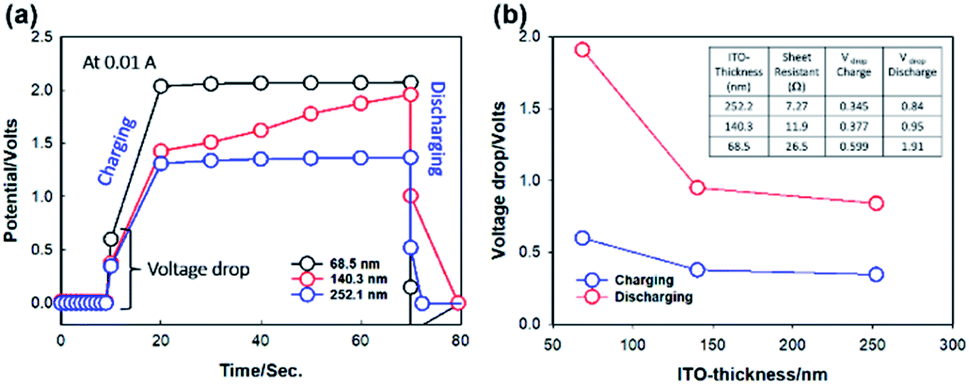 | ||
| Fig. 5 (a) Galvanometric charge/discharge curves measured after applying a current of 0.01 A for [OHV-POSS][PF6]16-based ECDs with ITO thicknesses of 68.5 nm, 140.3 nm, and 252.1 nm. The corresponding voltage drops during the charging and discharging processes are shown in (b). | ||
4. Conclusion
Here, we studied the effects of the ITO thickness on the electrochromic performance capabilities of electrochromic devices (ECDs) containing viologen-functionalized polyhedral oligomeric silsesquioxanes (OHV-POSS). For this purpose, three ITO glass specimens with thicknesses of 68.5, 140.3, and 252.1 nm were chosen, and their surface properties were studied using morphological characterization techniques. The ITO electrode plays a vital role in determining the ECD performance outcome. The electrode with relatively thick ITO showed low sheet resistance and low surface roughness, which facilitated the superior electrochemical performance of OHV-POSS ECDs. Compared to normal viologen-containing ECDs, the OHV-POSS ECDs exhibited low voltage operation, high transmittance, and good long-term cyclic stability. In addition, the OHV-POSS ECDs featured a low voltage drop, low power consumption, and a high diffusion coefficient. These results suggest that it is necessary to use electrode with relatively thick ITO as it exhibits low sheet resistance of less than 10 Ω □−1 to achieve superior electrochromic performance outcomes in viologen-based ECDs. The proposed ITO specifications may be useful for the fabrication of high-performance and durable electrochromic devices containing [OHV-POSS][PF6]16 for smart window and display applications.Conflicts of interest
There are no conflicts to declare.Acknowledgements
This study was supported by the BK21 Four Program of Pusan National University. This work was partly supported by the National Research Foundation of Korea (NRF) grant funded by the Korea government (MEST) (No. 2019R1A2C1088662).References
- P. M. S. Monk, R. J. Mortimer and D. R. Rosseinsky, Electrochromism and Electrochromic Devices, Cambridge University Press, Cambridge, UK, 2007 Search PubMed.
- J. W. Kim and J. M. Myoung, Flexible and transparent electrochromic displays with simultaneously implementable subpixelated ion gel-based viologens by multiple patterning, Adv. Funct. Mater., 2019, 29, 1808911 CrossRef.
- C. G. Granqvist, M. A. Arvizu, I. Bayrak Pehlivan, H.-Y. Qu, R. T. Wen and G. A. Niklasson, Electrochromic materials and devices for energy efficiency and human comfort in buildings: a critical review, Electrochim. Acta, 2018, 259, 1170–1182 CrossRef CAS.
- H. J. Lee, C. Lee, J. Song, Y. J. Yun, Y. Jun and C. S. Ah, Electrochromic devices based on ultraviolet-cured poly (methyl methacrylate) gel electrolytes and their utilization in smart window applications, J. Mater. Chem. C, 2020, 8, 8747–8754 RSC.
- R. Baetens, B. P. Jelle and A. Gustavsen, Properties, requirements, and possibilities of smart windows for dynamic daylight and solar energy control in buildings: A state-of-the-art review, Sol. Energy Mater. Sol. Cells, 2010, 94, 87–105 CrossRef CAS.
- D. R. Rosseinsky and R. J. Mortimer, Electrochromic systems, and the prospects for devices, Adv. Mater., 2001, 13, 783–793 CrossRef CAS.
- C. G. Granqvist, E. Avendno and A. Azens, Electrochromic coatings, and devices: survey of some recent advances, Thin Solid Films, 2003, 442, 201–211 CrossRef CAS.
- R. D. Rauh, F. Wang, J. R. Reynolds and D. L. Meeker, High coloration efficiency electrochromics and and their application to multicolor devices, Electrochim. Acta, 2001, 46, 2023–2029 CrossRef CAS.
- T. Kobayashi, H. Yoneyama and H. Tamura, Polyaniline film-coated electrodes as electrochromic display devices, J. Electroanal. Chem., 1984, 161, 419–423 CrossRef CAS.
- C. G. Granqvist, Electrochromic tungsten oxide films: review of progress 1993-1998, Sol. Energy Mater. Sol. Cells, 2000, 60, 201–262 CrossRef CAS.
- H. C. Moon, C. H. Kim, T. P. Lodge and C. D. Frisbie, Multicolored, low-power, flexible electrochromic devices based on ion gels, ACS Appl. Mater. Interfaces, 2016, 8, 6252–6260 CrossRef CAS PubMed.
- K. Madasamy, D. Velayutham, V. Suryanarayanan, M. Kathiresan and K. C. Ho, Viologen-based electrochromic materials and devices, J. Mater. Chem. C, 2019, 7, 4622–4637 RSC.
- H. J. Byker (Gentex Corp.), Single-compartment, self-erasing solution phase, electrochromic devices, solution for use therein, and uses thereof, US Pat., 4902108A, 1986 Search PubMed.
- A. B. Djurisic, C. Y. Kwong and P. C. Chui, Indium-tin-oxide surface treatments: Influence on the performance of CuPc/C60 solar cells, J. Appl. Phys., 2003, 93, 5472–5479 CrossRef CAS.
- T. Minami, Present status of transparent conducting oxide ing oxide thin-film development for Indium-Tin-Oxide (ITO) substitutes, Thin Solid Films, 2008, 516, 5822–5828 CrossRef CAS.
- H. Kim, A. Pique, J. S. Horwitz, H. Mattoussi, H. Murata, Z. H. Kafafi and D. B. Chrisey, Indium tin oxide thin films for organic light-emitting devices, Appl. Phys. Lett., 1999, 75, 3444–3446 CrossRef.
- D. S. Hecht, L. Hu and G. Irvin, Emerging transparent electrodes based on thin films of carbon nanotubes, graphene, and metallic nanostructures, Adv. Mater., 2011, 23, 1482–1513 CrossRef CAS PubMed.
- D. Raoufi and F. Hosseinpanahi, The effect of film thickness on surface morphology of ITO thin film, Journal of Theoretical and Applied Physics, 2013, 7, 21–28 CrossRef.
- Ch. Jonda, A. B. R. Mayer, U. Stolz, A. Elschner and A. Karbach, Surface roughness effects and their influence on the degradation of organic light emitting devices, J. Mater. Sci., 2000, 35, 5645–5651 CrossRef CAS.
- A. Kraft, H. Henning, A. Herbst and K. H. Heckner, Changes in electrochemical and photoelectrochemical properties of tin-doped indium oxide layers after strong anodic polarization, J. Electroanal. Chem., 1994, 365, 191–196 CrossRef CAS.
- C. C. P. Cid, E. R. Spada and M. L. Sartorelli, Effect of the cathodic polarization on structural and morphological properties of FTO and ITO thin films, Appl. Surf. Sci., 2013, 273, 603–606 CrossRef CAS.
- K. Zhou, H. Wang, Y. Zhang, J. Liu and H. Yan, Understand the degradation mechanism of electrochromic WO3 films by double-step chronoamperometry and chronocoulometry techniques combined with in situ spectroelectrochemical study, Electroanalysis, 2017, 29, 1573–1585 CrossRef CAS.
- P. W. Chen, C. T. Chang, T. F. Ko, S. C. Hsu, K. D. Li and J. Y. Wu, Fast response of complementary electrochromic device based on WO3/Nio electrodes, Sci. Rep., 2020, 10, 8430 CrossRef CAS PubMed.
- G. K. Pande and J. S. Park, Electrochromic properties of hexyl-and perfluorohexyl-substituted symmetrical viologens in ionic gels, Text. Sci. Eng., 2020, 57, 225–232 Search PubMed.
- G. K. Pande, N. Kim, J. H. Choi, G. Balamurugan, H. C. Moon and J. S. Park, Effects of counter ions on electrochromic behaviors of asymmetrically substituted viologens, Sol. Energy Mater. Sol. Cells, 2019, 197, 25–31 CrossRef CAS.
- G. Balamurugan, G. K. Pande, J. H. Choi and J. S. Park, Enhanced electrochromic properties of terpyridine-attached asymmetric viologen with high transmittance and switching stability, Sol. Energy Mater. Sol. Cells, 2020, 216, 110714 CrossRef CAS.
- J. H. Choi, G. K. Pande, Y. R. Lee and J. S. Park, Electrospun ion gel nanofibers for high-performance electrochromic devices with outstanding electrochromic switching and long-term stability, Polymer, 2020, 194, 122402 CrossRef CAS.
- G. K. Pande, J. H. Choi, J. E. Lee, Y. E. Kim, J. H. Choi, H. W. choi, H. G. Chae and J. S. Park, Octa-viologen substituted polyhedral oligomeric silsesquioxane exhibiting outstanding electrochromic performances, Chem. Eng. J., 2020, 393, 124690 CrossRef CAS.
- G. K. Pande, J. S. Heo, J. H. Choi, Y. S. Eom, J. Kim, S. K. Park and J. S. Park, RGB-to-black multicolor electrochromic devices enabled with viologen functionalized polyhedral oligomeric silsesquioxanes, Chem. Eng. J., 2021, 420, 130446 CrossRef CAS.
- M. Pan, Y. Ke, L. Ma, S. Zhao, N. Wu and D. Xiao, Single-layer electrochromic device based on hydroxyalkyl viologens with large contrast and high coloration efficiency, Electrochim. Acta, 2018, 266, 395–403 CrossRef CAS.
- T. Fouquet, T. N. T. Phan and L. Charles, Tanden mass spectrometry of electrosparyed polyhedral oligomeric silsesquioxane compounds with different substituents, Rapid Commun. Mass Spectrom., 2012, 26, 765–774 CrossRef CAS PubMed.
- Z. Ghorannevis, E. Akbarnejad and M. Ghorannevis, Structural and morphological properties of ITO thin films grown by magnetron sputtering, Journal of Theoretical and Applied Physics, 2015, 9, 285–290 CrossRef.
- D. Roufi and F. Hosseinpanahi, The effect of film thickness on surface morphology of ITO thin films, Journal of Theoretical and Applied Physics, 2013, 7, 21 CrossRef.
- M. Colovic, I. Jerman, M. Gaberscek and B. Orel, POSS based ionic liquid as an electrolyte for hybrid electrochromic devices, Sol. Energy Mater. Sol. Cells, 2011, 95, 3472–3481 CrossRef CAS.
- Q. Lu, J. Fu, L. Chen, D. Shang, M. Li, Y. Xu, R. Jia, S. Yuan and L. Shi, Polymeric polyhedral oligomeric silsesquioxane ionic liquids based solid polymer electrolytes for lithium-ion batteries, J. Power Sources, 2019, 414, 31–40 CrossRef CAS.
- A. J. Bard and L. R. Faulkner, Electrochemical Methods, Fundamentals and Applications, John Wiley & Sons, Inc., 2001, p. 591 Search PubMed.
- L. Liang, J. Zhang, Y. Zhou, J. Xie, X. Zhang, M. Guan, B. Pan and Y. Xie, High-performance flexible electrochromic device based on facile semiconductor-to-metal transition realized by WO3.2H2O ultrathin nanosheets, Sci. Rep., 2013, 3, 1936 CrossRef PubMed.
- D. S. Kim, H. Park, S. Y. Hong, J. Yun, G. Lee, J. H. Lee and S. J. Ha, Low power stretchable active-matrix red, green, blue (RGB) electrochromic device array of poly (3-methylthiophene)/Prussian blue, Appl. Surf. Sci., 2019, 471, 300–308 CrossRef CAS.
- J. M. Saveant, Electron hoping between fixed sites “diffusion” and “migration” in counter-ion conservative redox membranes at steady state, J. Electroanal. Chem., 1988, 242, 1–21 CrossRef CAS.
- C. Armenta-Deu and M. V. Calvo-Baza, The initial voltage drop in lead-acid cells: the influence of the overvoltage, J. Power Sources, 1998, 72, 194–202 CrossRef CAS.
- A. Lewandowski, P. Jakobczyk, M. Galinski and M. Biegun, Self-discharge of electrochemical double layer capacitors, Phys. Chem. Chem. Phys., 2013, 15, 8692–8699 RSC.
Footnote |
| † Electronic supplementary information (ESI) available: Impedance spectra, CV results, optical transmittance/absorbance spectra, ionic conductivity. See https://doi.org/10.1039/d2ra02083a |
| This journal is © The Royal Society of Chemistry 2022 |