
 Open Access Article
 This Open Access Article is licensed under a Creative Commons Attribution-Non Commercial 3.0 Unported Licence
Nitrogen-doped carbon derived from horse manure biomass as a catalyst for the oxygen reduction reaction†
Gasidit Panomsuwan *abc,
Chadapat Hussakanab,
Napat Kaewtrakulchaid,
Ratchatee Techapiesancharoenkijabc,
Ai Serizawae,
Takahiro Ishizakie and
Apiluck Eiad-ua*f
*abc,
Chadapat Hussakanab,
Napat Kaewtrakulchaid,
Ratchatee Techapiesancharoenkijabc,
Ai Serizawae,
Takahiro Ishizakie and
Apiluck Eiad-ua*f
aDepartment of Materials Engineering, Faculty of Engineering, Kasetsart University, Bangkok 10900, Thailand. E-mail: gasidit.p@ku.ac.th
bInternational Collaborative Education Program for Materials Technology, Education, and Research (ICE-Matter), ASEAN University Network/Southeast Asia Engineering Education Development Network (AUN/SEED-Net), Kasetsart University, Bangkok 10900, Thailand
cSpecial Research Unit for Biomass Conversion Technology for Energy and Environmental Materials, Kasetsart University, Bangkok 10900, Thailand
dKasetsart Agricultural and Agro-Industrial Product Improvement Institute, Kasetsart University, Bangkok 10900, Thailand
eDepartment of Materials Science and Engineering, Faculty of Engineering, Shibaura Institute of Technology, Tokyo 135-8548, Japan
fCollege of Materials Innovation and Technology, King Mongkut's Institute of Technology Ladkrabang, Bangkok 10520, Thailand. E-mail: apiluck.ei@kmitl.ac.th
First published on 14th June 2022
Abstract
A massive amount of animal biomass is generated daily from livestock farms, agriculture, and food industries, causing environmental and ecological problems. The conversion of animal biomass into value-added products has recently gained considerable interest in materials science research. Herein, horse manure (HM) was utilized as a precursor for synthesizing nitrogen-doped carbons (NCs) via hydrothermal ammonia treatment and the post pyrolysis process. The ammonia concentration varied between 0.5, 1.0, and 1.5 M in the hydrothermal process. From the comprehensive characterization results, horse manure-derived nitrogen-doped carbons (HMNCs) exhibited an amorphous phase and a hierarchical nanoporous structure. The specific surface area decreased from 170.1 to 66.6 m2 g−1 as the ammonia concentration increased due to micropore deterioration. The nitrogen content was 0.90 atom% even with no ammonia treatment, indicating self-nitrogen doping. With hydrothermal ammonia treatment, the nitrogen content slightly enhanced up to 1.54 atom%. The electrocatalytic activity for the oxygen reduction reaction (ORR) of HMNCs in an alkaline solution was found to be related to nitrogen doping content and porous structure. The ORR activity of HMNCs mainly proceeded via a combination of two- and four-electron pathways. Although the ORR activity of HMNCs was still not satisfactory and comparable to that of a commercial Pt/carbon catalyst, it showed better long-term durability. The results obtained in this work provide the potential utilization of HM as a precursor for ORR catalysts and other related applications.
Introduction
An alkaline fuel cell (ACF) has been recognized as a promising green energy source for advanced applications in the future because of its greenness, high efficiency, and net zero carbon dioxide (CO2) emission.1,2 Electrochemical redox reactions taking place at the cathode and anode are key factors in generating electricity from the ACF by utilizing hydrogen as a fuel. In the ACF system, an oxygen reduction reaction (ORR) occurs at the cathode, while a hydrogen oxidation reaction proceeds at the anode.3,4 Currently, a Pt nanoparticle-supported carbon black (Pt/C) catalyst is typically employed as a commercial benchmark catalyst for both the anode and cathode in ACFs.5,6 However, the high cost and scarcity of Pt are economic hindrances that hamper the viable application of ACFs in the commercialization scale.7 Moreover, the poor stability of Pt/C under the long-term use of ACFs is another shortcoming that should be overcome and urgently addressed.8 It is known that the ORR is more facile than HOR in alkaline media than in acidic media.4,9,10 This has allowed several materials other than Pt/C to be used as alternative ORR catalysts in ACFs, such as perovskites,11 metal chalcogenides,12 transition metal oxides,13 MXene,14 transition metal–nitrogen–carbon,15–17 and metal-free heteroatom-doped carbons.18–20Over the past decade, significant progress has intensively concentrated on nitrogen-doped carbons (NCs) as low-cost, catalytically active, and durable catalysts for ORR to replace Pt/C.18–23 Even though several carbon-source precursors and techniques have been reported to synthesize NCs, most studies have used high-cost and toxic carbon/nitrogen precursors (i.e., ionic liquids,24 ammonia gas,25 aromatic-ring molecules,26 and polymeric precursors27), which could not be suitable for mass production. Therefore, there is still plenty of room for further research on the synthesis of NCs using available, low-cost, environmentally friendly, and sustainable precursors. Recently, enormous research efforts have paid attention to the conversion of biomass waste into carbon materials as a waste disposal alternative to minimize the cost of carbon materials and improve the utilization of biomass waste.28–31 Biomass waste is currently produced from agriculture, wood processing, food production, livestock, and farms. Although it could be utilized as fertilization or fuel in power plants and industries, the excess parts could inevitably cause environmental problems and management costs.32–34 To date, considerable progress has been made in the use of plant biomass (e.g., plant leaves,35,36 fruit peels,37–39 soybeans,40 natural fibers,41,42 and cornstalks43) as precursors for synthesizing carbon-based electrocatalysts for ORR.
In addition to plant biomass, animal manure from livestock is also one of the major sources of animal biomass worldwide. It is generally used as an organic fertilizer in agriculture due to its richness in nutrients. However, in areas with a high livestock density, manure leakage from the storage and disposal can cause adverse effects and serious problems on native soil and water quality.44–46 Presently, studies on converting animal manures into carbon materials are still limited and received less attention than plant biomass. Only a few attempts have been reported in the synthesis of carbon materials from animal manures for many applications. For example, Zhang et al. reported the conversion of sheep manure into porous carbons via a facile carbonization and activation process for use as electrode materials in electrochemical supercapacitors.47 Qian et al. converted cow manure into activated carbons and studied its ability to adsorb phenol and methylene blue in water.48,49 Kong and Liu also demonstrated that porous carbons from cow manure showed selective capture and catalytic conversion of CO2.50 Zhang et al. utilized yak manure to prepare mesoporous carbons for soil amendment.51 Based on the literature review, the potential utilization of animal manure as a precursor in synthesizing NCs for ORR catalysts still lacks information, which needs further investigation to fill the knowledge gap in this field.
Herein, horse manure (HM) was utilized as a precursor for the synthesis of NCs by hydrothermal treatment in an ammonia solution and the post pyrolysis process. Horse manures were hydrothermally treated in an ammonia solution at different concentrations of 0.5, 1.0, and 1.5 M to vary the nitrogen doping levels in the NCs. Compared with the ammonia gas (NH3) treatment under pyrolysis, hydrothermal treatment with an ammonia solution is more convenient and safer for practical processes. The physicochemical properties of horse manure-derived NCs (HMNCs) were investigated and discussed comprehensively by scanning electron microscopy (SEM), transmission electron microscopy (TEM), X-ray diffraction (XRD), Raman spectroscopy, surface area and porosity analysis, and X-ray photoelectron spectroscopy (XPS). Furthermore, the potential application of HMNCs as ORR catalysts was evaluated by cyclic voltammetry (CV) and linear sweep voltammetry (LSV) using a three-electrode system in an alkaline electrolyte.
Experiment
Materials and chemicals
Solid HM was collected from a horse farm in Saraburi province, Thailand. Ammonia solution (NH4OH, concentration 28%) was purchased from RCI Labscan Co. Ltd. Potassium hydroxide aqueous solution (0.1 M KOH, ≥99.5% purity) was purchased from Kanto Chemical Co., Inc. Nafion® DE 521 solution (5 wt% in a mixture of lower aliphatic alcohols and water) and 20 wt% Pt nanoparticles on Vulcan XC-72R (20% Pt/C) were purchased from Sigma Aldrich. Ultrapure water (18.2 MΩ cm at 25 °C) was obtained from an Advantec RFD250NB water purification system. All chemicals were of analytical grade and used without further purification.Synthesis of HMNCs
HM was first dried in an oven at 105 °C for 24 h. The dried HM was then ground and sieved into a small size (800 μm). Twenty grams of dried HM were mixed with 40 mL of ammonia solution at different concentrations of 0.5, 1.0, and 1.5 M. The mixture was then transferred to a Teflon-lined stainless steel autoclave and hydrothermally treated at 200 °C for 24 h. After cooling to room temperature, the resulting solid product was separated and washed repeatedly with deionized water, followed by drying at 90 °C for 24 h. Hydrothermally treated HM was then pyrolyzed at 700 °C for 2 h and naturally cooled to room temperature under N2 atmosphere. The samples obtained from hydrothermal treatment at ammonia concentrations of 0.5, 1.0, and 1.5 M with pyrolysis were hereafter denoted as HMNC-0.5, HMNC-1.0, and HMNC-1.5, respectively. For comparison, the HM hydrothermally treated with the absence of ammonia and pyrolyzed under identical conditions was denoted as HMNC-0. The overall process for the synthesis of HMNCs is schematically presented in Fig. 1. The production yields of hydrochars and HMNCs synthesized at different ammonia concentrations are given in Table S1.† With increasing ammonia concentration, the yield of hydrochar decreased from 74.1% to 65.7%, while that of HMNCs decreased from 31.2% to 23.9%.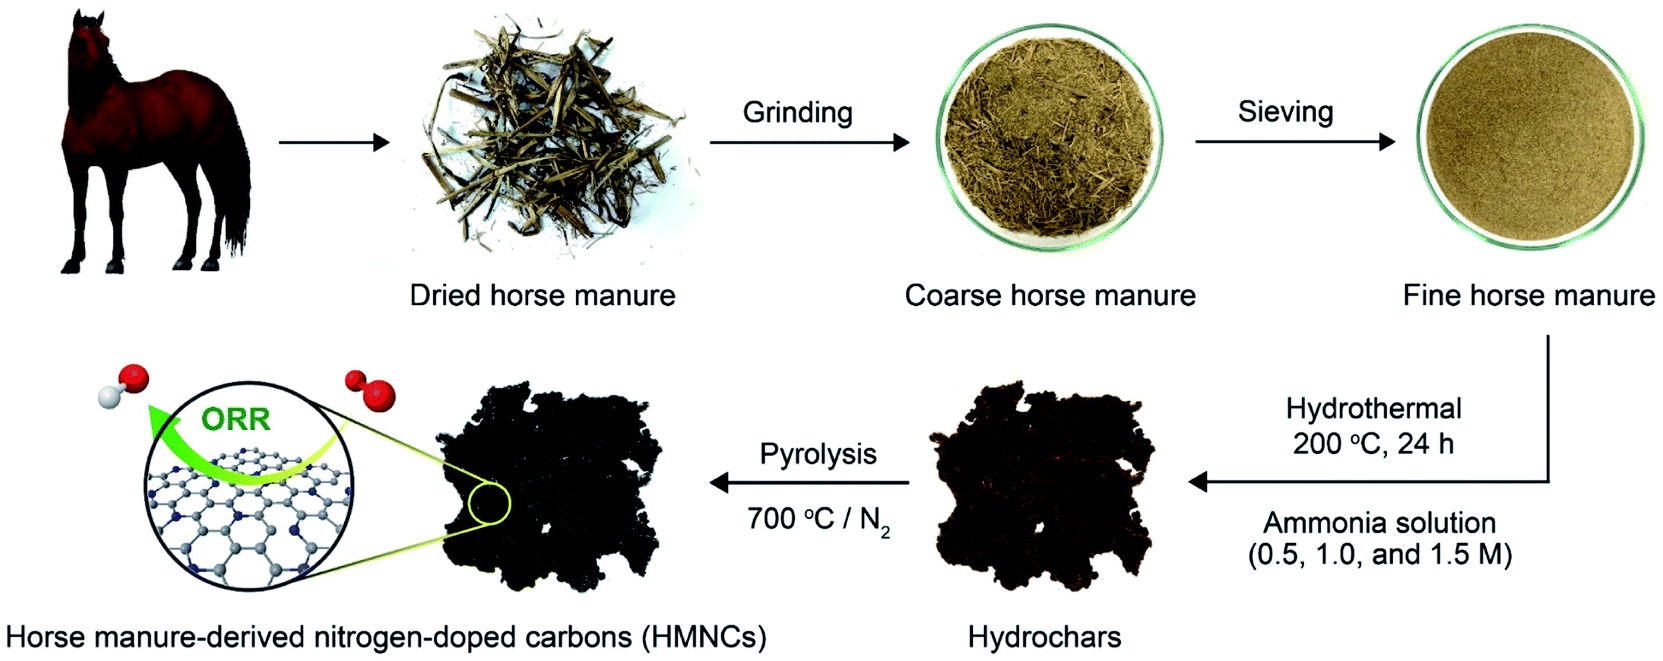 | ||
| Fig. 1 Schematic illustration illustrating the synthesis of HMNCs in this work. | ||
Characterization
Morphology and microstructure were investigated with a Hitachi SU3500 scanning electron microscope at an acceleration voltage of 5 kV and a JEM-3100F transmission electron microscope at an acceleration voltage of 300 kV, respectively. Energy dispersive spectroscopy (EDS) analysis was carried out on an AztecOne system from Oxford Instruments equipped with a scanning electron microscope. N2 adsorption–desorption isotherms were measured with a Micromeritics 3Flex surface characterization analyzer at liquid N2 temperature (−196 °C) to evaluate the surface area and pore structure. All samples were de-gassed at 150 °C for 12 h under a vacuum before the measurement. The XRD patterns were recorded on a Rigaku Ultima IV diffractometer with Cu Kα radiation (λ = 0.15406 nm) to identify the phase structure. Raman spectroscopic measurements were carried out on a JASCO NRS-5100 spectrometer with a laser-excitation wavelength of 532 nm. The XPS measurements were carried out on a JEOL JPS-9010MC spectrometer using monochromatic Mg Kα radiation (1253.6 eV) as an X-ray source to probe the chemical bonding state. The emission current and anode voltage were operated at 25 mA and 10 kV, respectively. The binding energy was calibrated using the C 1s peak at 284.5 eV as a reference.Electrochemical measurements
The catalyst ink was prepared by dispersing 5 mg of catalyst in a mixture of 490 μL ultrapure water, 490 μL ethanol, and 20 μL of Nafion® DE 521 aqueous solution (5 mg mL−1) and then sonicated until a homogeneous dispersion was obtained. A glassy-carbon disk electrode (ALS Co., Ltd.) was polished with 0.1 μm diamond slurry, followed by 0.05 μm alumina suspension on a polishing pad to obtain the mirror electrode surface. It was ultrasonically cleaned in ultrapure water for 5 min, subsequently rinsed with ultrapure water, and finally dried using an N2 gun with a gentle flow. A certain amount of well-dispersed catalyst ink (10 μL) was dropped onto a glassy carbon disk (4 mm diameter and 0.126 cm2 area), yielding a catalyst loading of 0.398 mg cm−2. The catalyst ink was well confined to the disk electrode area without spreading out of the electrode area. The catalyst-modified electrode was then dried in air for 6 h at room temperature prior to the electrochemical measurements. For comparison, a commercial 20% Pt/C catalyst was also prepared as a benchmark using the same procedure with a catalyst loading of 39.8 μgPt cm−2. The electrochemical measurements were carried out on a CHI-704E electrochemical analyzer (CH Instruments Inc.) equipped with an RRDE-3A rotating-ring disk electrode apparatus (ALS Co., Ltd.). A Pt coil (ALS Co., Ltd.) and Ag/AgCl filled with saturated potassium chloride (KCl) solution (ALS Co., Ltd.) were employed as the counter and reference electrodes, respectively. CV and LSV measurements were tested in a 0.1 M KOH solution with the saturation of N2 and O2 at room temperature. Chronoamperometric responses were also used to evaluate the durability of the catalysts.Results and discussion
Fig. 2 displays the morphology of the HMNCs prepared at different ammonia concentrations. All HMNCs revealed fractured pieces of a compact rigid structure with a rough and rupturing surface. Aggregate particles were also observed on their surfaces. There were no noticeable changes or differences in morphology among the HMNCs prepared at different ammonia concentrations. The surface morphology of HMNCs was rougher and more porous than that of HM due to the destruction of cellulose and hemicellulose of HM at high temperatures during hydrothermal and pyrolysis processes (Fig. S1†). The TEM images of representative HMNC-1.0 are presented in Fig. 2e and f. HMNC-1.0 revealed large irregular-shaped aggregates, and small dark particles were occasionally observed in some regions (Fig. S2†). At high magnification, disordered lattice fringes with the presence of a short-range ordered structure were visible, while the dark particles showed a clear lattice fringe. The selected area electron diffraction (SAED) pattern is shown in the inset in Fig. 2e. A diffused ring pattern was seen together with the diffraction spots from the SAED pattern. The disordered lattice fringes and diffused ring patterns proved that HMNC-1.0 had a disordered amorphous carbon structure. The visible diffraction spots and clear lattice fringes confirmed that the small particles presented in HMNC-1.0 were well crystalline, which will be discussed in the XRD analysis.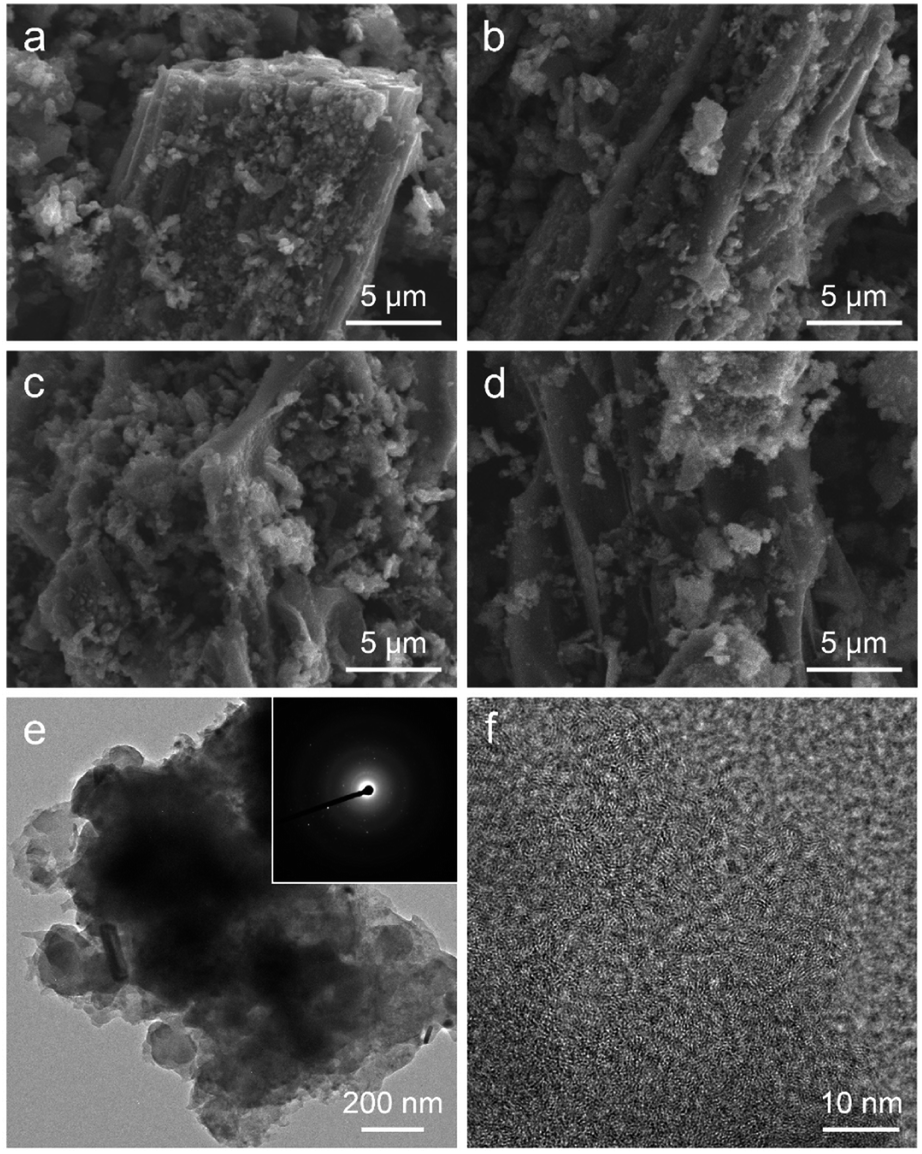 | ||
| Fig. 2 SEM images of (a) HMNC-0, (b) HMNC-0.5, (c) HMNC-1.0, and (d) HMNC-1.5. TEM images of HMNC-1.0 taken at (e) low and (f) high magnifications. The inset of (e) shows the corresponding SAED pattern. | ||
N2 adsorption–desorption isotherms were recorded to evaluate the textural characteristics, including the specific surface area, pore volume, type of porosity, and pore size distribution of HMNCs, as shown in Fig. 3a. The isotherms of the HMNCs revealed a volume adsorbed with well-defend plateaus in the low-pressure range and a narrow hysteresis loop at high-pressure range. This characteristic sorption feature corresponds to a mixed type I and IV behavior and type H4 hysteresis loop, according to the International Union of Pure and Applied Chemistry (IUPAC) classification.52 This indicates that the HMNCs possessed micropores, mesopores with narrow slit-like pores, and a certain number of macropores. The specific surface area calculated from the Brunette–Emmett–Teller (BET) method of HMNC-0, HMNC-0.5, HMNC-1.0, and HMNC-1.5 was 170.1, 58.3, 55.2, and 66.6 m2 g−1, respectively. In contrast, the specific surface area of HM was relatively low (about 5.8 m2 g−1) due to its nonporous structure (Fig. S3†). This finding suggests that the lignocellulosic structure of HM was destroyed during the hydrothermal and pyrolysis processes, resulting in pore formation and thereby increasing the surface area of HMNCs. However, the specific surface area of the HMNCs decreased after hydrothermal treatment at higher ammonia concentrations. The t-plot analysis was further performed to determine the specific surface area and pore volume contributed by the micropores. It was found that the specific surface area of HMNC-0 was mainly contributed by micropores (73%), confirming the majority of its microporous structure. However, for HMNC-0.5, HMNC-1.0, and HMNC-1.5, the micropores substantially decreased to about 39–55%, while external pores (i.e., mesopores and macropores) became more dominant. Among all samples, HMNC-1.0 had the largest contribution of external pores (61%), indicating its predominant meso/macroporous structure. This result implies that hydrothermal treatment with an ammonia solution could result in a decrease in the surface area through the deterioration of the micropores. The corresponding pore-size distributions determined by the Barrett–Joyner–Halenda (BJH) method showed a major distribution in the range of 2–6 nm (Fig. 3b). The total pore volume of HMNCs was in the range of 0.055–0.132 cm3 g−1, which showed a similar trend to their specific surface area. The textural parameters of all samples are summarized in Table 1.
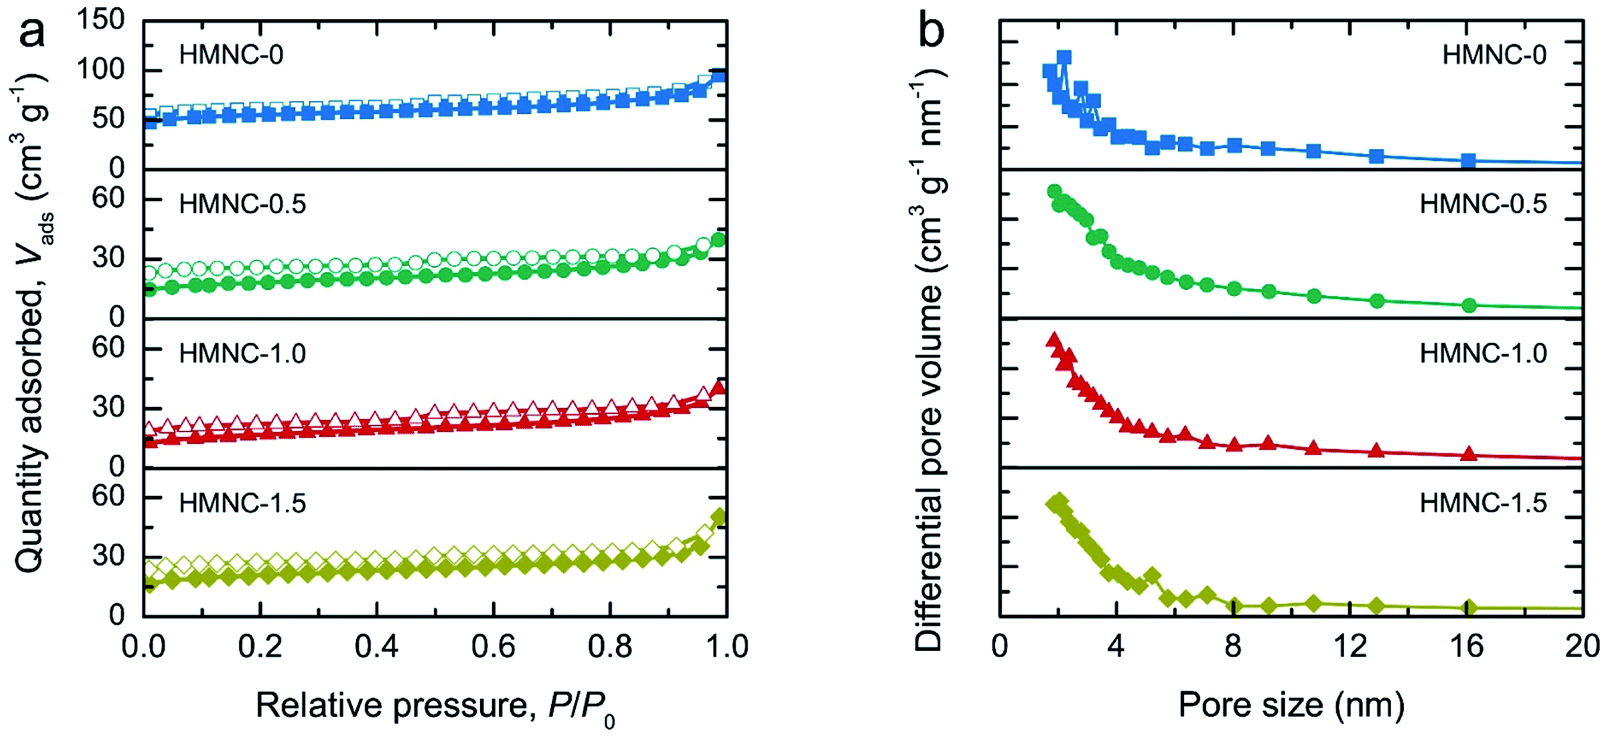 | ||
| Fig. 3 Surface area and porosity analyses: (a) N2 adsorption–desorption isotherms and (b) BJH pore size distribution of HMNCs. | ||
| Sample | SBETa (m2 g−1) | Smicrob (m2 g−1) | Smeso+macroc (m2 g−1) | Vtotald (cm3 g−1) | Vmicroe (cm3 g−1) | Vmeso+macrof (cm3 g−1) |
|---|---|---|---|---|---|---|
| a SBET is the specific surface area determined by the BET method.b Smicro is the micropore specific surface area determined by the t-plot method.c Smeso+macro is the specific surface area contributed by mesopores and macropores (Smeso+macro = SBET − Smicro).d Vtotal is the total pore volume.e Vmicro is the micropore volume determined by the t-plot method.f Vmeso+macro is the mesopore and macropore volume (Vmeso+macro = Vtotal − Vmicro). | ||||||
| HM | 5.8 | 0 | 5.8 | 0.018 | 0 | 0.018 |
| HMNC-0 | 170.1 | 123.3 | 46.8 | 0.132 | 0.065 | 0.067 |
| HMNC-0.5 | 58.3 | 30.2 | 28.1 | 0.056 | 0.016 | 0.040 |
| HMNC-1.0 | 55.2 | 21.7 | 33.5 | 0.055 | 0.011 | 0.044 |
| HMNC-1.5 | 66.6 | 36.2 | 30.4 | 0.060 | 0.019 | 0.041 |
The XRD pattern of HM (Fig. S4†) exhibited the most intense peaks at 22.0° along with small humps at 16.2° and 34.6°, representing the crystalline cellulose I structure in natural plants.53,54 However, the XRD patterns of the HMNCs (Fig. 4a) showed that the peaks of crystalline cellulose disappeared, while a broad peak at about 23° was observed as the main feature, which is the characteristic of amorphous carbon. Moreover, they also contained several sharp peaks corresponding to inorganic mineral crystals (e.g., SiO2, CaCO3, MgO, etc.), which are typically found in carbon derived from livestock manures.47,50,51 This result suggests that the crystalline cellulose of HM was destroyed and converted into carbon materials after hydrothermal and pyrolysis processes. The EDS mapping analysis taken from both HM and HMNC-1.0 showed the presence of several metals (e.g., Si, Ca, Mg, etc.) (Fig. S5 and S6†), corresponding to the XRD result and the previous report by Nagel et al.55 The coexistence of amorphous carbon and crystalline minerals in HMNCs is in accordance with the above TEM results. Raman spectroscopic measurements were performed to further investigate the structural properties of HMNCs. As shown in Fig. 4b, two evident peaks were observed at ∼1349 and ∼1595 cm−1, which refer to the D band and the G band, respectively. The D band refers to a structural disorder, while the G band is associated with graphite crystal planes.56,57 The peak intensity ratios of the D band to the G band (ID/IG) were found to be 1.01, 1.03, 1.08, and 1.09, for HMNC-0, HMNC-0.5, HMNC-1.0, and HMNC-1.5, respectively. The increase in the ID/IG values indicates the presence of more structural disorders and defect sites in HMNCs induced by nitrogen doping into the carbon lattice.
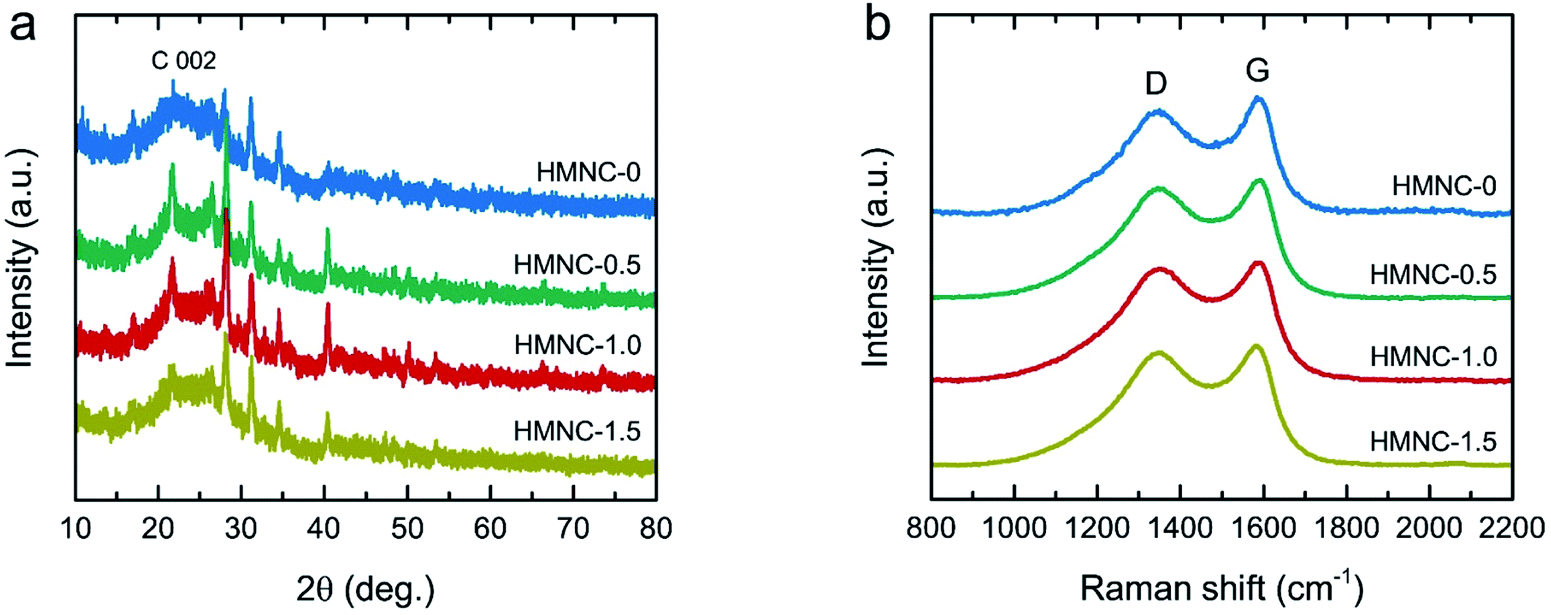 | ||
| Fig. 4 (a) XRD patterns and (b) Raman spectra of HMNCs. | ||
The chemical bonding states in the HMNCs were evaluated by XPS measurement. The XPS survey scans of HMNCs were mainly composed of C 1s, N 1s, and O 1s peaks. The nitrogen content was found to be 0.90, 1.26, 1.32, and 1.54 atom% for HMNC-0, HMNC-0.5, HMNC-1.0, and HMNC-1.5, respectively, which increased with increasing ammonia concentration. Although HMNC-0 was not hydrothermally treated in the ammonia solution, a nitrogen content of 0.90 atom% was detected. This result confirms the occurrence of self-nitrogen doping due to the existence of nitrogen atoms in the HM. It should be noted that nitrogen is typically found in HM, and the nitrogen content varies between 1% and 2%, depending on the horse diet, horse breed, bedding materials, and dwell time.58 The oxygen content was about 21–25 atom%. To elucidate the chemical state of carbon, nitrogen, and oxygen, high-resolution XPS C 1s, N 1s, and O 1s spectra were carefully deconvoluted, as shown in Fig. 5. High-resolution C 1s XPS spectra could be resolved into three peaks corresponding to C![[double bond, length as m-dash]](https://www.rsc.org/images/entities/char_e001.gif) C sp2 hybridization (C1: 284.5 eV), C–O/C–N (C2: 286.4 eV), and CO/CN (C3: 289.2 eV).59–61 With a higher ammonia concentration, the sp2 peak intensity was lower, while the shoulder intensity at a higher binding energy slightly increased due to more C–O/C–N bonding. This result implies that nitrogen doping could induce more structural defects in the carbon structure, which agrees with the Raman spectroscopic results. The high-resolution XPS N 1s spectra of HMNCs in Fig. 5b were deconvoluted into three peaks: pyridinic-N (N1: 398.4 eV), graphitic-N (N2: 401.0 eV), and pyridinic-N oxide (N3: 403.5 eV).26 Clearly, graphitic-N and pyridinic-N existed as the main components in all HMNCs, while pyridinic-N oxide contributed less. Fig. 5c shows the deconvoluted XPS O 1s spectra, consisting of two peaks attributed to C–O (O1: 532.5 eV) and CO (O2: 534.5 eV).61
C sp2 hybridization (C1: 284.5 eV), C–O/C–N (C2: 286.4 eV), and CO/CN (C3: 289.2 eV).59–61 With a higher ammonia concentration, the sp2 peak intensity was lower, while the shoulder intensity at a higher binding energy slightly increased due to more C–O/C–N bonding. This result implies that nitrogen doping could induce more structural defects in the carbon structure, which agrees with the Raman spectroscopic results. The high-resolution XPS N 1s spectra of HMNCs in Fig. 5b were deconvoluted into three peaks: pyridinic-N (N1: 398.4 eV), graphitic-N (N2: 401.0 eV), and pyridinic-N oxide (N3: 403.5 eV).26 Clearly, graphitic-N and pyridinic-N existed as the main components in all HMNCs, while pyridinic-N oxide contributed less. Fig. 5c shows the deconvoluted XPS O 1s spectra, consisting of two peaks attributed to C–O (O1: 532.5 eV) and CO (O2: 534.5 eV).61
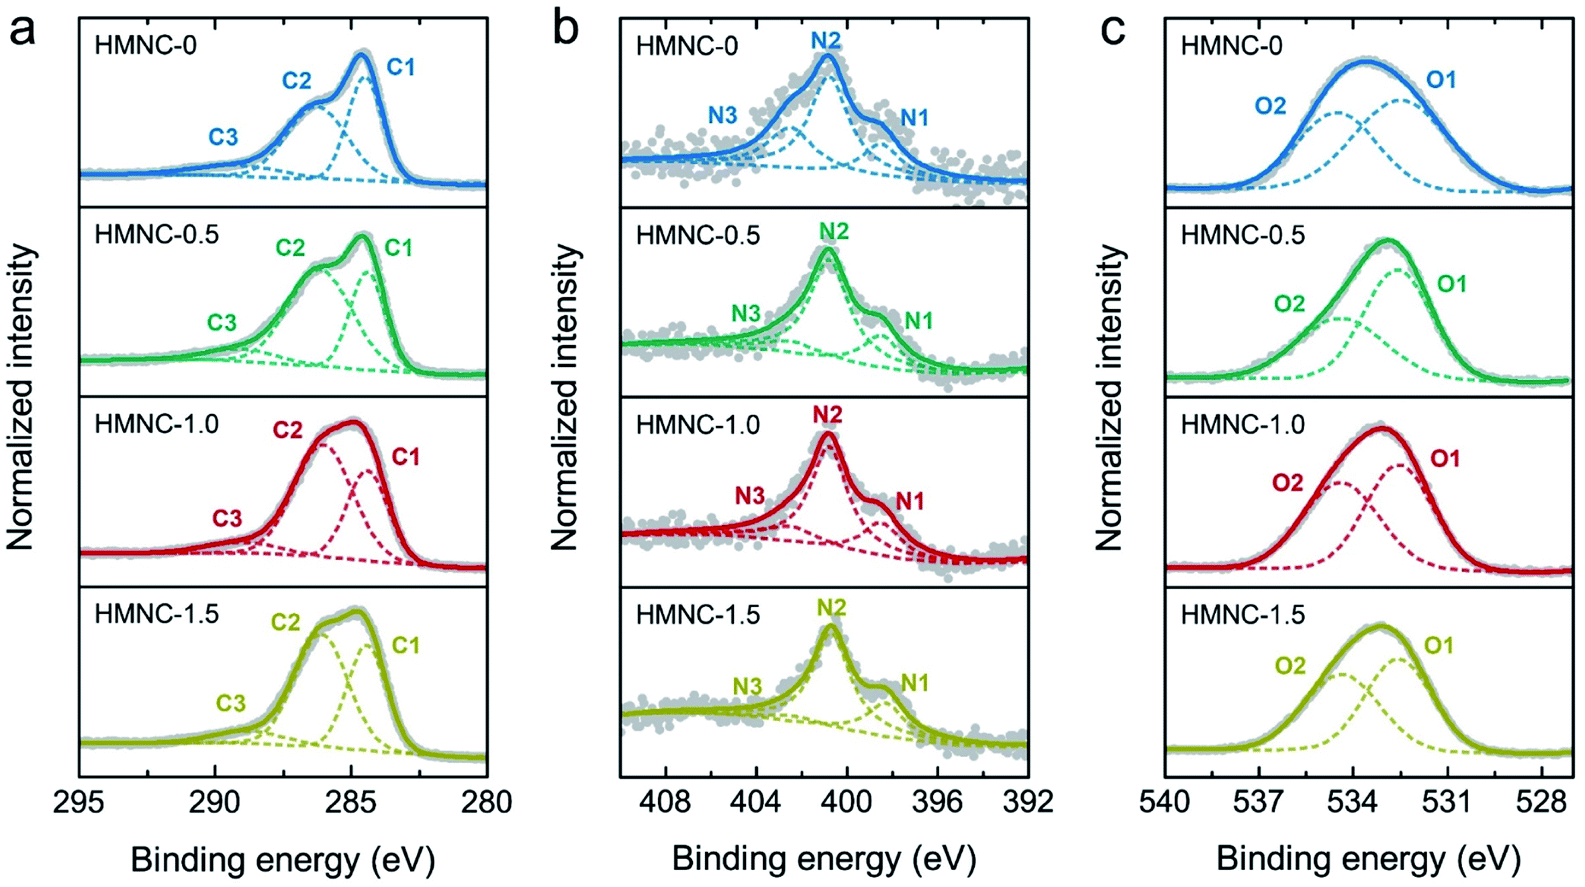 | ||
| Fig. 5 High-resolution XPS spectra with deconvolution of (a) C 1s, (b) N 1s, and (c) O 1s for HMNCs. | ||
The electrochemical ORR activity for HMNCs was first evaluated by CV measurements at a scan rate of 50 mV s−1 in a 0.1 M KOH solution saturated with N2 and O2 at room temperature. The CV curves of HMNCs (Fig. 6a and S7†) exhibited featureless behavior in the N2-saturated solution (dashed line), while the cathodic ORR peak emerged in the O2-saturated solution (solid line). This result confirmed the occurrence of ORR catalyzing in HMNCs. To gain further information on the ORR activity, the LSV curves were recorded at a rotation speed of 1600 rpm and a scan rate of 10 mV s−1 (Fig. 6b). From the LSV curves, the ORR onset potentials of HMNC-0 and HMNC-0.5 commenced at the same potential of −0.18 V. A positive shift in ORR onset potential was observed for HMNC-1.0 (−0.15 V), indicating an improvement in ORR activity. However, no more positive shift was observed for HMNC-1.5 compared to HMNC-1.0. In addition to the change in onset potential, a significant enhancement in the current density of HMNC-1.0 and HMNC-1.5 was observed compared to HMNC-0 and HMNC-0.5. Among the HMNCs studied, HMNC-1.0 showed the most positive onset potential and the highest current density; however, it was much inferior to that of commercial 20% Pt/C.
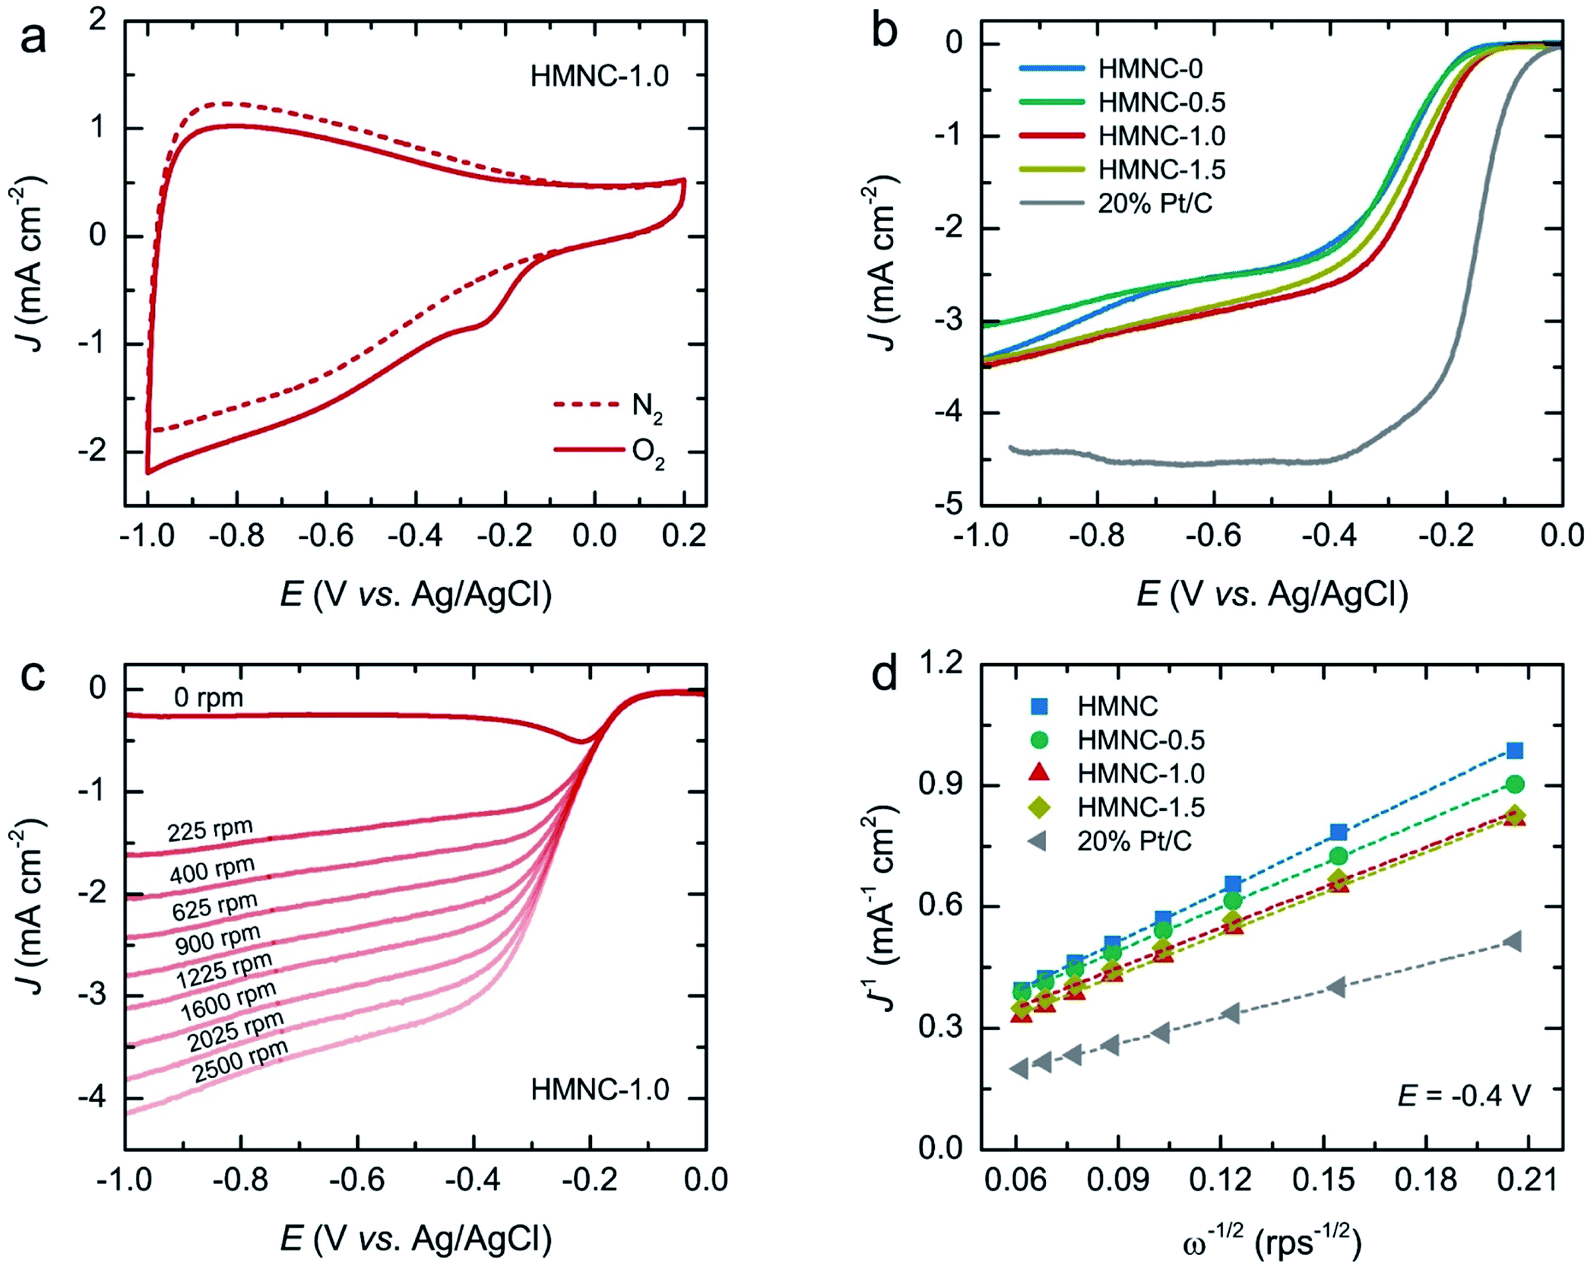 | ||
| Fig. 6 Electrochemical measurements for ORR: (a) CV curve of HMNC-1.0 measured in N2 and O2-saturated 0.1 M KOH solution (50 mV s−1), (b) LSV curves of all catalysts at a rotation speed of 1600 rpm (10 mV s−1), (c) LSV curves measured at different rotation speeds from 0 to 2500 rpm of HMNC-1.0, and (d) the K–L plots obtained from a series of LSV curves at different rotation speeds of all catalysts at a potential of −0.4 V. | ||
In the ORR process, there are two possible reduction pathways in alkaline solution: (i) the two-electron pathway in two steps (O2 + H2O + 2e− → OH− + HO2− and HO2− + H2O + 2e− → OH−) and (ii) a direct four-electron pathway (O2 + 2H2O + 4e− → 4OH−). A direct four-electron pathway is highly required for fuel cell applications. In contrast, a two-electron pathway is undesirable due to the formation of peroxide species, which can deteriorate the carbon electrode. To examine the ORR pathway occurring on the catalysts, a series of LSV curves were recorded at various rotation speeds from 225 to 2500 rpm in an O2-saturated solution, as shown in Fig. 6c and S8.† The current density of HMNCs in the diffusion-controlled region increased continuously as the rotation speed increased, indicating faster oxygen diffusion through the electrode surface. From the LSV data at various rotation speeds, the electron transfer number (n) per O2 molecule involved in the ORR process can be calculated by the Koutecky–Levich (K–L) formulas:62
 | (1) |
| B = 0.62nFv−1/6CODO2/3, | (2) |
![[thin space (1/6-em)]](https://www.rsc.org/images/entities/char_2009.gif) 485 C mol−1), DO is the diffusion coefficient of O2 (1.90 × 10⁻⁵ cm2 s−1), v is the kinematic viscosity of the electrolyte (0.01 cm2 s−1), and CO is the bulk concentration of O2 in the electrolyte (1.20 × 10⁻⁶ mol cm−3). The K–L plots of the inverse of the measured current density (J−1) versus the inverse of the square root of the angular velocity (ω−1/2) at a potential of −0.4 V of HMNCs are displayed in Fig. 6d. The data were fitted well with a linear relation, and their slopes were used to calculate n values. The n values of HMNC-0, HMNC-0.5, HMNC-1.0, and HMNC-1.5 at −0.4 V were calculated to be 2.20, 2.54, 2.70, and 2.74, respectively. The gradual increase in n values at higher nitrogen doping levels indicates that the four-electron pathway became preferable; however, the two-electron pathway was still the dominant reaction.
485 C mol−1), DO is the diffusion coefficient of O2 (1.90 × 10⁻⁵ cm2 s−1), v is the kinematic viscosity of the electrolyte (0.01 cm2 s−1), and CO is the bulk concentration of O2 in the electrolyte (1.20 × 10⁻⁶ mol cm−3). The K–L plots of the inverse of the measured current density (J−1) versus the inverse of the square root of the angular velocity (ω−1/2) at a potential of −0.4 V of HMNCs are displayed in Fig. 6d. The data were fitted well with a linear relation, and their slopes were used to calculate n values. The n values of HMNC-0, HMNC-0.5, HMNC-1.0, and HMNC-1.5 at −0.4 V were calculated to be 2.20, 2.54, 2.70, and 2.74, respectively. The gradual increase in n values at higher nitrogen doping levels indicates that the four-electron pathway became preferable; however, the two-electron pathway was still the dominant reaction.
By correlating the ORR activity with the above characterization results, HMNC-0 had the lowest ORR activity even with the highest surface area, which was due to its low nitrogen doping content and the predominance of micropores. It has been reported that the ORR activity of porous carbon materials is not proportional to the specific surface area, but the ratio of micropores and mesopores plays a more dominant role than the surface area. Too few mesopores or too many micropores could result in a large mass-transfer resistance, decreased mass transport pathway, and low accessibility to active sites, thereby suppressing ORR activity.63 The highest ORR catalytic activity of HMNC-1.0 can thus be attributed to an optimum ratio of micropores to meso/macropores and an appropriate nitrogen doping content with predominant graphitic-N and pyridinic-N. The presence of a high meso- and macropore ratio in HMNC-1.0 could facilitate the mass transfer process and allow more accessible active sites to be exposed inside micropores for the ORR.64–66 The ORR activity (i.e., onset potential, current density, and electron transfer number), surface area, and nitrogen doping content of HMNC-1.0 are summarized and compared with those of NCs derived from other biomasses in the literature (Table S2†). Despite the less satisfactory and relatively lower ORR activity of HMNC-1.0 compared to the others, it was comparable to that of some reports. The ORR activity of HMNCs in this work could further be enhanced through three possible strategies: (i) enlargement of surface area with appropriate micro–meso–macroporous structure by adjusting hydrothermal and pyrolysis conditions (e.g., temperature, time, ammonia concentration, type of activator, etc.), (ii) increase of nitrogen doping content with predominant pyridinic-N and graphitic-N by using another nitrogen-rich nitrogen precursor at the optimal synthesis conditions, and (iii) removal of the unwanted mineral ashes by pre- or post-chemical treatment.
To assess the ORR durability, the current–time (I–t) chronoamperometric measurement was performed on HMNC-1.0 at a potential of −0.4 V with a rotation speed of 1600 rpm for 20000 s (Fig. 7). After 20000 s, the relative current of HMNC-1.0 was reduced by 16%, while that of 20% Pt/C was degraded by 29%. The above results confirmed that although the ORR activity of HMNC-1.0 was not satisfactory, it had better long-term durability than 20% Pt/C.
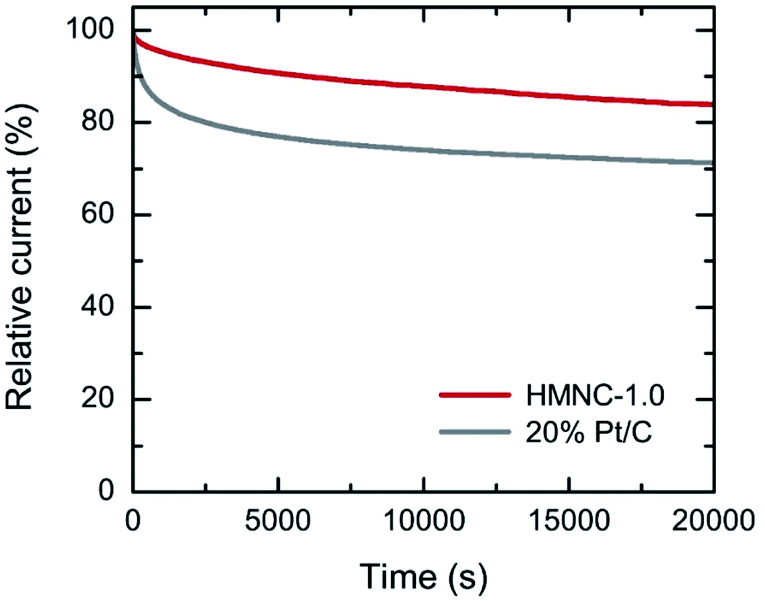 | ||
| Fig. 7 Chronoamperometric response of HMNC-1.0 and 20% Pt/C measured at an applied potential of −0.4 V (1600 rpm) in O2-saturated 0.1 M KOH solution. | ||
Conclusions
HMNCs were successfully synthesized by hydrothermal ammonia treatment and the post pyrolysis process. The HMNCs exhibited an amorphous carbon phase with a hierarchical nanoporous structure. A hydrothermal ammonia treatment resulted in the deterioration of the microporous structure, thus decreasing the surface area. The nitrogen-doping content in HMNCs was found in the range of 0.90–1.54 atom%, which increased with increasing ammonia concentration. Nitrogen atoms were favorably bonded to carbon atoms in the form of graphitic-N and pyridinic-N bonding states, which effectively served as active sites for ORR. Among the HMNCs studied, HMNC-1.0 showed the best ORR activity due to its high meso- and macropore ratio, which could facilitate mass transport and allow more accessible active sites for the ORR. Although the ORR activity of HMNCs in this work was still not satisfactory due to its low current density, low onset potential, and preferential reduction via a two-electron pathway, it showed better durability than 20% Pt/C. Therefore, the challenge is still wide open for the further development of HMNCs with more efficient ORR activity through tailoring synthesis parameters and processes. The present results can provide useful information and references to fill the knowledge gap regarding the potential utilization of animal manure as precursors for ORR catalysts.Author contributions
Conceptualization: G. P., A. E.; data curation: G. P., N. K., C. H.; formal analysis: G. P., N. K., C. H.; funding acquisition: G. P., A. E., A. S., T. I.; investigation: G. P., C. H., N. K.; methodology: G. P., N. K., A. E.; project administration: G. P., A. E.; resource: G. P., A. E., T. I., A. S.; visualization: G. P.; validation: G. P., A. E., R. T.; writing – original draft: G. P., C. H.; writing – review & editing: G. P., R. T., A. E.Conflicts of interest
There are no conflicts to declare.Acknowledgements
This work was financially supported by the Kasetsart University Research and Development Institute (KURDI, grant no. FF(KU) 25.64), Japan Science and Technology Agency (JST), Strategic International Collaborative Research Program (SICORP) (No. JPMJSC18H1), and International Collaborative Education Program for Material Technology, Education, and Research (ICE-Matter), ASEAN University Network, Southeast Asia Engineering Education Development Network (AUN/SEED-Net), Japan International Cooperation Agency (JICA).Notes and references
- T. B. Ferriday and P. H. Middleson, Int. J. Hydrogen Energy, 2021, 46, 18489 CrossRef CAS.
- G. F. McLean, T. Niet, S. Prince-Richard and N. Djilali, Int. J. Hydrogen Energy, 2002, 27, 507 CrossRef CAS.
- N. Ramaswamy and S. Mukerjee, Chem. Rev., 2019, 119, 11945 CrossRef CAS.
- H. A. Firouzjaie and W. E. Mustain, ACS Catal., 2020, 10, 225 CrossRef CAS.
- R. Zhao, X. Yue, Q. Li, G. Fu, J.-M. Lee and S. Huang, Small, 2021, 17, 2100391 CrossRef CAS PubMed.
- S. Yia, H. Jiang, X. Bao, S. Zou, J. Liao and Z. Zhang, J. Electroanal. Chem., 2019, 848, 113279 CrossRef.
- J. Wu and H. Yang, Acc. Chem. Res., 2013, 46, 1848 CrossRef CAS PubMed.
- J. Zhang, Y. Yuan, L. Gao, G. Zeng, M. Li and H. Huang, Adv. Mater., 2021, 33, 2006494 CrossRef CAS.
- E. S. Davydova, S. Mukerjee, F. Jaouen and D. R. Dekel, ACS Catal., 2018, 8, 6665 CrossRef CAS.
- A. Kulkarni, S. Siahrostami, A. Patel and J. K. Nørskov, Chem. Rev., 2018, 118, 2302 CrossRef CAS PubMed.
- Q. Ji, L. Bi, J. Zhang, H. Cao and X. S. Zhao, Energy Environ. Sci., 2020, 13, 1408 RSC.
- M.-R. Gao, J. Jiang and S.-H. Yu, Small, 2012, 8, 13 CrossRef CAS PubMed.
- Y. Xue, S. Sun, Q. Wang, Z. Donga and Z. Liu, J. Mater. Chem. A, 2018, 6, 10595 RSC.
- S. G. Peera, C. Liu, A. K. Sahu, M. Selvaraj, M. C. Rao, T. G. Lee, R. Koutavarapu, J. Shim and L. Singh, Adv. Mater. Interfaces, 2021, 8, 2100975 CrossRef CAS.
- W. Gu, L. Hu, J. Li and E. Wang, Electroanalysis, 2018, 30, 1217 CrossRef CAS.
- C. W. Ye and L. Xu, J. Mater. Chem. A, 2021, 9, 22218 RSC.
- Y. Deng, J. Luo, B. Chi, H. Tang, J. Li, X. Qiao, Y. Shen, Y. Yang, C. Jia, P. Rao, S. Liao and X. Tian, Adv. Energy Mater., 2021, 11, 2101222 CrossRef CAS.
- L. Dai, Y. Xue, L. Qu, H.-J. Choi and J.-B. Baek, Chem. Rev., 2015, 115, 4823 CrossRef CAS PubMed.
- J. Quílez-Bermejo, E. Morallón and D. Cazorla-Amorósa, Carbon, 2020, 165, 434 CrossRef.
- Y. Li, Y. Tong and F. Peng, J. Energy Chem., 2020, 48, 308 CrossRef.
- Z. Wu, M. Song, J. Wang and X. Liu, Catalysts, 2018, 8, 196 CrossRef.
- P. M Gíslason and E. Skúlason, Nanoscale, 2019, 11, 18683 RSC.
- K.-H. Wu, D.-W. Wang, D.-S. Su and I. R. Gentle, ChemSusChem, 2015, 8, 2772 CrossRef CAS PubMed.
- Y. She, J. Chen, C. Zhang, Z. Lue, M. Ni, P. H.-L. Sit and M. K. H. Leung, Appl. Energy, 2018, 225, 513 CrossRef CAS.
- T. Liu, T. Kou, D. Bulmahn, C. Ortuno-Quintana, G. Liu, J. Q. Lu and Y. Li, ACS Appl. Energy Mater., 2018, 1, 5043 CrossRef CAS.
- G. Panomsuwan, N. Saito and T. Ishizaki, Carbon, 2016, 98, 411 CrossRef CAS.
- M. Yang, X. Long, H. Li, H. Chen and P. Liu, ACS Sustainable Chem. Eng., 2019, 7, 2236 CrossRef CAS.
- L. Du, G. Zhang, X. Liu, A. Hassanpour, M. Dubois, A. C. Tavares and S. Sun, Carbon Energy, 2020, 2, 561 CrossRef CAS.
- M. Borghei, J. Lehtonen, L. Liu and O. J. Rojas, Adv. Mater., 2018, 30, 1703691 CrossRef PubMed.
- Y. Wang, M. Zhang, X. Shen, H. Wang, H. Wang, K. Xia, Z. Yin and Y. Zhang, Small, 2021, 17, 2008079 CrossRef CAS PubMed.
- S. A. Nicolae, H. Au, P. Modugno, H. Luo, A. E. Szego, M. Qiao, L. Li, W. Yin, H. J. Heeres, N. Berge and M.-M. Titirici, Green Chem., 2020, 22, 4747–4800 RSC.
- T. Abbasi and S. A. Abbasi, Renewable Sustainable Energy Rev., 2010, 14, 919 CrossRef CAS.
- K. W. Chew, S. R. Chia, H.-W. Yen, S. Nomanbhay, Y.-C. Ho and P. L. Show, Sustainability, 2019, 11, 2266 CrossRef CAS.
- R. Pode, Renewable Sustainable Energy Rev., 2016, 53, 1468 CrossRef.
- L. Y. Zhang, Z. Zhou, Z. Liu and C. M. Li, ChemElectroChem, 2016, 3, 1466 CrossRef CAS.
- S. Gao, X. Wei, H. Fan, L. Li, K. Geng and J. Wang, Nano Energy, 2015, 13, 518 CrossRef CAS.
- L.-Y. Zhang, M.-R. Wang, Y.-Q. Lai and X.-Y. Li, J. Power Sources, 2017, 359, 71 CrossRef CAS.
- N. Wang, T. Li, Y. Song, J. Liu and F. Wang, Carbon, 2018, 130, 692 CrossRef CAS.
- L. Li, Z. Wu, J. Zhang, Y. Zhao and G. Shao, ChemElectroChem, 2021, 7, 4790 CrossRef.
- S. Liang, Z.-D. Wang, Z.-F. Guo, X.-Y. Chen, S.-Q. Li, B.-D. Wang, G.-L. Lu, H. Sun, Z.-N. Liu and H.-Y. Zang, New J. Chem., 2021, 45, 3947 RSC.
- X. Lin, X. Wang, L. Li, M. Yan and Y. Tian, ACS Sustainable Chem. Eng., 2017, 5, 9709 CrossRef CAS.
- J. Tang, Y. Wang, W. Zhao, W. Ye and S. Zhou, Sci. China: Technol. Sci., 2019, 62, 1710 CrossRef CAS.
- Y. Sun, Y. Duan, L. Hao, Z. Xing, Y. Dai, R. Li and J. Zou, ACS Appl. Mater. Interfaces, 2016, 8, 25923 CrossRef CAS PubMed.
- V. M. Goldberg, Environ. Health Perspect., 1989, 83, 25 CrossRef CAS PubMed.
- S. Caro and O. Dahi, Cleaner Engineering and Technology, 2021, 4, 100181 CrossRef.
- J. Martinez, P. Debert, S. Barrington and C. Burton, Bioresour. Technol., 2009, 100, 5527–5536 CrossRef CAS PubMed.
- C. Zhang, X. Zhu, M. Cao, M. Li, N. Li, L. Lai, J. Zhu and D. Wei, ChemSusChem, 2016, 10, 932 CrossRef PubMed.
- Q. Qian, M. Machida and H. Tatsumoto, Bioresour. Technol., 2007, 98, 353 CrossRef CAS PubMed.
- Q. Qian, M. Machida and H. Tatsumoto, Waste Manag., 2008, 28, 1064 CrossRef CAS PubMed.
- W. Kong and J. Liu, RSC Adv., 2019, 9, 4925 RSC.
- J. Zhang, B. Huang, L. Chen, Y. Li, W. Li and Z. Luo, Chem. Speciation Bioavailability, 2018, 30, 57 CrossRef CAS.
- M. Thommes, K. Kaneko, A. V. Neimark, J. P. Olivier, F. Rodriguez-Reinoso, J. Rouquerol and K. S. W. Sing, Pure Appl. Chem., 2015, 87, 1051 CrossRef CAS.
- X. Zhang, Y. Liu, P. Lu and M. Zhang, Green Process. Synth., 2020, 9, 139–152 Search PubMed.
- J. Gong, J. Li, J. Xu, Z. Xiang and L. Mo, RSC Adv., 2017, 7, 33486–33493 RSC.
- K. Nagel, N. O. Hoilett, M. A. Mottaleb, M. J. Meziani, J. Wistrom and M. Bellamy, Commun. Soil Sci. Plant Anal., 2019, 50, 1594881 CrossRef.
- T. Jawhari, A. Roid and J. Casado, Carbon, 1995, 33, 1561 CrossRef CAS.
- A. Jorio and A. G. Souza Filho, Annu. Rev. Mater. Res., 2016, 46, 357 CrossRef CAS.
- L. Da Lio, P. Castello, G. Gianfelice, R. Cavalli and P. Canu, Waste Manag., 2021, 128, 243–250 CrossRef CAS PubMed.
- L. Shi, L. Jin, Z. Meng, Y. Sun, C. Li and Y. Shena, RSC Adv., 2018, 8, 39937 RSC.
- T. Wei, X. Wei, Y. Gao and H. Li, Electrochim. Acta, 2015, 169, 186–194 CrossRef CAS.
- P. Fu, L. Zhou, L. Sun, B. Huang and Y. Yuan, RSC Adv., 2017, 7, 13383–13389 RSC.
- S. Xu, Y. Kim, D. Higgin, M. Yusuf, T. Francisco, J. Fritz and B. Prinza, Electrochim. Acta, 2017, 255, 99 CrossRef CAS.
- Y. Zhao, X. Li, X. Jia and S. Gao, Nano Energy, 2019, 58, 384 CrossRef CAS.
- C. Du, X. Liu, G. Ye, X. Gao, Z. Zhuang, P. Li, D. Xiang, X. Li, A. Clayborne, X. Zhou and W. Chen, ChemSusChem, 2019, 12, 1017 CrossRef CAS PubMed.
- G. A. Ferrero, K. Preuss, A. B. Fuertes, M. Sevilla and M.-M. Titirici, J. Mater. Chem. A, 2016, 4, 2581 RSC.
- R. Xing, T. Zhou, Y. Zhou, R. Ma, Q. Liu, J. Luo and J. Wang, Nano-Micro Lett., 2108, 10, 3 CrossRef PubMed.
Footnote |
| † Electronic supplementary information (ESI) available. See https://doi.org/10.1039/d2ra02079c |
| This journal is © The Royal Society of Chemistry 2022 |