DOI:
10.1039/D2RA02237K
(Paper)
RSC Adv., 2022,
12, 17490-17497
Synergy effect of CuO on CuCo2O4 for methane catalytic combustion†
Received
6th April 2022
, Accepted 31st May 2022
First published on 14th June 2022
Abstract
Spinel oxides (AB2O4) have been widely studied as catalysts for methane combustion. Increasing attention was focused on the catalysis properties of the [B2O3] octahedron; however, the role of the [AO] tetrahedron in the catalytic activity was seldom discussed. Herein, a series of (CuO)x–CuCo2O4 (x = 0, 0.1, 0.2) composite oxides were synthesized by a solvothermal method. The structure, morphology, and physicochemical properties of the as-synthesized samples were characterized by the XRD, SEM, BET, and XPS techniques. The results of the catalytic activity tests showed that the coexistence of CuO with CuCo2O4 can improve the catalytic activity. The XPS results demonstrated that there were remarkable Cu+ ions present in the composite oxides, which can cause increases in the number of oxygen vacancies on the surface of the catalysts. In addition, the redox of Cu+ and Cu2+ may improve the oxygen exchange capacity for methane oxidation.
1. Introduction
Methane is an attractive energy source because of its high H/C ratio and its high heat of combustion per mole of carbon dioxide generated. On the other hand, methane is also one of the greenhouse gases that exacerbates the greenhouse effect in the atmosphere.1 From the perspective of sustainable development, the reduction of unburned methane emissions needs to be addressed urgently. Catalytic combustion is one of the key technologies that not only reduces the reaction temperature and improves the efficiency of methane utilization, but also reduces methane and nitrogen oxide emissions.2
In the past decades, methane combustion catalysts have been widely and deeply studied.3 Earlier studies of methane combustion catalysts mostly focused on supported noble metals, such as Pd and Pt,4,5 both of which exhibit high catalytic activity towards methane. However, they are expensive, lack stability at high temperatures, and are easier to sinter, which affect the catalytic effect. Nowadays, the development of alternative catalysts based on non-precious metals is still very attractive.6 Single metal oxides,7–9 perovskites,10,11 spinel12,13 and hexaaluminate14 have been extensively studied. For spinel-type (AB2O4) catalysts, increasing attention was focused on the properties of the [B2O3] octahedron, but the effect of the [AO] tetrahedron on the catalytic activity was seldom discussed. The purpose of this study is to investigate the role of the [AO] tetrahedron in spinel oxides for catalytic methane combustion.
As well known, Co-based spinel catalysts have been widely used in the catalytic combustion of methane. Co3O4, NiCo2O4, and MCo2O4 (M = Cu, Zn, Ni) exhibit an extremely high catalytic activity for methane combustion.15–17 CuCo2O4 spinel oxide, as a member of the cobalt-based spinel, can be used as a catalyst, gas sensor, magnetic material, rechargeable battery, ceramic pigment, solar absorber, etc.18–21 CuCo2O4 spinel oxide can be synthesized by various methods, such as the sol–gel,22 hydrothermal,23 and template methods.24 However, in the above literature reports, there was a CuO phase that coexisted with CuCo2O4 in the synthesized samples, so it was difficult to synthesize pure CuCo2O4 oxides. Here, a series of (CuO)x–CuCo2O4 (x = 0, 0.1, 0.2) composite oxides were synthesized by the solvothermal method. We chose the solvothermal method to prepare the samples because of the good dispersion and high activity of the sample particles prepared by it.25–27 The structure, morphology, and physicochemical properties of the as-synthesized samples were characterized by the XRD, SEM, BET, and XPS techniques. The catalytic activity of the (CuO)x–CuCo2O4 composite oxides for methane combustion was tested in a fixed-bed reactor.
2. Experimental
2.1. Synthesis
(CuO)x–CuCo2O4 composite oxides were synthesized by the solvothermal method. In a typical experiment, 0.005 mol of Cu(NO3)2·3H2O (AR) and 0.01 mol of Co(NO3)2·6H2O (AR) were co-dissolved in 50 mL isopropanol and 25 mL glycerol and stirred at room temperature. The completely dissolved mixed solution was transferred to a Teflon-lined stainless steel autoclave, which was then sealed and kept at 180 °C for 12 h. After the reaction, the brown precipitate was cooled to room temperature, centrifuged, washed (three times each with deionized water and ethanol), then dried at 80 °C for 12 hours, and calcined at 500 °C for 3 h. CuO was synthesized by the same method.
2.2. Characterization
The crystal structure of the sample powder was analyzed via X-ray diffraction (Bruker D8 ADVANCE) with Cu Kα radiation (λ = 1.5406 Å). The powder morphology and element distributions of the sample were analyzed using an ultra-high resolution field emission scanning electron microscope device (Regulus 8230, Hitachi, Japan) and X-ray energy spectrum analyzer (EDX). The surface area (BET) and pore size distribution of the catalyst were measured by nitrogen (N2) adsorption using a physical adsorption analyzer (ASAP 2460, Micromeritics, USA) at −195.85 °C. Raman spectroscopy was performed on a Raman microscope imaging spectrometer (Thermo Fisher Dxr2xi). X-ray photoelectron spectroscopy (XPS) was performed to determine the elemental composition of the catalyst's surface, and a Thermo Fisher Scientific K-Alpha X-ray photoelectron spectrometer was used for analysis.
2.3. Catalytic performance tests
The catalytic performance tests were performed in a fixed-bed quartz reactor. The as-prepared powder sample was sieved to 60–80 mesh. 200 mg of the sieved sample was taken and placed in the center of a quartz tube, and quartz wool was used as a stopper. A 100 mL min−1 gas mixture consisting of 2% (volume) methane, 26% (volume) oxygen and 72% (volume) nitrogen was fed into the reactor at a space velocity of 30![[thin space (1/6-em)]](https://www.rsc.org/images/entities/char_2009.gif) 000 mL gcat−1 h−1. A gas chromatograph (GC-14C) was used to measure the exhaust gas in the reactor online to analyze the methane concentration after the catalytic reaction. In this test, the data was obtained after 30 minutes of stabilization at each temperature.28
000 mL gcat−1 h−1. A gas chromatograph (GC-14C) was used to measure the exhaust gas in the reactor online to analyze the methane concentration after the catalytic reaction. In this test, the data was obtained after 30 minutes of stabilization at each temperature.28
3. Results and discussion
3.1. XRD
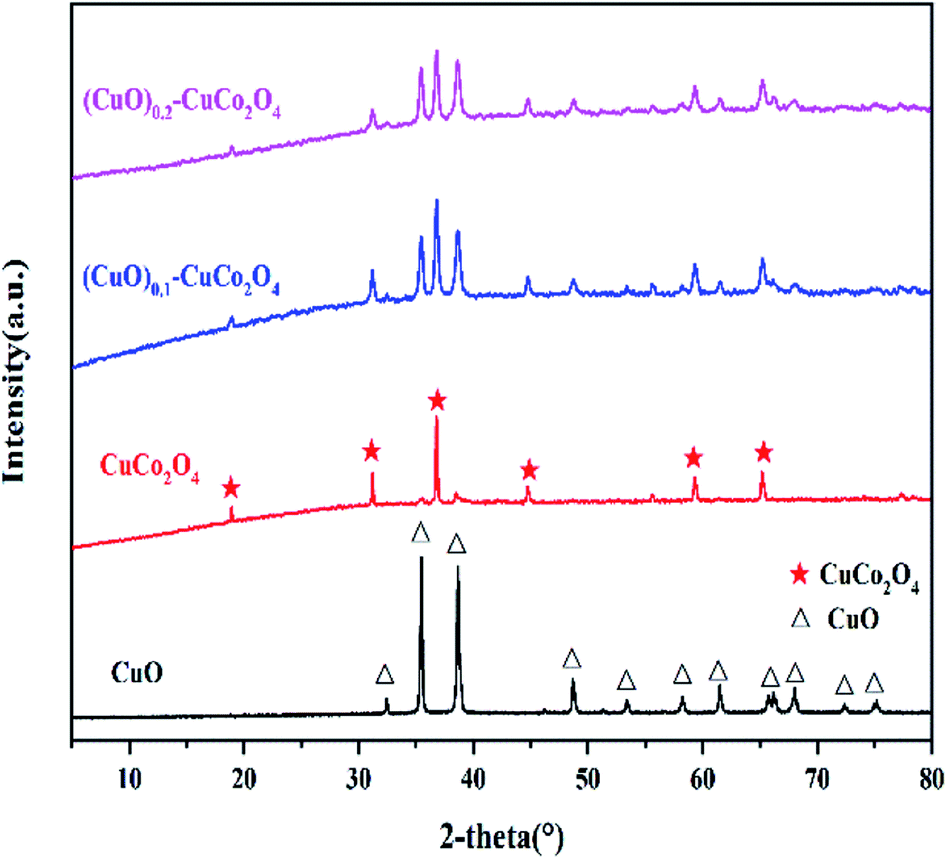
The XRD patterns of the (CuO)x–CuCo2O4 composite oxides are shown in Fig. 1. The main peaks of CuO are at 2θ = 35.5°, 38.7°, 48.7°, 61.5°, 65.8°, and 66.2°, which can be indexed to the (−111), (111), (−202), (−113), (022), and (−311) crystal planes, (JCPDS01-089-5899), respectively. The characteristic peaks of CuCo2O4 are at 2θ = 18.9°, 31.1°, 36.7°, 44.6°, 55.4°, 59.1°, and 65.0°, which can conform to the standard pattern Cu0.92Co2.08O4 (JCPDS01-076-1887), and the crystal plane types are (111), (220), (311), (400), (422), (511), and (440), respectively.17 XRD spectroscopy confirms that even in the samples synthesized according to the stoichiometric ratio, there is a separate CuO phase, indicating that the CuO phase and CuCo2O4 coexist. It can be seen from the spectrum that the two composite oxide samples have evident characteristic peaks of CuO, which are consistent with our target products.
 |
| | Fig. 1 XRD patterns of CuO and the (CuO)x–CuCo2O4 composite oxides. | |
3.2. SEM and BET
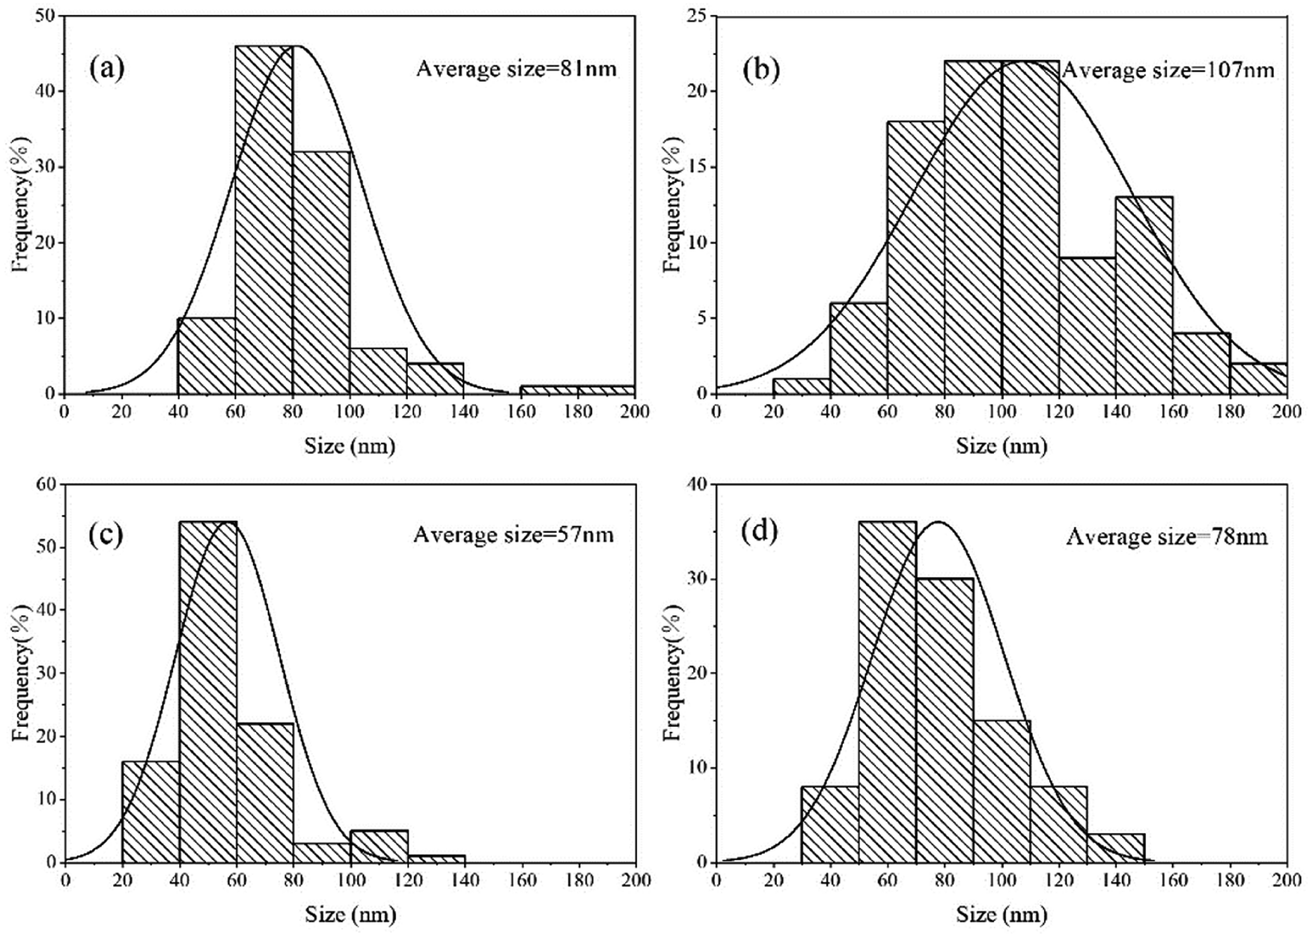
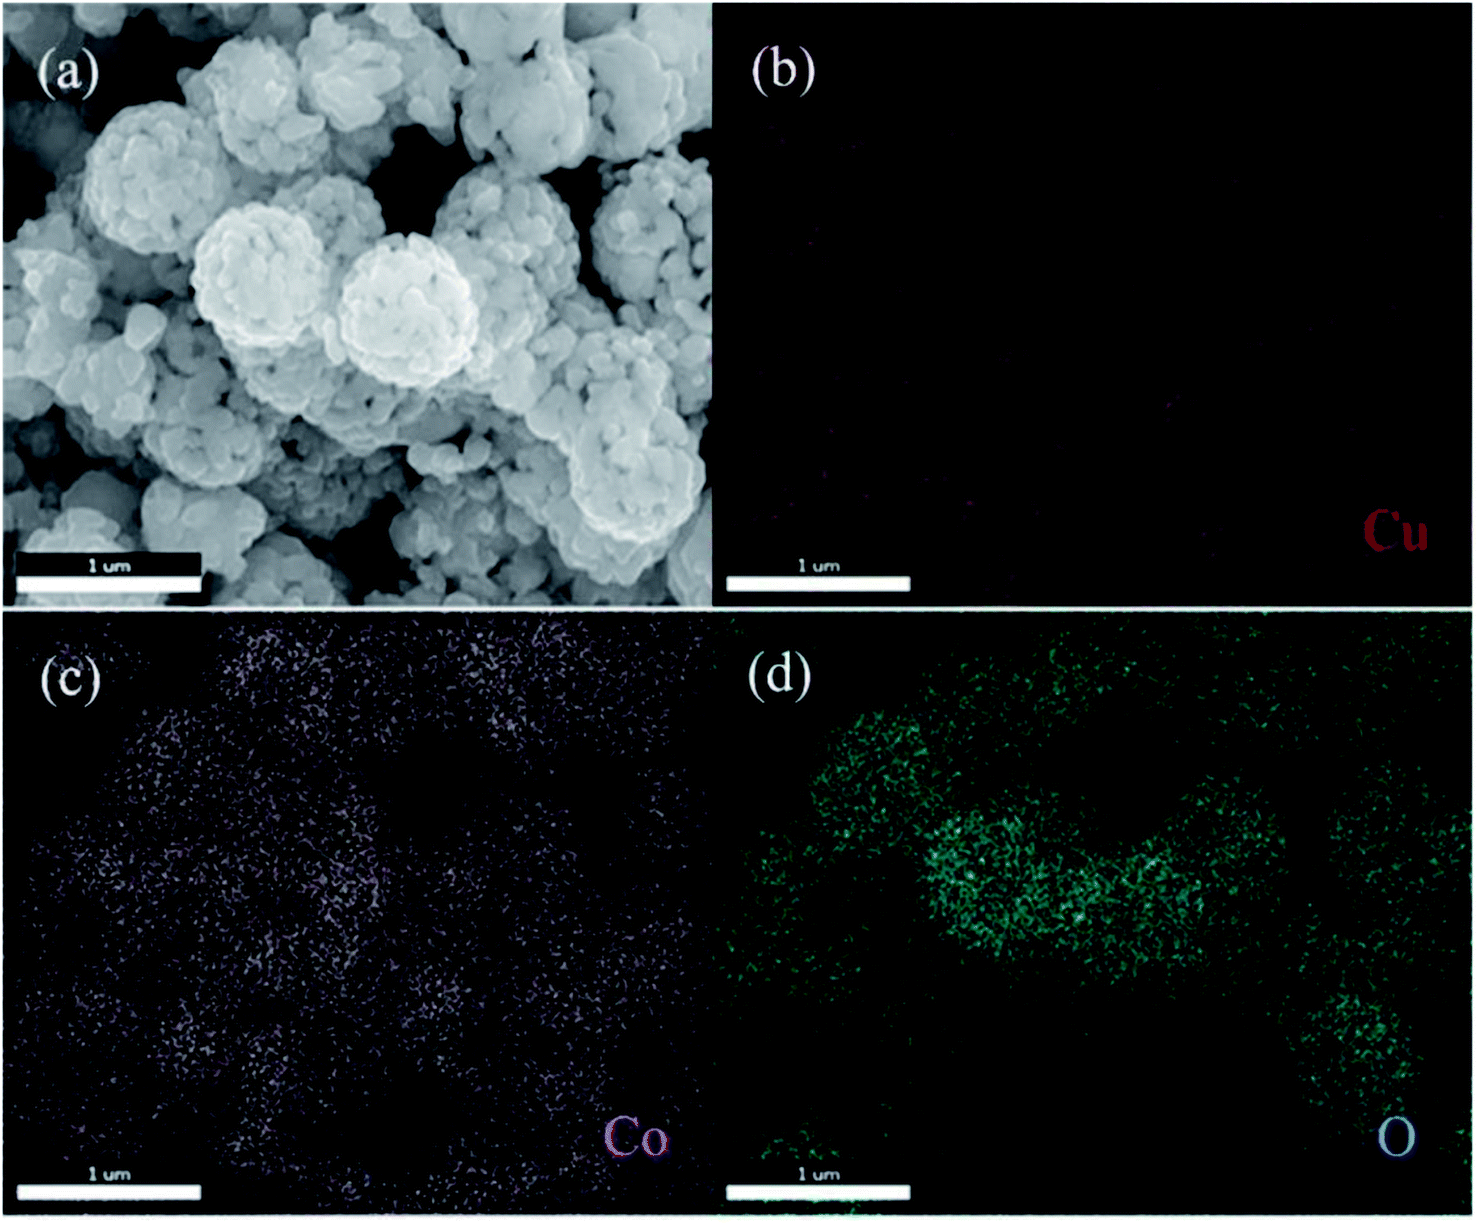
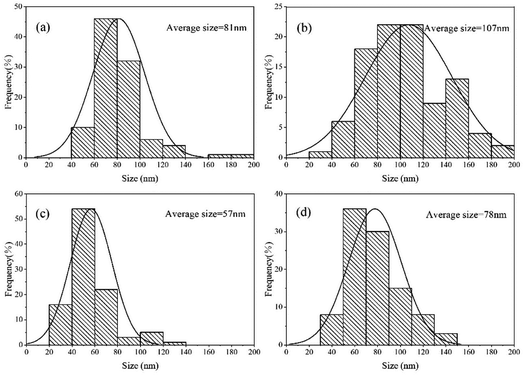
The scanning electron micrograph of the samples is shown in Fig. 2. The histogram of the particle size distribution based on the electron micrograph is shown in Fig. 3. The energy dispersive X-ray (EDX) of the sample is shown in Fig. 4. It can be observed from Fig. 2 that CuO and CuCo2O4 are dispersed nanoparticles, and the particles of (CuO)0.1–CuCo2O4 combine to form large particles, and some small particles are scattered on the surface of the large particles. As the proportion of CuO increases, the synthesized (CuO)0.2–CuCo2O4 composite oxide particles are tightly combined to form large spherical particles with uniform size. It can be seen from Fig. 3 that the average particle sizes of the CuO, CuCo2O4, (CuO)0.1–CuCo2O4, and (CuO)0.2–CuCo2O4 samples are 81 nm, 107 nm, 57 nm and 78 nm, respectively. To observe the element distribution, the EDX mapping test was carried out. From the EDX elemental mapping (Fig. 4), it can be seen that the Cu, Co, and O elements are evenly distributed in the sample.
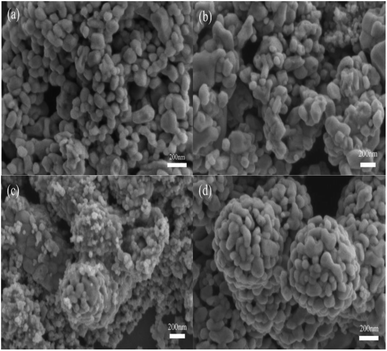 |
| | Fig. 2 SEM images of CuO (a), CuCo2O4 (b), (CuO)0.1–CuCo2O4 (c) and (CuO)0.2–CuCo2O4 (d) composite oxides. | |
 |
| | Fig. 3 Particle size distribution histogram of the CuO (a), CuCo2O4 (b), (CuO)0.1–CuCo2O4 (c) and (CuO)0.2–CuCo2O4 (d) composite oxides (from SEM). | |
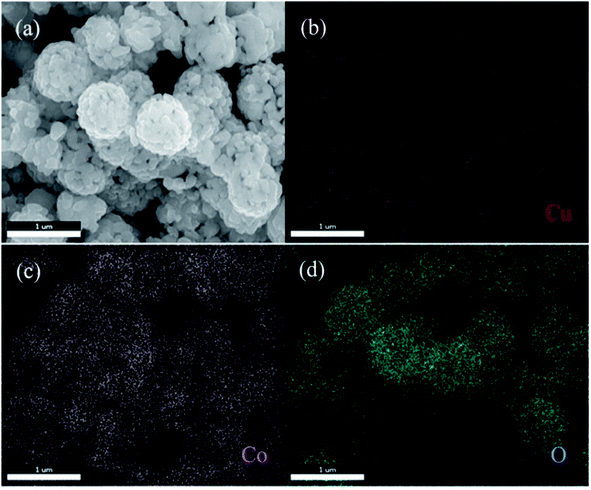 |
| | Fig. 4 EDX mapping for the (CuO)0.2–CuCo2O4 composite oxide. | |
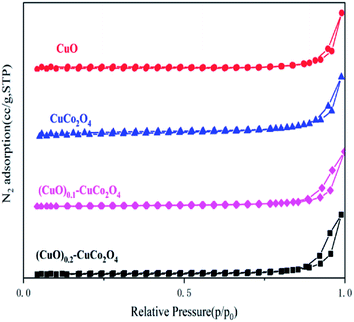
The BET results show that the surface areas of CuO, CuCo2O4, (CuO)0.1–CuCo2O4, and (CuO)0.2–CuCo2O4 were 3.1 m2 g−1, 7.6 m2 g−1, 10.5 m2 g−1, and 8.5 m2 g−1, respectively. Due to the high-temperature calcination of the samples during synthesis, there is a certain sintering phenomenon, resulting in a relatively low surface area of the samples. The adsorption isotherm diagram of the (CuO)x–CuCo2O4 composite oxides is shown in Fig. 5, and it can be seen from the figure that all samples show type IV isotherms. Moreover, type IV isotherms are typical of mesoporous materials.
 |
| | Fig. 5 N2 adsorption–desorption isotherm curves of all samples. | |
3.3. Raman analysis
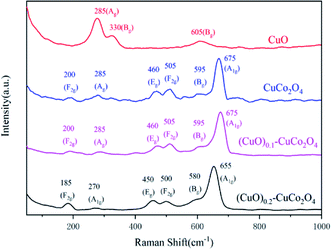
The Raman spectra of CuO and (CuO)x–CuCo2O4 (x = 0, 0.1, 0.2) composite oxides are shown in Fig. 6. CuO exhibits three Raman peaks at 285, 330, and 605 cm−1, which can be classified as the peak at 285 cm−1 as the Ag mode and the peaks at 330 and 605 cm−1 as the Bg mode.29 CuCo2O4 and (CuO)0.1–CuCo2O4 exhibit six Raman peaks at 200, 285, 460, 505, 595, and 675 cm−1; the peaks at 285 and 595 cm−1 are the Raman peaks of CuO, which also confirms that the composite oxide we synthesized contains a CuO phase. The peaks at 200 and 505 cm−1 are the F2g mode, the peak at 460 cm−1 is the Eg mode,30 and the peak at 675 cm−1 is the A1g mode.13 The Raman peak of the (CuO)0.2–CuCo2O4 composite oxide is the redshift based on the Raman peak of CuCo2O4. The addition of Cu may replace part of the Co, causing distortions in the Co–O bond and changes in the lattice parameters, which eventually lead to the redshift of the Raman spectrum.31,32
 |
| | Fig. 6 Raman spectra of all samples. | |
3.4. H2-TPR
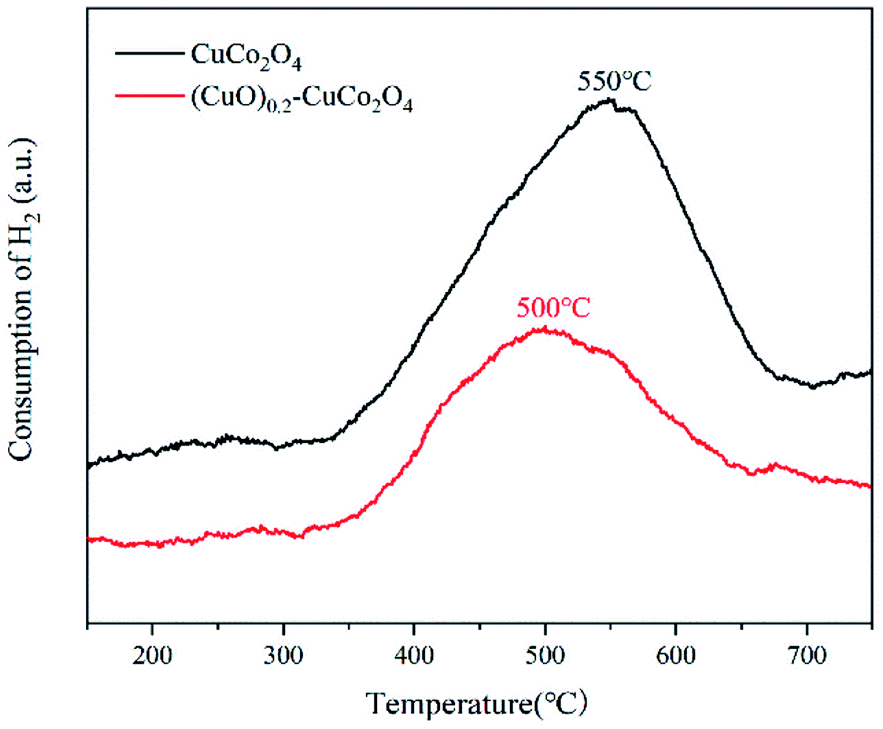
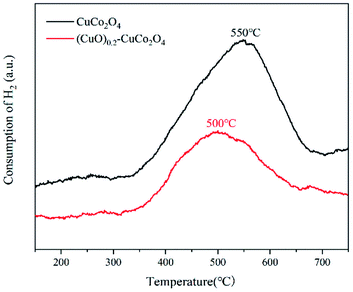
To demonstrate that there is not a simple physical mixing between CuO and CuCo2O4 and that the CuO phase was embedded in the CuCo2O4 phase inducing the synergistic effect, H2-TPR experiments were performed. The results are shown in Fig. 7, where CuCo2O4 has a broad reduction peak at 550 °C attributed to the reduction of the oxygen species in CuCo2O4. After the addition of copper oxide, the temperature of the (CuO)0.2–CuCo2O4 reduction peak was reduced to 500 °C. A strong interaction between CuO and CuCo2O4 was indicated. It shows that there is a strong interaction between CuO and CuCo2O4,33 maybe leading to the configuration structure of the CuCo2O4 distortion, which is beneficial to the exchange of oxygen in CuCo2O4.
 |
| | Fig. 7 H2-TPR spectra of CuCo2O4 and the (CuO)0.2–CuCo2O4 composite oxide. | |
3.5. XPS
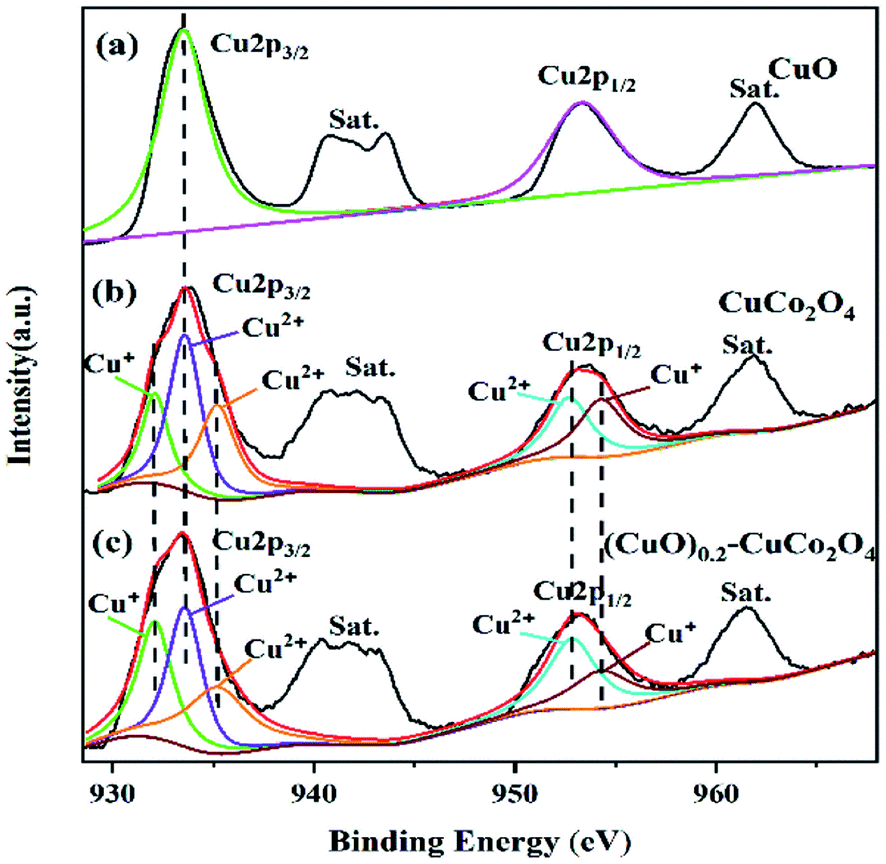
The surface composition and oxygen species of CuO, CuCo2O4, and the (CuO)0.2–CuCo2O4 composite oxide were further analyzed by the XPS technique. The XPS spectra of Cu 2p, O 1s, and Co 2p are shown in Fig. 8–10, respectively. All spectra showed the presence of Cu, Co, and O elements, which, together with the above XRD and Raman analyses, proved that we successfully synthesized (CuO)x–CuCo2O4 composite oxides.
 |
| | Fig. 8 XPS spectra of Cu 2p of CuO (a), CuCo2O4 (b) and the (CuO)0.2–CuCo2O4 composite oxide (c). | |
 |
| | Fig. 9 XPS spectra of O 1s of CuO (a), CuCo2O4 (b) and the (CuO)0.2–CuCo2O4 composite oxide (c). | |
 |
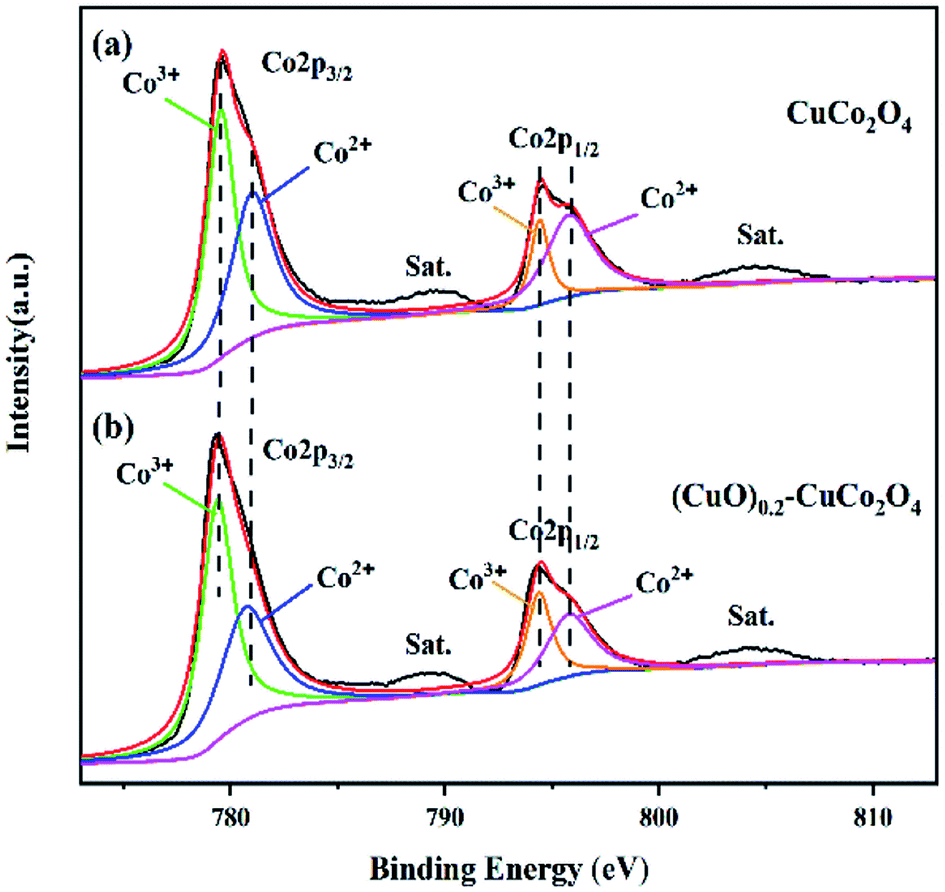
| | Fig. 10 XPS spectra of Co 2p of CuCo2O4 (a) and the (CuO)0.2–CuCo2O4 composite oxide (b). | |
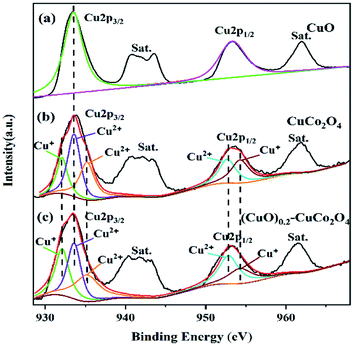
The Cu 2p spectra of CuO, CuCo2O4, and (CuO)0.2–CuCo2O4 are shown in Fig. 8. All of the Cu 2p spectra consist of Cu 2p3/2 peaks and Cu 2p1/2 peaks, each accompanied by numerous satellite peaks. In Fig. 8(a), the Cu 2p spectrum peaks of CuO at the binding energies of 933.5 and 953.3 eV are attributed to Cu 2p3/2 and Cu 2p1/2, respectively. The peaks of the Cu 2p spectrum of CuCo2O4 at the binding energies of 933.5 and 953.4 eV are Cu 2p3/2 and Cu 2p1/2, respectively. From Fig. 8(b), it can be observed that the Cu 2p3/2 spectrum consists of two peaks at 932.1 and 935.2 eV, corresponding to the tetrahedral Cu+ and Cu2+ ions,23 and the main peak at 933.6 eV, corresponding to the Cu2+ ions in CuO. The Cu 2p1/2 spectrum consists of two peaks at 952.7 and 954.3 eV correspond to the Cu2+ and Cu+ ions. In addition, there are many satellite peaks of divalent copper, which indicate that most of the copper ions in the Cu2+ ions are in the monoclinic tetrahedral cubic structure.34–37 As shown in Fig. 8(c), the Cu 2p spectrum of the (CuO)0.2–CuCo2O4 composite oxide is similar to that of CuCo2O4, and the positions of the peaks have not changed, only the ratio of Cu+/Cu2+ has changed. We calculated the ratio of Cu+/Cu2+ using XPS data, and the results are as follows: the ratio of Cu+/Cu2+ in CuCo2O4 is 0.48, and the ratio of Cu+/Cu2+ in the (CuO)0.2–CuCo2O4 composite oxide is 0.53. It can be seen that after adding CuO, the content of Cu+ increases, indicating that a redox reaction occurs between Cu+ and Cu2+, and more Cu2+ ions are converted into Cu+ ions. The CuO phase generated during the synthesis process promotes the redox between the Cu+ ions and Cu2+ ions, which may lead to an increase in the number of oxygen vacancies and enhance the activity of (CuO)0.2–CuCo2O4 to catalyze methane combustion.
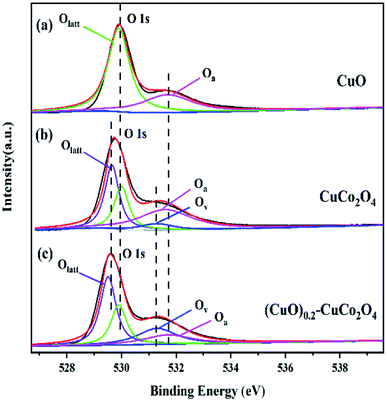
The above conclusions have also been verified in the O 1s spectra. The O 1s spectra of CuO, CuCo2O4, and (CuO)0.2–CuCo2O4 are shown in Fig. 9. The peaks in Fig. 9(a) at 529.9 and 531.6 eV are attributed to the lattice oxygen (Olatt) and the adsorbed oxygen species (Oa), respectively, on the surface of CuO.38 The CuCo2O4 O 1s spectrum peak (Fig. 9(b)) at the binding energy of 529.5 eV is associated with the chemical bonding between the oxygen atoms and metal atoms,39,40 and the peak at the binding energy of 531.3 eV is due to the oxygen (oxygen vacancies (Ov)) near the defect sites on the surface of CuCo2O4.41,42 As shown in Fig. 9(c), the change in the peak intensity of the binding energy at 531.3 eV in the O 1s spectrum of the (CuO)0.2–CuCo2O4 composite oxide can be attributed to the CuO phase generated during the synthesis process, increasing the oxygen vacancies on the surface of the (CuO)0.2–CuCo2O4 composite oxide. The increased oxygen vacancy is also one of the important reasons to improve the catalytic activity of the (CuO)0.2–CuCo2O4 composite oxide for methane combustion.
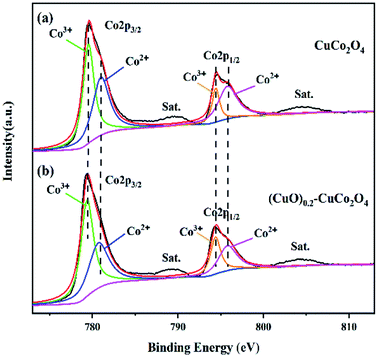
The Co 2p spectra of CuCo2O4 and the (CuO)0.2–CuCo2O4 composite oxide are shown in Fig. 10. The Co 2p spectrum (Fig. 10(a)) of CuCo2O4 has two peaks at the binding energies of 779.6 and 794.7 eV, which correspond to Co 2p3/2 and Co 2p1/2. They can be decomposed into two peaks, 779.5 and 794.4 eV, corresponding to Co3+ ions, and 781.3 and 795.9 eV, corresponding to Co2+ ions.15 As shown in Fig. 10(b), the Co 2p spectrum of the (CuO)0.2–CuCo2O4 composite oxide is the same as the Co 2p spectrum of CuCo2O4, which indicates that the CuO phase generated during the synthesis process has no significant effect on the state of the Co ions.
In summary, all the changes in the ion valence state prove that the (CuO)0.2–CuCo2O4 composite oxide has abundant surface valence states and defects on the surface, which can improve its catalytic activity for methane combustion.
3.6. Catalytic activity for methane combustion
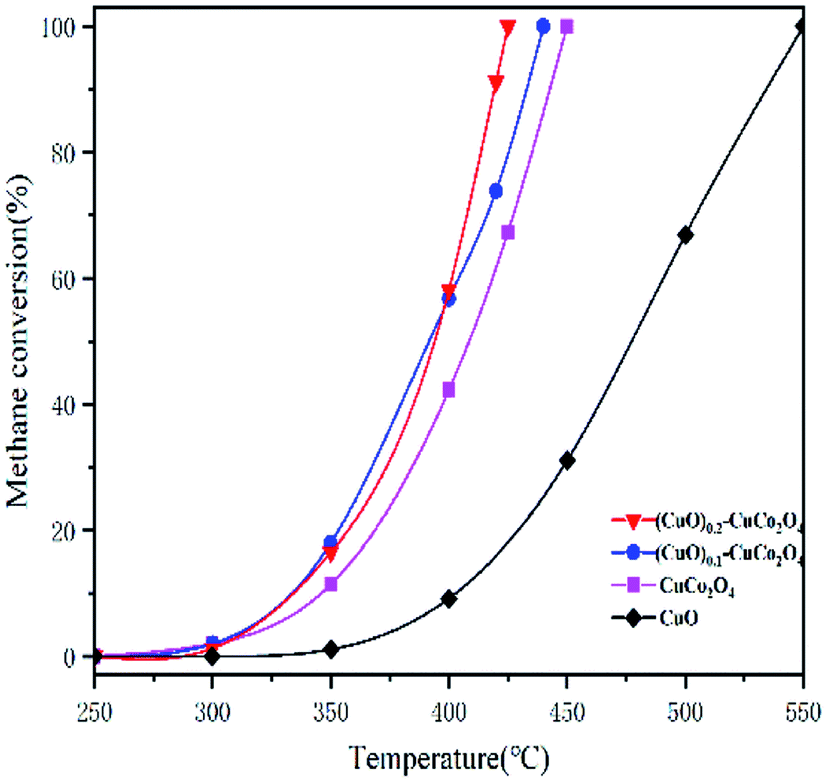
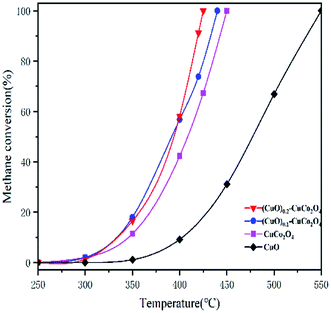
Catalytic methane combustion was performed to evaluate the catalytic performance of all samples, as shown in the light-off curves of Fig. 11. The methane combustion curve temperature as a function of reaction rate (calculated by the surface area reaction rate) is shown in Fig. 12. As listed in Table 1 (T10, T50 and T90, respectively, refer to the corresponding temperature when the methane conversion rate is 10%, 50% and 90%), CuO showed a poor catalytic activity and its T10 and T90 are 407 °C and 535 °C, respectively. The poor catalytic activity of the CuO sample is due to its weak oxygen exchange capacity and small surface area. The CuCo2O4 catalyst showed catalytic activity, and its T10 and T90 are 344 °C and 446 °C, respectively. The best methane catalytic performance belongs to (CuO)0.2–CuCo2O4, and its T10 and T90 are 331 °C and 423 °C, respectively. It can be seen from Fig. 12 that the (CuO)0.2–CuCo2O4 composite oxide has the fastest reaction rate. Fig. 11 and 12 together verify that the (CuO)0.2–CuCo2O4 composite oxide has the highest catalytic activity for methane combustion among all samples. The activity of (CuO)0.2–CuCo2O4 in catalyzing methane combustion is better than that of CuO and CuCo2O4, which indicates that CuO and CuCo2O4 have a synergistic effect in catalyzing methane combustion. According to the catalytic activity and XPS analysis, the CuO phase generated during the synthesis process increases the number of oxygen vacancies and oxygen exchange capacity on the surface of the (CuO)0.2–CuCo2O4 composite oxide, which is an important reason for improving the catalytic activity of (CuO)0.2–CuCo2O4 for methane combustion. There is literature showing that CuO has excellent methane adsorption capacity, which may also be one of the reasons for the increased activity of the (CuO)0.2–CuCo2O4 composite oxide to catalyze methane combustion.43 Table 2 shows the results of the catalytic methane combustion of different catalysts, and the (CuO)0.2–CuCo2O4 composites oxide still has excellent catalytic activity compared to these catalysts. In Table 2, the reaction conditions of various catalysts are different, so there is no way to make a direct comparison, only a rough comparison of their catalytic activities. Compared to a low concentration of methane, a high concentration of methane reflects the catalytic activity of our samples. The methane content in the reaction conditions of CoCr2O4 is 0.2%. It can be seen that T50 and T90 of CoCr2O4 are 392 °C and 464 °C, respectively. However, T50 and T90 of (CuO)0.2–CuCo2O4 are 386 °C and 423 °C, respectively, under the reaction conditions of the methane content of 2%, which is sufficient to demonstrate the excellent catalytic activity of the (CuO)0.2–CuCo2O4 composite oxide.
 |
| | Fig. 11 Light-off curves of methane combustion on CuO and (CuO)x–CuCo2O4 composite oxides. | |
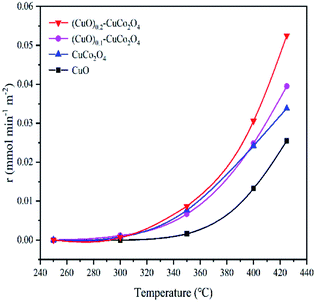 |
| | Fig. 12 Methane combustion curve temperature as a function of the reaction rate (calculated by the surface area reaction rate). | |
Table 1 T10, T50, and T90 of all (CuO)x–CuCo2O4 spinel samples
| Sample |
T10 (°C) |
T50 (°C) |
T90 (°C) |
| CuO |
407 |
455 |
535 |
| CuCo2O4 |
344 |
410 |
446 |
| (CuO)0.1–CuCo2O4 |
332 |
385 |
435 |
| (CuO)0.2–CuCo2O4 |
331 |
386 |
423 |
Table 2 Catalytic activity of various materials for methane combustion
| Catalyst |
T50 (°C) |
T90 (°C) |
Reaction conditions (GHSV) |
Reference |
| CoCr2O4 |
663 |
750 |
1% CH4 and 99% air (space velocity of 48000 mL g−1 h−1) |
12 |
| CoCr2O4 |
392 |
464 |
0.2% CH4/10% O2/N2 (space velocity of 36000 mL g−1 h−1) |
49 |
| CuO–CeO2 |
502 |
578 |
0.1% CH4/20% O2/Ar (space velocity of 78000 mL g−1 h−1) |
50 |
| CuCo2O4 |
410 |
446 |
2% CH4/26% O2/N2 (space velocity of 30000 mL g−1 h−1) |
This work |
| (CuO)0.2–CuCo2O4 |
386 |
423 |
2% CH4/26% O2/N2 (space velocity of 30000 mL g−1 h−1) |
This work |
As is well known, the CH4 oxidation reaction follows the Mars–van Krevelen mechanism.44,45 Fig. 13 depicts the possible mechanisms by which CuO and CuCo2O4 synergistically catalyze methane combustion. Most of the methane molecules are adsorbed to the CuO surface, and most of the oxygen molecules are adsorbed to the oxygen vacancies of CuCo2O4. The adsorbed methane and oxygen undergo a redox reaction at the contact surface of CuO and CuCo2O4 to produce water and carbon dioxide.33,46–48
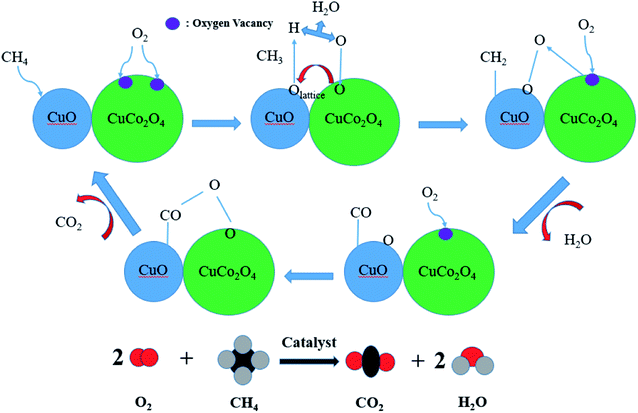 |
| | Fig. 13 The synergistic catalytic mechanism of methane combustion by CuO and CuCo2O4. | |
4. Conclusions
The (CuO)x–CuCo2O4 (x = 0, 0.1, 0.2) composite oxides synthesized by the solvothermal method have a lower light-off temperature and excellent catalytic activity for the catalytic combustion of methane. The reason for the excellent activity is that the CuO phase generated during the synthesis process not only increases the number of oxygen vacancies but also improves the oxygen exchange capacity. Numerous characterization techniques show that CuO and CuCo2O4 exhibit a synergistic effect when catalyzing the combustion of methane, which increases the oxidation rate of methane on the surface of the (CuO)0.2–CuCo2O4 composite oxides and makes the catalytic combustion reaction of methane easier to occur. The preparation method of the (CuO)x–CuCo2O4 catalyst is simple, and the raw materials are easily available and low in price. This has certain application prospects in future industrial production.
Author contributions
Shao Xiaoqiang: methodology, investigation, writing – original draft, writing – review & editing, validation. He Jia: investigation. Su Qin: formal analysis. Zhao Donglin: review & editing, resources. Feng Shaojie: writing – review & editing, resources.
Conflicts of interest
The authors have no conflicts to declare.
Acknowledgements
This work was supported by the National Key R&D Program of China (2019YFE03070001); the Key Research and Development Project of Anhui Province (201904b11020041) and the University Synergy Innovation Program of Anhui Province (GXXT-2020-009).
References
- M. Cargnello, J. J. D. Jaen, J. C. H. Garrido, K. Bakhmutsky, T. Montini, J. J. C. Gamez, R. J. Gorte and P. Fornasiero, Science, 2012, 337, 713–717 CrossRef CAS PubMed.
- A. K. Neyestanaki, F. Klingstedt, T. Salmi and D. Y. Murzin, Fuel, 2004, 83, 395–408 CrossRef CAS.
- M. Hussain, F. A. Deorsola, N. Russo, D. Fino and R. Pirone, Fuel, 2015, 149, 2–7 CrossRef CAS.
- W. Cui, S. Li, D. Wang, Y. Deng and Y. Chen, Catal. Commun., 2019, 119, 86–90 CrossRef CAS.
- E. Kockrick, L. Borchardt, C. Schrage, C. Gaudillere, C. Ziegler, T. Freudenberg, D. Farrusseng, A. Eychmüller and S. Kaskel, Chem. Mater., 2010, 23, 57–66 CrossRef.
- P. J. Jodlowski, R. J. Jedrzejczyk, D. K. Chlebda, A. Dziedzicka, L. Kuterasinski, A. Gancarczyk and M. Sitarz, Nanomaterials, 2017, 7, 174 CrossRef PubMed.
- H. Wang, C. Chen, Y. Zhang, L. Peng, S. Ma, T. Yang, H. Guo, Z. Zhang, D. S. Su and J. Zhang, Nat. Commun., 2015, 6, 7181 CrossRef CAS PubMed.
- L. Shi, W. Chu, F. Qu and S. Luo, Catal. Lett., 2007, 113, 59–64 CrossRef CAS.
- G. Águila, F. Gracia, J. Cortés and P. Araya, Appl. Catal., B, 2008, 77, 325–338 CrossRef.
- X. Du, G. Zou, Y. Zhang and X. Wang, J. Mater. Chem. A, 2013, 1, 8411–8416 RSC.
- D. V. Ivanov, L. G. Pinaeva, L. A. Isupova, E. M. Sadovskaya, I. P. Prosvirin, E. Y. Gerasimov and I. S. Yakovleva, Appl. Catal., A, 2013, 457, 42–51 CrossRef CAS.
- J. Hu, W. Zhao, R. Hu, G. Chang, C. Li and L. Wang, Mater. Res. Bull., 2014, 57, 268–273 CrossRef CAS.
- G. Ercolino, P. Stelmachowski, A. Kotarba and S. Specchia, Top. Catal., 2017, 60, 1370–1379 CrossRef CAS.
- S. Li and X. Wang, Catal. Commun., 2007, 8, 410–415 CrossRef CAS.
- Y. F. Zheng, Y. Liu, H. Zhou, W. Z. Huang and Z. Y. Pu, J. Alloys Compd., 2018, 734, 112–120 CrossRef CAS.
- Y. Dai, V. P. Kumar, C. Zhu, H. Wang, K. J. Smith, M. O. Wolf and M. J. MacLachlan, Adv. Funct. Mater., 2019, 29, 1807519 CrossRef.
- T. H. Lim, S. B. Park, J. M. Kim and D. H. Kim, J. Mol. Catal. A: Chem., 2017, 426, 68–74 CrossRef CAS.
- G. Ercolino, G. Grzybek, P. Stelmachowski, S. Specchia, A. Kotarba and V. Specchia, Catal. Today, 2015, 257, 66–71 CrossRef CAS.
- A. T. A. Ahmed, B. Hou, H. S. Chavan, Y. Jo, S. Cho, J. Kim, S. M. Pawar, S. Cha, A. I. Inamdar, H. Kim and H. Im, Small, 2018, 14, e1800742 CrossRef PubMed.
- P. Paknahad, M. Askari and M. Ghorbanzadeh, J. Power Sources, 2014, 266, 79–87 CrossRef CAS.
- Y. Sharma, N. Sharma, G. V. S. Rao and B. V. R. Chowdari, J. Power Sources, 2007, 173, 495–501 CrossRef CAS.
- S. Zhao, Q. Li, F. Li and Z. Liang, J. Sol-Gel Sci. Technol., 2016, 81, 544–555 CrossRef.
- D. Lan, M. Qin, R. Yang, S. Chen, H. Wu, Y. Fan, Q. Fu and F. Zhang, J. Colloid Interface Sci., 2019, 533, 481–491 CrossRef CAS PubMed.
- S.-y. Zhen, H.-t. Wu, Y. Wang, N. Li, H.-s. Chen, W.-l. Song, Z.-h. Wang, W. Sun and K.-n. Sun, RSC Adv., 2019, 9, 16288–16295 RSC.
- L. F. Liotta, H. Wu, G. Pantaleo and A. M. Venezia, Catal. Sci. Technol., 2013, 3, 3085–3102 RSC.
- S. S. Acharyya, S. Ghosh, R. Tiwari, B. Sarkar, R. K. Singha, C. Pendem, T. Sasaki and R. Bal, Green Chem., 2014, 16, 2500–2508 RSC.
- L. Hu, Q. Peng and Y. Li, J. Am. Chem. Soc., 2008, 130, 16136–16137 CrossRef CAS PubMed.
- W. Huang, W. W. Zha, D. L. Zhao and S. J. Feng, Solid State Sci., 2019, 87, 49–52 CrossRef CAS.
- J. F. Xu, W. Ji, Z. X. Shen, W. S. Li, S. H. Tang, X. R. Ye, D. Z. Jia and X. Q. Xin, J. Raman Spectrosc., 1999, 30, 413–415 CrossRef CAS.
- N. Bahlawane, P. H. Ngamou, V. Vannier, T. Kottke, J. Heberle and K. Kohse-Hoinghaus, Phys. Chem. Chem. Phys., 2009, 11, 9224–9232 RSC.
- J. Bian, Y. Feng, T. Liu, S. Chen, S. Zhu, H. Tong, N. Liu, W. Tong and H. Liu, J. Supercond. Novel Magn., 2020, 33, 1773–1780 CrossRef CAS.
- C. S. Erhardt, L. E. Caldeira, J. Venturini, S. R. Bragança and C. P. Bergmann, Ceram. Int., 2020, 46, 12759–12766 CrossRef CAS.
- S. S. Acharyya, S. Ghosh, R. Tiwari, C. Pendem, T. Sasaki and R. Bal, ACS Catal., 2015, 5, 2850–2858 CrossRef CAS.
- N. Chawla, A. Chamaani, M. Safa and B. El-Zahab, J. Electrochem. Soc., 2016, 164, A6303–A6307 CrossRef.
- S. Xu, Y. Yao, Y. Guo, X. Zeng, S. D. Lacey, H. Song, C. Chen, Y. Li, J. Dai, Y. Wang, Y. Chen, B. Liu, K. Fu, K. Amine, J. Lu and L. Hu, Adv. Mater., 2018, 30, 1704907 CrossRef PubMed.
- Y. Li, Y. Xu, W. Yang, W. Shen, H. Xue and H. Pang, Small, 2018, 14, e1704435 CrossRef PubMed.
- S. S. Acharyya, S. Ghosh, S. Adak, T. Sasaki and R. Bal, Catal. Sci. Technol., 2014, 4, 4232–4241 RSC.
- Z. Wang, R. Li and Q. Chen, Chemphyschem, 2015, 16, 2415–2423 CrossRef CAS PubMed.
- H. Yang, Y. Liu, S. Luo, Z. Zhao, X. Wang, Y. Luo, Z. Wang, J. Jin and J. Ma, ACS Catal., 2017, 7, 5557–5567 CrossRef CAS.
- K.-L. Yan, X. Shang, Z.-Z. Liu, B. Dong, S.-S. Lu, J.-Q. Chi, W.-K. Gao, Y.-M. Chai and C.-G. Liu, Int. J. Hydrogen Energy, 2017, 42, 24150–24158 CrossRef CAS.
- S. Vijayakumar, S.-H. Lee and K.-S. Ryu, Electrochim. Acta, 2015, 182, 979–986 CrossRef CAS.
- J. Cui, X. Zhang, L. Tong, J. Luo, Y. Wang, Y. Zhang, K. Xie and Y. Wu, J. Mater. Chem. A, 2015, 3, 10425–10431 RSC.
- Y. F. Lu, F. C. Chou, F. C. Lee, C. Y. Lin and D. H. Tsai, J. Phys. Chem. C, 2016, 120, 27389–27398 CrossRef CAS.
- W. Qi, J. Ran, Z. Zhang, J. Niu, P. Zhang, L. Fu, B. Hu and Q. Li, Appl. Surf. Sci., 2018, 435, 776–785 CrossRef CAS.
- M. Chrzan, D. Chlebda, P. Jodłowski, E. Salomon, A. Kołodziej, A. Gancarczyk, M. Sitarz and J. Łojewska, Top. Catal., 2019, 62, 403–412 CrossRef CAS.
- X. Tang, B. Zhang, Y. Li, Y. Xu, Q. Xin and W. Shen, Appl. Catal., A, 2005, 288, 116–125 CrossRef CAS.
- I. V. Desyatykh, A. A. Vedyagin, I. V. Mishakov and Y. V. Shubin, Appl. Surf. Sci., 2015, 349, 21–26 CrossRef CAS.
- M. Flytzanistephanopoulos and W. Liu, J. Catal., 1995, 153, 304–316 CrossRef.
- J. Chen, X. Zhang, H. Arandiyan, Y. Peng, H. Chang and J. Li, Catal. Today, 2013, 201, 12–18 CrossRef CAS.
- A. F. Zedan and A. S. AlJaber, Materials, 2019, 12, 878 CrossRef CAS PubMed.
|
| This journal is © The Royal Society of Chemistry 2022 |
Click here to see how this site uses Cookies. View our privacy policy here. 
 Open Access Article
 This Open Access Article is licensed under a Creative Commons Attribution-Non Commercial 3.0 Unported Licence
 *ab
*ab