DOI:
10.1039/D2RA00222A
(Paper)
RSC Adv., 2022,
12, 7506-7515
Optimization of dialdehyde soluble soybean polysaccharide: preparation by response surface methodology for cleaner leather tanning†
Received
12th January 2022
, Accepted 14th February 2022
First published on 7th March 2022
Abstract
Leather is widely used in daily necessities, such as shoes and bags. Traditional chrome tanning might produce leathers with excellent mechanical and thermal properties but gives rise to problems, such as environmental pollution. To find an ecological alternative for chrome-tanning agents, soluble soybean polysaccharide (SSPS) was oxidized by sodium periodate to yield dialdehyde soluble soybean polysaccharide (DPA). By the response surface methodology (RSM)-based optimization of the preparation process, DPA was obtained at the optimized condition at the mass ratio of 1![[thin space (1/6-em)]](https://www.rsc.org/images/entities/char_2009.gif) :1.9, oxidation time of 0.53 h, and oxidation temperature of 20 °C, and the hydrothermal shrinkage temperature of the DPA-tanned leather reached 79 °C. The Fourier transform infrared (FT-IR) spectra and gel permeation chromatography (GPC) showed that the aldehyde group was successfully introduced, and the molecular weight was significantly reduced. The DPA-tanned leather has good collagen fiber dispersion and mechanical properties and thus is suggested to be a green tanning agent for leather making.
:1.9, oxidation time of 0.53 h, and oxidation temperature of 20 °C, and the hydrothermal shrinkage temperature of the DPA-tanned leather reached 79 °C. The Fourier transform infrared (FT-IR) spectra and gel permeation chromatography (GPC) showed that the aldehyde group was successfully introduced, and the molecular weight was significantly reduced. The DPA-tanned leather has good collagen fiber dispersion and mechanical properties and thus is suggested to be a green tanning agent for leather making.
1. Introduction
Leather production is a sustainable industry, which transforms the by-product of the meat industry, the raw skins/hides, into high-value-added natural materials.1,2 Nowadays, with the increasing demand for clean and sustainable production of leather, the use of eco-friendly chemicals has gained wide attention.3–5 Traditional chrome tanning still plays a vital role in making leather due to its excellent tanning performance.6 However, trivalent chromium-containing wastewater and solid waste are inevitably generated because of the large amounts of the chrome-tanning agent used. Highly toxic hexavalent chromium might be formed by the oxidization of trivalent chromium in leathers and tannery wastewater, which are harmful to the ecology of the environment and human beings. For this reason, the regulations and restrictions on chromium discharge are becoming stringent by the day.7–10 In China, the discharge standard for total chromium in tannery wastewater is 1.5 mg L−1, and tannery solid wastes have been included in the national hazardous waste list. The EU has stipulated that the hexavalent chromium content in leather products should be below 3 mg kg−1.6 Therefore, the development of chrome-free tanning agents is of great significance for the sustainable development of the leather industry. At present, aldehyde tanning agents (formaldehyde, modified glutaraldehyde, oxazolidine, and organic phosphine), metal tanning agents (zirconium salts, aluminum salts, titanium salts), and vegetable tanning agents have been reported to partly replace the chrome tanning agent.11,12 However, some shortcomings do exist for them to completely replace chrome tanning, such as the release of free formaldehyde and poor tanning effect. Therefore, their application is still limited.13,14
Soluble soybean polysaccharide (SSPS) is a kind of biopolymer from the soybean dreg fiber, a by-product obtained during the making of soybean products, such as tofu and soybean milk. Because it is a rich resource with non-toxicity and low cost, it has found applications in many fields. If a high-value application is found, the problem of solid waste can be solved and economic benefits might be obtained. SSPS is strong in emulsification and can be used as a stabilizer to inhibit the precipitation of protein in yogurt. Its good film-forming and adhesion properties suggest that it can be a green packaging material.15–17 There are plenty of hydroxyl groups in SSPS, which can be oxidized by sodium periodate to form aldehyde groups.17–19 In our previous work, pullulan dialdehyde (PDA)-crosslinked gelatin hydrogels were prepared20 using the reaction mechanism of the aldehyde group in the polysaccharides with the amino group of gelatin to form a stable cross-linking bond. Sodium periodate was used to oxidize polysaccharides, such as sodium alginate, starch, and carboxymethyl cellulose, and the dialdehyde polysaccharide was used as a green tanning agent for leather processing.2,21–23
Both the molecular weight distribution and aldehyde group content of the polysaccharide might affect the tanning effect. Further, the structure of the dialdehyde polysaccharide might vary with the oxidant dosage, oxidation time, and oxidation temperature. Therefore, the optimization of oxidation conditions is needed to obtain a green DPA tanning agent. The tanning effect is usually evaluated from viewpoint of the hydrothermal shrinkage temperature of the tanned leather, which is the only index to determine whether the skin/hide is successfully tanned.
Response Surface Methodology (RSM) is an effective statistical method for optimizing conditions by designing experiments and building models. With fewer experiments, the performance of the product can be predicted, greatly improving the production efficiency. According to experimental data, the response surface is fitted to obtain the limited value.24 Because less time, money, and manpower are needed, the Box–Behnken design (BBD) can be used to study the relationship between the various factors.25 Besides, the limitations of traditional methods can be overcome by the response surface statistical optimization method to explore the relationships between the affecting factors by fitting the data to linear regression equations. Therefore, it is widely used in the experimental design and optimization of wastewater treatment, organic synthesis, food science, and other fields.26,27 In 2019, the response surface method was reported to successfully optimize the use of sodium sulfide in the beam house of leather manufacturing to greatly reduce pollution in wastewater.1 However, no report is available regarding the effect of oxidation conditions on the hydrothermal shrinkage temperature of DPA-tanned leather. To determine the variation range of BBD, the classical univariate method was used in this work to systematically study the effects of oxidation time, oxidation temperature, and the amount of sodium periodate on the hydrothermal shrinkage temperature of DPA-tanned leather.
The regression model for the hydrothermal shrinkage temperature of leather was established by the BBD method after analyzing the relationship between the independent variables and dependent variables. The effects of variables on the hydrothermal shrinkage temperature of DPA-tanned leather were studied by experiments and response surface simulation, which provided useful information for the optimization of oxidation conditions. The dispersion of collagen fibers in leather was observed by scanning electron microscopy, and the chemical characteristics of DPA, such as aldehyde content, molecular weight, and FT-IR, were analyzed. The relationship between the structure of DPA and its tanning effect is discussed.
2. Materials and methods
2.1 Materials
Pickled sheepskin was purchased from Henan Prosper Skins & Leather Enterprise Co., Ltd, Henan, China. SSPS was kindly provided by Jinjing Bio. Co. Ltd., Pingdingshan, Henan, China. Sodium periodate was purchased from Macklin Biochemical Co., Lt. Shanghai, China. The reagents used for analysis were of analytical grade, and the chemicals used for pickled sheepskin processing were of commercial grade. Deionized water was produced in our laboratory using a Mill-Q water purification system (Millipore, USA).
2.2 Preparation of DPA
2.0 g SSPS was dissolved in 50 mL distilled water, and then a certain mass ratio of sodium periodate was added with magnetic stirring in the dark. The reaction mechanism is shown in Scheme 1(A). Oxidation was allowed to take place at different times and temperatures, and the reaction was terminated by adding equimolar ethylene glycol to sodium periodate with stirring for 0.5 h. The DPA solution was directly used for tanning and lyophilized to yield a powdery sample for further analysis.
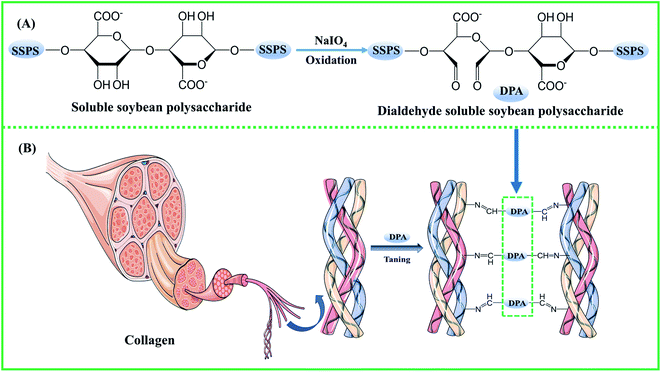 |
| | Scheme 1 Scheme of DPA preparation and its application in cross-linking collagen. | |
2.3 Tanning
8% DPA solution and 6% sodium chloride (% based on the weight of pickled sheepskin, same hereafter) were added in a 250 mL flask on a shaker to yield the tanning solution. A piece of pickled sheepskin was dropped into the flask and tanned for 4 h, and then the pH of the tanning solution was adjusted to 7.5–8.0 with 10 g L−1 sodium bicarbonate three times at intervals of 15 min. After shaking for 4 h at 40 °C, the flask was allowed to stand for 12 h to allow sufficient tanning. The resultant tanned leather was finally washed under running water at room temperature for 10 min and then piled. The tanning mechanism is shown in Scheme 1(B). The hydrothermal shrinkage temperature and morphology of the samples were studied. The tanning processes with zirconium (Zr(SO4)2·4H2O, 5%) and chromium (basic chromium sulfate, 6%) were similar to that with DPA, except that the pH of the tanning solution was adjusted to 4. The detailed fatliquoring processes are presented in Table S1.†
2.4 Hydrothermal shrinkage temperature
The hydrothermal shrinkage temperature indicates the tanning degree and hydrothermal stability of leather; this was measured and recorded using a digital leather shrinkage temperature instrument (MSW-YD4, Shaanxi University of Science and Technology, China). The heating rate was 2.0 ± 0.2 °C min−1.
2.5 Establishment of the RSM model for the hydrothermal shrinkage temperature
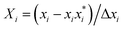
RSM was used as an experimental design model to optimize the key process parameters that influence the hydrothermal shrinkage temperature of leather tanned with DPA. Three independent process variables, i.e., oxidation time (A), oxidation temperature (B), and sodium periodate dosage (C), were chosen to investigate the hydrothermal shrinkage temperature of leather. In the regression equation, the relationship between the coded and actual values was described according to eqn (1):| |
 | (1) |
where Xi is the coded value of the independent variable, xi is the uncoded value of the independent variable,  is the uncoded value of the independent variable at the center point, and Δxi is the step change value. This model has coded a three-level factorial (−1, 0, and 1), which was superimposed by the center points (coded 0). The range of design factors was set according to the range of oxidation time, oxidation temperature, and sodium periodate dosage for the oxidation of the green tanning agent DPA. The experimental data were fitted to a second-order polynomial model according to eqn (2):
| |
 | (2) |
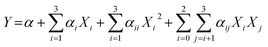
where Y is the predicted response, Xi and Xj are the variables in coded values, α is the constant coefficient. αi, αii and αij are the linear effect, squared effect, and interaction effect, respectively. A statistical and graphical analysis software (Box–Behnken design of Design Expert 10.0) was employed to analyze the experimental data and to reveal the relationship among the different oxidation conditions.
2.6 Fourier transform infrared (FT-IR) spectroscopy
The Fourier transform infrared (FT-IR) spectra of SSPS and its oxidized products (DPA) were recorded using an FT-IR spectrometer (Nicolet iS10, Thermo Scientific, USA). The samples were pressed as pellet KBr and scanned in the range of 500–4000 cm−1 at room temperature, with 32 scans and a resolution of 4 cm−1.
2.7 Analysis of the aldehyde group of DPA
Potentiometric titration with hydroxylamine hydrochloride sodium hydroxide was used to determine the aldehyde group content in lyophilized DPA, according to a reported method.28
2.8 Determination of molecular weight
The molecular weight of SSPS and its oxidized products (DPA) were determined by gel permeation chromatography (GPC) with TSKgelG5000PWXL (Tosoh Corporation, Japan). 0.1 g dried sample was completely dissolved in phosphate buffer saline (PBS) and then filtered using a 0.22 μm pore membrane to eliminate dust particles. The concentration of the samples was 5 mg mL−1, and an injection volume of 20 μL was employed. The mobile phase was 0.1 mol L−1 PBS at a flow rate of 0.6 mL min−1.20
2.9 Mechanical properties
The DPA-tanned leathers were cut into the shape of dumbbells (GB/T-52, Kunshan Creator Testing Instrument Co. Ltd., China) to yield the leather samples. After being air-conditioned at a relative humidity of 60 ± 5% for 48 h,29 the mechanical properties of the samples were measured using an SMSTA.XT Plus Texture analyzer (Lotun Science Co. Ltd., British).
2.10 Scanning electron microscopy (SEM)
The leather samples were lyophilized after tanning. After gold-spraying at the accelerating voltage of 10 kV, both the cross-section and surface of the DPA-tanned leather samples were observed by scanning electron microscopy (S4800, Hitachi, Japan).
3. Results and discussion
3.1 Effect of oxidation conditions on the hydrothermal shrinkage temperature of tanned leathers
The effects of oxidation time, oxidation temperature, sodium periodate dosage, and pH on the hydrothermal shrinkage temperature of DPA-tanned leathers are shown in Fig. 1. In Fig. 1a, the hydrothermal shrinkage temperature is the highest at the oxidation time of 1 h. The oxidation time of DPA was less than those of reported polysaccharides at 4 h, 12 h, or even 24 h.21,22,30 As shown in Fig. 1b, at the oxidation temperature of 10–30 °C, no obvious difference was found in the hydrothermal shrinkage temperature of the leather. With a further increase in the temperature, the hydrothermal shrinkage temperature decreased, which might be explained by the fact that high temperatures lead to the decomposition of sodium periodate, reducing the oxidation effect. Fig. 1c shows that the hydrothermal shrinkage temperature of the tanned leather increased obviously with the increase in sodium periodate dosage from 1:0.2 to 1:1. Further increasing the oxidant dose from 1:1 to 1:8 produced no obvious increase in the hydrothermal shrinkage temperature. Based on Fig. 1d, the pH of the solution slightly affects the hydrothermal shrinkage temperature of the tanned leathers. The hydrothermal shrinkage temperature of the DPA-tanned leather reached 79 °C, which is higher than those of oxidized starch-tanned leather (61 °C)18 and dialdehyde cellulose-tanned leather (74 °C)22 and lower than those of sodium dialdehyde sodium alginate-tanned leather (88.6 °C), dialdehyde tara gum-tanned leather (86.7 °C), dialdehyde starch-tanned leather (83.9 °C), and dialdehyde cyclodextrin-tanned leather (82.0 °C).21 The hydrothermal shrinkage temperature of leather is closely related to the oxidation conditions and the structure of the polysaccharides. Crosslinking between the amino acids in the collagen and the aldehyde in DPA is diagrammatically shown in Scheme 1. The crosslinking between DPA and the functional groups of collagen results in the difference in the hydrothermal stability of leathers. The molecular weight of the polysaccharide might affect its penetration into the collagenous fiber matrix, and the content of the aldehyde group affects cross-linking with collagen.
 |
| | Fig. 1 Effects of (a) oxidation time, (b) oxidation temperature, (c) sodium periodate dosage, and (d) pH on the hydrothermal shrinkage temperature of DPA-tanned leather. | |
3.2 Hydrothermal shrinkage temperature by RSM modeling
The actual values and corresponding predicted values obtained by the response surface Box–Behnken design are shown in Table 1. The analysis of variance (ANOVA) was performed on the hydrothermal shrinkage temperature model using the Design-Expert software, and the significance and accuracy of the quadratic correlation equations of the regression model were evaluated.
Table 1 The response surface experimental design and results
| Run |
Coded |
Actual |
Response Y (Ts/°C) |
| X1 |
X2 |
X3 |
x1 |
x2 |
x3 |
Actual value |
Predicted value |
| 1 |
−1 |
−1 |
0 |
1 |
10 |
1 |
74.53 |
73.95 |
| 2 |
0 |
−1 |
1 |
2 |
10 |
1.8 |
78.47 |
78.76 |
| 3 |
−1 |
0 |
−1 |
1 |
30 |
0.2 |
59.17 |
59.44 |
| 4 |
0 |
1 |
−1 |
2 |
50 |
0.2 |
56.00 |
55.70 |
| 5 |
−1 |
1 |
0 |
1 |
50 |
1 |
70.00 |
70.03 |
| 6 |
0 |
0 |
0 |
2 |
30 |
1 |
73.07 |
73.55 |
| 7 |
0 |
0 |
0 |
2 |
30 |
1 |
73.70 |
73.55 |
| 8 |
−1 |
0 |
1 |
1 |
30 |
1.8 |
78.90 |
79.18 |
| 9 |
1 |
0 |
1 |
3 |
30 |
1.8 |
77.40 |
77.12 |
| 10 |
1 |
1 |
0 |
3 |
50 |
1 |
68.00 |
68.57 |
| 11 |
0 |
−1 |
−1 |
2 |
10 |
0.2 |
59.87 |
60.18 |
| 12 |
1 |
−1 |
0 |
3 |
10 |
1 |
73.23 |
73.21 |
| 13 |
0 |
0 |
0 |
2 |
30 |
1 |
73.83 |
73.55 |
| 14 |
1 |
0 |
−1 |
3 |
30 |
0.2 |
59.60 |
59.30 |
| 15 |
0 |
1 |
1 |
2 |
50 |
1.8 |
75.00 |
74.68 |
| 16 |
0 |
0 |
0 |
2 |
30 |
1 |
73.50 |
73.55 |
| 17 |
0 |
0 |
0 |
2 |
30 |
1 |
73.67 |
73.55 |
In Table 2, the “F-value” of 387.35 with a low “Prob > F” indicates the high significance of the model. Besides, the values of “Prob > F” of A, B, C, B2, and C2 were less than 0.05, indicating the significance of the model terms. The values of “Prob > F” of AB, AC, BC, A2, and “Lack of Fit” were higher than 0.05, indicating the non-significance of the model terms.24,31 Furthermore, the “Lack of Fit” showed an “F-value” of 5.19, suggesting that the term was not significant relative to the pure error and indicating the effectiveness of the quadratic model.32
Table 2 ANOVA results of the response surface quadratic model for hydrothermal shrinkage temperature
| Source |
Sum of squares |
df |
|
F value |
p-value, Prob > F |
Status |
| Model |
847.82 |
9.00 |
94.20 |
387.35 |
<0.0001 |
Significant |
| A-time |
2.39 |
1.00 |
2.39 |
9.82 |
0.0165 |
Significant |
| B-temperature |
36.55 |
1.00 |
36.55 |
150.29 |
<0.0001 |
Significant |
| C-dosage |
705.56 |
1.00 |
705.56 |
2901.18 |
<0.0001 |
Significant |
| AB |
0.12 |
1.00 |
0.12 |
0.50 |
0.5008 |
Not significant |
| AC |
0.93 |
1.00 |
0.93 |
3.83 |
0.0912 |
Not significant |
| BC |
0.04 |
1.00 |
0.04 |
0.16 |
0.6972 |
Not significant |
| A2 |
0.49 |
1.00 |
0.49 |
2.01 |
0.1992 |
Not significant |
| B2 |
13.24 |
1.00 |
13.24 |
54.44 |
0.0002 |
Significant |
| C2 |
83.22 |
1.00 |
83.22 |
342.19 |
<0.0001 |
Significant |
| Residual |
1.70 |
7.00 |
0.24 |
|
|
|
| Lack of fit |
1.35 |
3.00 |
0.45 |
5.19 |
0.0728 |
Not significant |
| Pure error |
0.35 |
4.00 |
0.09 |
|
|
|
| Cor total |
849.52 |
16.00 |
|
|
|
|
The obtained R2 of 0.9980 indicated that the predicted values of the hydrothermal shrinkage temperature were exact and close to the actual ones in Table 3, suggesting a good regression relationship with eqn (4) for the model. The R2 of 0.9980 suggests that 99.8% of the total variation in the hydrothermal shrinkage temperature is attributed to the experimental variables, with a high correlation between the experimental values and predicted ones in Fig. 2b.33 Herein, “Adeq Precision” reflects the signal to noise ratio, and in this study, the “Adeq Precision” value of 62.0818 was obtained, indicating an adequate precision. Besides, the standard deviation (Std. Dev. = 0.49) and the low coefficient of variation (C.V.% = 0.70) also suggested that this model is good for the optimization of the experimental design.
Table 3 Statistical parameters of the ANOVA of hydrothermal shrinkage temperatures predicted by the model
| Statistics |
Value |
Statistics |
Value |
| Std. Dev. |
0.49 |
R-squared |
0.9980 |
| C.V.% |
0.70 |
Pred R-squared |
0.9739 |
| PRESS |
22.21 |
Adeq precision |
62.0818 |
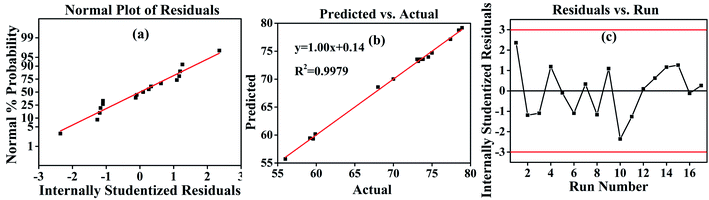 |
| | Fig. 2 Response surface methodology (RSM) results. (a) Residual analysis of the designed model. (b) The fitting curve of the actual and predicted values. (c) The results of the residuals analysis. | |
Finally, by the multiple regression analysis of the experimental data, it was found that the hydrothermal shrinkage temperature of DPA-tanned leather and the conditions for the oxidation of polysaccharide by sodium periodate were related to the second-ordered polynomial coded factors in eqn (3):
| | |
Y = 73.55 − 0.55X1 − 2.14X2 + 9.39X3 − 0.18X1X2 − 0.48X1X3 + 0.1X2X3 − 0.34X12 − 1.77X22 − 4.45X32
| (3) |
The equation in terms of the actual factors is as follows:
| | |
y = 52.27 + 1.68x1 + 0.17x2 + 26.65x3 − (8.75 × 10−3)x1x2 − 0.60x2x3 + (6.25 × 10−3)x2x3 − 0.34x12 − (4.43 × 10−3)x22 − 6.95x32
| (4) |
The good correlation coefficient of 0.9979 in Fig. 2b suggests the consistency between the experimental hydrothermal shrinkage temperatures and the predicted values. The normal probability distribution of the residuals in Fig. 2a is near-linear, with no abnormality in the random distribution of residuals, as seen in Fig. 2c. Therefore, the response surface method had good adaptability in evaluating the effect of different polysaccharide oxidation conditions on the hydrothermal shrinkage temperature of DPA-tanned leather.31
As presented in Fig. 3, the three-dimensional (3D) response surface and two-dimensional (2D) contour plots were employed to understand the effects of oxidation time (x1), oxidation temperature (x2) and sodium periodate dosage (x3) on the hydrothermal shrinkage temperature (y) of the tanned leathers. In all the 3D response surface plots, there was a well-defined peak, indicating that the three independent variables individually and interactively affected the oxidation reaction and the maximum hydrothermal shrinkage temperature of the tanned leathers. The two-dimensional contour maps in Fig. 3a and c show an obvious ellipse, and the contour density revealed the influence of the various factors on the hydrothermal shrinkage temperature.34 The contour plots of the oxidation temperature pattern were denser, and the 3D pattern was steeper than those of the contour line of oxidation time in Fig. 3a, which suggested that the determining factor of the hydrothermal shrinkage temperature is the oxidation temperature rather than oxidation time. Similarly, the sodium periodate dosage was more significant than oxidation time for sheepskin tanning, as seen in Fig. 3b. In Fig. 3c, compared with the oxidation temperature, the sodium periodate dosage contours are denser, and the 3D graphics slope is greater, indicating that the influence of the three factors on the tanning of sheepskin follows the order: sodium periodate dosage > oxidation temperature > oxidation time. Besides, as revealed in Fig. 3c, the contour density of hydrothermal shrinkage temperature increased with the increase in sodium periodate dosage from 1:0.2 to 1:1, indicating an increased impact of sodium periodate dosage on the response values in the initial mass ratio.
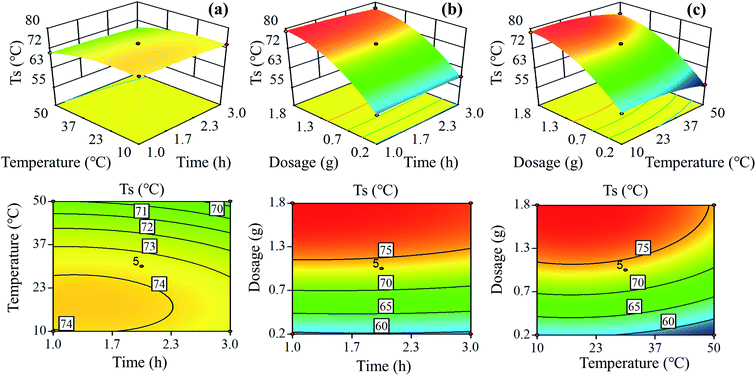 |
| | Fig. 3 Three-dimensional response plots and two-dimensional contour plots showing the (a) oxidation time (x1), oxidation temperature (x2), and their mutual interaction on shrinkage temperature (y); (b) the sodium periodate dosage (x3), oxidation time (x1) and their mutual interaction on y; (c) the sodium periodate dosage (x3), oxidation temperature (x2), and their mutual interaction on y. | |
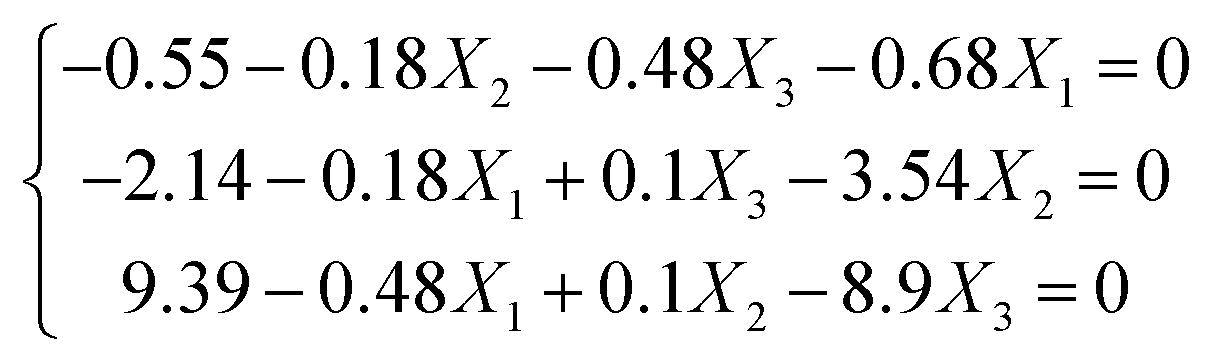
The second-order polynomial model was used, which is a conic function, and a stationary point exists in this function, where the partial derivatives of the predicted response correspond to the zero variables ∂Y/∂X1 = 0; ∂Y/∂X2 = 0; ∂Y/∂X3 = 0. Herein these points could be the maximum, minimum, or saddle points. Thus, the regression eqn (5) can be obtained after taking a derivative of each factor (Xi) in the model, respectively.
| |
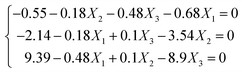 | (5) |
Hence X1 = −1.474; X2 = −0.498; X3 = 1.129 were obtained, which could be converted to the actual values: x1 = 0.53; x2 = 20.0; x3 = 1.9. In this work, the predicted hydrothermal shrinkage temperature was 79.78 °C in the optimized calculated condition, which is very close to the optimized experimental shrinkage temperature of 78.62 °C.
3.3 Fourier transform infrared spectroscopy (FTIR) analysis
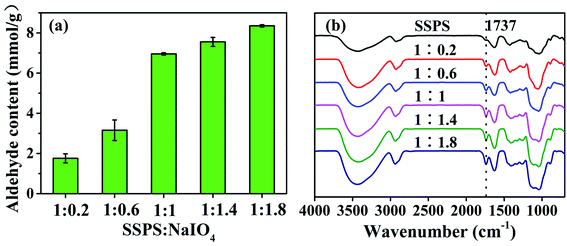
The hydroxyl groups on the C2 and C3 of the repetitive unit of SSPS can be oxidized by sodium periodate to form aldehyde groups to provide the chemical and structural basis for tanning. The results of the response surface analysis showed that the sodium periodate dosage affected tanning most significantly. In this work, five DPAs were prepared by oxidizing SSPS using different dosages of sodium periodate. The aldehyde group content of the DPA samples in Fig. 4a and the FT-IR spectra in Fig. 4b prove that aldehyde groups were formed in DPA. At the 1:1 mass ratio of SSPS to sodium periodate, the aldehyde group content was 6.95 mmol g−1. With a further increase in the sodium periodate dosage, the aldehyde group content no longer increased. In the molecular structure of SSPS, the number of hydroxyl groups that can be oxidized by sodium periodate is definite, which should be the reason why no more aldehyde groups were formed upon further increasing the sodium periodate dosage.
 |
| | Fig. 4 (a) Aldehyde group content and (b) FT-IR spectra of SSPS and different DPAs. | |
Fig. 4b shows the FT-IR spectra of SSPS and DPA. SSPS presented peaks at 3447 and 2921 cm−1, which were assigned to the stretching vibrations of the –OH and –CH groups, respectively. The peak observed at 1737 cm−1 was due to the C–O stretching vibration of the carboxyl groups. The absorption band at 1413 cm−1 corresponded to the bending vibration of –CH. In addition, the peak at 1041 cm−1 was due to the glycosidic bond vibrations in the polysaccharide structure. Compared with the spectrum of SSPS, a new characteristic peak at 1737 cm−1 appeared in the FT-IR spectrum of DPA, which should be the stretching vibration of –CHO.35–37 The peak intensity increased with increasing sodium periodate dosage, suggesting that more aldehyde groups were formed by the oxidation of hydroxyl groups primarily in the C-2 and C-3 positions of the glucose unit (Scheme 1). The peak of the –OH stretching vibration enhanced absorption at 3447 cm−1 after oxidation due to the scission of the glycosidic bonds and the formation of more hydroxyl groups. This result also certified that SSPS was significantly degraded during oxidation, which is consistent with the results of molecular weight in Table 4.
Table 4 The peak molecular weights of SSPS and different DPAsa
| |
SSPS |
DPA (1:0.6) |
DPA (1:1) |
DPA (1:1.4) |
| Mp |
Area (%) |
Mp |
Area (%) |
Mp |
Area (%) |
Mp |
Area (%) |
| “A, B, C, and D” represent the peak molecular weights at different times. “—” means nothing was detected by GPC. |
| A |
811110 |
38.84 |
11000 |
42.86 |
18463 |
9.78 |
19431 |
10.23 |
| B |
291071 |
18.79 |
2889 |
57.14 |
4980 |
27.03 |
2916 |
89.77 |
| C |
22351 |
16.55 |
— |
— |
2910 |
63.20 |
— |
— |
| D |
2958 |
25.82 |
— |
— |
— |
— |
— |
— |
3.4 Peak molecular weight
The peak molecular weights (Mp) of SSPS and DPA oxidized with different dosages of sodium periodate are shown in Table 4 and Fig. S2.† The Mp of the samples decreased dramatically with increasing sodium periodate dosage used for oxidation. Thus, the Mp of SSPS can be regulated by controlling the rupture degree of the glycosidic bond during oxidation. From the viewpoint of tanning, the molecular weight of DPA after sodium periodate oxidation should be more suitable for penetration in the fiber structure. Therefore, the hydrothermal shrinkage temperature effectively acts as the response value to determining the preparation conditions of DPA.
3.5 Mechanical properties
The mechanical properties of the DPA-tanned leather are given in Table 5. The tensile strength and elongation at break of DPA-tanned leather were better compared with the standard values (12 MPa).38 The tensile strength (19.73 MPa) and elongation at break (107.87%) of DPA-tanned leather were higher than those of chrome-tanned leather or zirconium-tanned leather. However, the hydrothermal shrinkage temperature of the DPA-tanned leather was 79 °C. This is lower than that of chrome-tanned leather, which is usually higher than 100 °C due to the excellent penetrating and moderate crosslinking effects. These results can be explained by the structure of DPA, as shown in Scheme 1. The DPAs, with moderate molecular weights, could penetrate the collagenous fiber matrix well and contribute more to the fullness of leather because they could serve as supports to stabilize the fiber bundles and prevent them from being adhesive. The aldehyde groups obtained by oxidation can react with the amino groups in collagen to form a crosslinked structure by the Schiff base reaction, thus improving the mechanical properties of the leather. One of the advantages of the chrome-tanning system is the versatility of making different types of leathers, and the disadvantage is chromium pollution in tannery waste solids and wastewater. The presence of chrome makes the waste more difficult to be treated. In the DPA tanning system, the wastewater is free of chromium, making its biodegradation easier than that from the chrome-tanning system. Therefore, this kind of DPA would be a highly effective tanning agent for the sustainable development of the leather industry.
Table 5 Mechanical properties of fatliquored leather
| Samples |
Tensile strength (MPa) |
Standard (MPa) |
Elongation (%) |
Standard (%) |
| Chrome tanned leather |
17.38 ± 1.5 |
≥12 |
78.39 ± 2.6 |
≥25 |
| Zirconium tanned leather |
18.90 ± 1.1 |
≥12 |
111.85 ± 11.0 |
≥25 |
| DPA-tanned leather |
19.73 ± 1.76 |
≥12 |
107.87 ± 8.1 |
≥25 |
3.6 Morphological analysis
The grain and cross-section of the leather samples were observed using SEM, and the penetration of DPA in the leather was studied. The grain surface of the pickled sheepskin and leather samples tanned with DPA are shown in Fig. 5. As for the pores on the grain surface, the shallower the pore, the higher is the tanning degree of the DPA-tanned leather.39 The pores were shallower, and the surface was smoother in the tanned leather samples than those in pickled sheepskin. Compared with that of pickled sheepskin, the SEM cross-section image of DPA-tanned leather (Fig. 5b) showed better dispersion of collagen fibers in the structure, indicating a more uniform structure. This provided good evidence for the good penetration of DPA in the leather.40 Usually, the collagen fibers are closely woven into the skin. Thus, only tanning agents with moderate molecular weights can penetrate the three-dimensional network structure of the skins and achieve good tanning. By oxidation, the SSPS was degraded, and molecular weight could be regulated, which was beneficial for uniform penetration, distribution and reaction in the leather structure. The most critical components are the aldehyde groups introduced in DPA, which could form additional crosslinking, achieving a more stable structure for tanning.
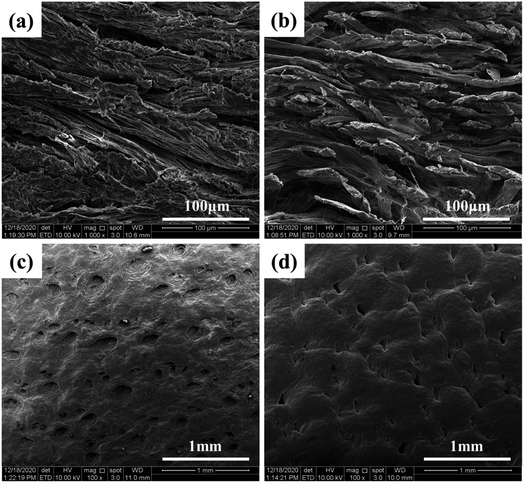 |
| | Fig. 5 SEM images of cross-sections (a and b) and grain surfaces (c and d) of sheepskin and DPA-tanned leather. | |
4. Conclusions
The effects of oxidation temperature, oxidation time, and sodium periodate dosage on the tanning of sheepskin were studied, and the results demonstrate that the hydrothermal shrinkage temperature is closely related to these three variables. The hydrothermal shrinkage temperature model for DPA-tanned leather was established by the response surface methodology, and the optimal oxidation conditions were finally obtained. The highest hydrothermal shrinkage temperature of the leather was reached at the oxidation time of 0.53 h, oxidation temperature of 20 °C, and the SSPS to oxidant mass ratio of 1:1.9. This model is good for the optimization of experimental design and provides a way to predict the hydrothermal shrinkage temperature of leather tanned by DPA. DPAs with proper aldehyde content and molecular weight might penetrate the skins to crosslink and successfully stabilize the collagen fibers, achieving good tanning. In this work, the oxidation conditions were optimized, and the effect of the polysaccharide structure on tanning has been discussed, which would be beneficial to the application of DPA in chrome-free tanning, as well as the sustainable development of the leather industry.
Author contributions
Haolin Zhu: Investigation, Writing-Original draft preparation. Hui Liu: Data curation, Formal analysis, Investigation, Methodology. Keyong Tang: Supervision, Writing-Reviewing & Editing, Validation, Resources, Funding acquisition. Jie Liu: Data curation, Formal analysis, Investigation, Methodology. Xuejing Zheng: Visualization, Resources: Ying Pei: Visualization, Resources. Jide Zhong: Resources, Formal analysis.
Conflicts of interest
The authors declare that there are no conflicts of interest.
Acknowledgements
The financial supports from the National Natural Science Foundation of China (No. 52073262, 51673177) and National Key R&D Program of China (No. 2017YFB0308500) are greatly appreciated.
References
- H. Liu, Z. Yin, Q. Zhang, X. Li, K. Tang, J. Liu, Y. Pei and X. Zheng, J. Clean. Prod., 2019, 237, 117800 CrossRef CAS
 .
. - W. Ding, Y. D. Yi, Y. N. Wang, J. F. Zhou and B. Shi, ChemistrySelect, 2018, 3, 12330–12335 CrossRef CAS .
- X. Wu, X. Qiang, D. Liu, L. Yu and X. Wang, J. Clean. Prod., 2020, 270, 122399 CrossRef CAS .
- H. Liu, X. Li, M. Li, Y. Zhang, K. Tang, J. Liu, X. Zheng and Y. Pei, J. Clean. Prod., 2020, 282, 124535 CrossRef .
- Y. Zhang, H. Liu, K. Tang, J. Liu and X. Li, J. Clean. Prod., 2021, 293 CAS .
- C. R. China, M. M. Maguta, S. S. Nyandoro, A. Hilonga, S. V. Kanth and K. N. Njau, Chemosphere, 2020, 254, 126804 CrossRef CAS PubMed .
- B. Lyu, R. Chang, D. Gao and J. Ma, ACS Sustain. Chem. Eng., 2018, 6, 5413–5423 CrossRef CAS .
- T. T. Qiang, X. Gao, J. Ren, X. K. Chen and X. C. Wang, ACS Sustain. Chem. Eng., 2015, 4, 701–707 CrossRef .
- L. Jia, J. Z. Ma, D. G. Gao, W. R. T. Tait and L. Y. Sun, J. Hazard. Mater., 2019, 361, 305–311 CrossRef CAS PubMed .
- M. Liu, J. Z. Ma, B. Lyu, D. G. Gao and J. Zhang, J. Clean. Prod., 2016, 133, 487–494 CrossRef CAS .
- Y. D. Hu, J. Liu, L. Luo, X. M. Li, F. Wang and K. Y. Tang, Thermochim. Acta, 2020, 691, 178717 CrossRef CAS .
- G. Krishnamoorthy, S. Sadulla, P. K. Sehgal and A. B. Mandal, J. Clean. Prod., 2013, 42, 277–286 CrossRef CAS .
- V. F. M. Silva, A. Crispim and G. Pinto, Leather Footwear J., 2019, 19, 195–200 CrossRef CAS .
- X. Wang, Z. Yan, X. Liu, T. Qiang, L. Chen, P. Guo and O. Yue, J. Clean. Prod., 2019, 207, 679–688 CrossRef CAS .
- C. Liu, J. Huang, X. Zheng, S. Liu, K. Lu, K. Tang and J. Liu, Food Packag. Shelf Life, 2020, 24, 100485 CrossRef .
- Z. Ma, J. Liu, Y. Liu, X. Zheng and K. Tang, Int. J. Biol. Macromol., 2021, 166, 567–577 CrossRef CAS PubMed .
- X. J. Jia, M. W. Chen, J. B. Wan, H. X. Su and C. W. He, RSC Adv., 2015, 5, 73525–73534 RSC .
- C. K. Ozkan, H. Ozgunay and H. Akat, Int. J. Biol. Macromol., 2019, 122, 610–618 CrossRef PubMed .
- W. Ding, X. Pang, Z. Ding, D. C. W. Tsangb, Z. Jiang and B. Shi, J. Hazard. Mater., 2020, 396, 122771 CrossRef CAS PubMed .
- L. Zhang, J. Liu, X. Zheng, A. Zhang, X. Zhang and K. Tang, Carbohydr. Polym., 2019, 216, 45–53 CrossRef CAS PubMed .
- W. Ding, Y. N. Wang, J. F. Zhou and B. Shi, Carbohydr. Polym., 2018, 201, 549–556 CrossRef CAS PubMed .
- N. Ariram and B. Madhan, J. Clean. Prod., 2020, 250, 119441 CrossRef CAS .
- W. Ding, J. Zhou, Y. Zeng, Y.-n. Wang and B. Shi, Carbohydr. Polym., 2017, 157, 1650–1656 CrossRef CAS PubMed .
- M. A. Bezerraa, R. E. Santelli, E. P. Oliveira, L. S. Villar and L. A. Escaleira, Talanta, 2008, 76, 965–977 CrossRef PubMed .
- A. Long, H. Zhang and Y. Lei, Sep. Purif. Technol., 2013, 118, 612–619 CrossRef CAS .
- A. Astuti, K. Muda and M. Amin, E3s Web of Conferences, 2018, 68, 04020 CrossRef CAS .
- C. Chen, Y. Shao, Y. Tao and H. Wen, LWT–Food Sci. Technol., 2015, 64, 1263–1269 CrossRef CAS .
- G. Li, Y. Jiang, M. Li, W. Zhang, Q. Li and K. Tang, Int. J. Biol. Macromol., 2021, 168, 233–241 CrossRef CAS PubMed .
- K. Tang, Z. Tang, F. Wang, J. Liu and C. E. Ferah, J. Soc. Leather Technol. Chem., 2020, 104, 163–169 CAS .
- J. Liu, L. Zhang, C. Liu, X. Zheng and K. Tang, Lebensm. Wiss. Technol., 2021, 138 Search PubMed .
- G. Fan, Y. Han, Z. Gu and D. Chen, LWT - Food Sci. Technol., 2008, 41, 155–160 CrossRef CAS .
- N. A. A. Talib, F. Salam, N. A. Yusof, S. A. Alang Ahmad and Y. Sulaiman, J. Electroanal. Chem., 2017, 787, 1–10 CrossRef CAS .
- X. Xiao, C.-Z. Wang, J. Bian and R.-C. Sun, RSC Adv., 2015, 5, 106219–106226 RSC .
- R. Kumar, P. S. Rao, S. S. Rana and P. Ghosh, J. Food Process. Eng., 2020, 43, 13530 Search PubMed .
- Y. Zhang, M. Chen, J. Zhang, J. Li, S. Q. Shi and Q. Gao, Adv. Mater. Interfac., 2020, 7, 2000148 CrossRef CAS .
- A. Nakamura, H. Furuta, H. Maeda, T. Takao and Y. Nagamatsu, Biosci., Biotechnol., Biochem., 2002, 66, 1301–1313 CrossRef CAS PubMed .
- Y. Yi, Z. Jiang, S. Yang, W. Ding, Y. N. Wang and B. Shi, Carbohydr. Polym., 2020, 239, 116217 CrossRef CAS PubMed .
- W. B. Li, J. Z. Ma, Y. X. Zhou, X. D. Sun and D. G. Gao, J. Clean. Prod., 2021, 280, 124337 CrossRef CAS .
- D. G. Gao, Y. M. Cheng, P. P. Wang, F. Li, Y. K. Wu, B. Lyu and J. Z. Ma, J. Clean. Prod., 2020, 257, 120546 CrossRef CAS .
- V. Beghetto, L. Agostinis, V. Gatto, R. Samiolo and A. Scrivanti, J. Clean. Prod., 2019, 220, 864–872 CrossRef CAS .
Footnote |
| † Electronic supplementary information (ESI) available. See DOI: 10.1039/d2ra00222a |
|
| This journal is © The Royal Society of Chemistry 2022 |
Click here to see how this site uses Cookies. View our privacy policy here. 
 Open Access Article
 This Open Access Article is licensed under a Creative Commons Attribution-Non Commercial 3.0 Unported Licence
 *a,
Jie Liua,
Xuejing Zhenga,
Ying Peia and
Jide Zhongc
*a,
Jie Liua,
Xuejing Zhenga,
Ying Peia and
Jide Zhongc


 is the uncoded value of the independent variable at the center point, and Δxi is the step change value. This model has coded a three-level factorial (−1, 0, and 1), which was superimposed by the center points (coded 0). The range of design factors was set according to the range of oxidation time, oxidation temperature, and sodium periodate dosage for the oxidation of the green tanning agent DPA. The experimental data were fitted to a second-order polynomial model according to eqn (2):