 Open Access Article
Closed-shell d10–d10 in [AuCl(CNR)]n and [AuCl(CO)]n (n = 1, 2; R = –H, –CH3, –Cy) complexes: quantum chemistry study of their electronic and optical properties
Fernando Mendizabal *a and
Sebastián Miranda-Rojas*b
aDepartamento de Química, Facultad de Ciencias, Universidad de Chile, Casilla 653, Santiago, Chile. E-mail: hagua@uchile.cl
bDepartamento de Ciencias Químicas, Facultad de Ciencias Exactas, Universidad Andres Bello, Avenida República 275, Santiago, Chile. E-mail: sebastian.miranda@unab.cl
First published on 7th March 2022
Abstract
The electronic structure and spectroscopic properties of [AuCl(CNR)] and [AuCl(CO)] (R = –H, –CH3, –Cy) complexes with d10–d10 type interactions were studied at the post-Hartree–Fock (MP2, SCS-MP2, CCSD(T)) and density functional theory levels. It was found that the nature of the intermetal interactions is consistent with the presence of an electrostatic (dipole–dipole) contribution and a dispersion-type interaction. The absorption spectra of these complexes were calculated using the single excitation time-dependent (TD) method at the DFT and SCS-CC2 levels. The calculated values are in agreement with the experimental range, where the absorption and emission energies reproduce the experimental trends, with large Stokes shifts. According to this, intermetallic interactions were found to be mainly responsible for the metal–metal charge transfer (MMCT) electronic transitions among the models studied.
1. Introduction
Systems chemistry is a new area in the description of the unique properties of compounds.1–3 These systems, constructed from the interactions of different components, generate properties that cannot emerge from the system's components acting in isolation,4,5 and are applicable to new fields such as materials science, supramolecular chemistry, and nanochemistry. Moreover, with the aid of modeling, computational, and theoretical tools, understanding of the behavior of systems chemistry is constantly improving, which will allow the rational design of new materials with modulable properties.6 At the simplest level, noncovalent interactions (NCIs) among molecules can lead to the emergence of large structures as a result of self-assembly processes and supramolecular chemistry.7–9Within this broad field, we are interested in evaluating the ability of heavy metals, such as gold, in the formation of stable self-assembly and inorganic complexes with optical properties,10–12 aiming to provide new insights into the relationship between structure and optical response. The understanding of these systems comes from the calculation of their intermolecular interactions energies and determining how these lead to structures and patterns that result in the target optical properties; thus, allowing the relationship between structure and optical properties to be rationalized.13–17 A central point of the analysis described above is that an in-depth understanding of the relationship between structure and the luminescent metal-based optical response from materials will contribute towards the optimization of their properties.11,18,19 In this context, the observation of absorption/luminescence has been tied to the presence of close Au–Au attractions in solid and solvent states.20,21 Such gold complexes have provided the opportunity to understand the excited states in broad emission color coverage.11 Supramolecular chemistry systems control of functional metal complexes plays an essential role in determining charge transport and optical properties.22
Metal–metal interactions are known as metallophilic interactions, and when referring to gold atoms in particular, are defined as “aurophilic interactions”.12,13 These closed-shell interactions are estimated to be energetically similar to hydrogen bonds (20–50 kJ mol−1) in the case of gold(I) and to be weaker for metals such as silver(I), copper(I), platinum(II) and other metals.23–25 Metallophilic interactions have been determined experimentally via solid-state X-ray diffraction26–29 and nuclear magnetic resonance (NMR)/absorption/emission/Raman spectroscopic measurements.30,31 From a theoretical point of view, metallophilic interactions have been understood as being a contribution of two terms to the equilibrium distance: dispersion and ionic.32–44 Relativistic effects contribute between 20% and 30% to the energy of interactions14 for heavy atoms. In recent years, researchers have proposed that the nature of metallophilic interactions is represented by strong Pauli repulsion at close range, which is balanced with the dispersion and ionic contributions as the stabilizing parts of the interaction,45–47 acting as a driving force for orbital interactions among the metallic centers. From these studies, it is possible to demonstrate the importance of the dispersion term in the attractive interaction involved in the metal–metal equilibrium distance. Moreover, the same complexes show an electrostatic interaction via a dipole–dipole term that dominates at the equilibrium Au–Au distance, which is calculated from the summing of the induction and dispersion terms.48,49 The experimental results in many studies can be explained using theoretical models described at the post-Hartree–Fock (MP2, SCS-MP2, CCSD(T)) and density functional theory (DFT) with dispersion levels.10 In the case of bigger systems, the DFT method is normally preferred because of its better performance, although accuracy is sacrificed.14
We focused our attention on two types of gold complexes, where the formation of linear chains by gold(I) complexes are stabilized by unsupported Au(I)–Au(I) (d10–d10) ligand interactions and the absorption and luminescence processes take place at the gold centers. The first type corresponds to [AuCl(L)] models (L = CNR (R = –H, –CH3, Cy)). Previous crystallographic studies on three isonitrile complexes [AuX(CNCy)] (CyNC = cyclohexyl isonitrile; X = Cl, Br, I),50 have shown Au(I)–Au(I) distances from 338.9 pm to 371.8 pm, with absorption and luminescence bands at around 270 and 600 nm, respectively. All complexes showed a large Stokes shift (∼2.6 eV). This large Stokes shift is associated to the fact that the excited state adopts a distorted geometry with respect to the ground state. The experimental results indicate that the orange emission is due to a triplet excited state, typical of luminescent gold(I) compounds. There are no reported theoretical studies on these complexes.
The second type of system corresponds to [AuCl(CO)], for which photophysical studies have shown luminescent properties with emission at 663 nm from the solid,51,52 and absorption at 250 nm. This complex also exhibits a red-orange luminescence with a large Stokes shift (∼2.1 eV), associated to aurophilic interactions between molecules in the excited state. In both compounds, self-association of two-coordinated gold(I) atoms that interact through an antiparallel geometry among the monomer units is observed. In the work of White-Morris et al.,50 it was suggested that in the [AuX(CNCy)] (X = –Cl, –Br, –I) complex the interaction is not only limited to aurophilic bonding, since there is also a relevant intermolecular stabilizing contribution from an electrostatic interaction such as a dipolar interaction. It has been suggested that these structural properties have consequences in terms of the observed optical properties.
Herein, we focused on establishing a relationship between the aurophilic interactions and experimental geometries based on models of type [AuCl(L)]n (n = 2, 4) (L = CNR (R = –H, –CH3, Cy); CO). Moreover, our second aim was to study the geometrical and optical properties at the post-Hartree–Fock (SCS-CC2) and DFT (PBE and B3LYP) levels on simplified models of the two types of complexes described above; namely [AuCl(CNR)] and [AuCl(CO)]. The light-absorption processes in the complexes were studied using time-dependent density functional theory (TDDFT) calculations and by performing ab initio correlated calculations at the approximate scaled opposite-spin approximation second-order coupled cluster (SCS-CC2).
2. Theoretical models and calculations
2.1 Quantum chemical methods
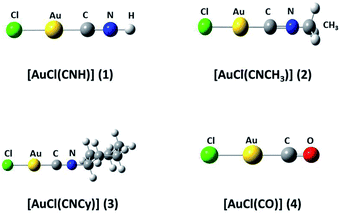
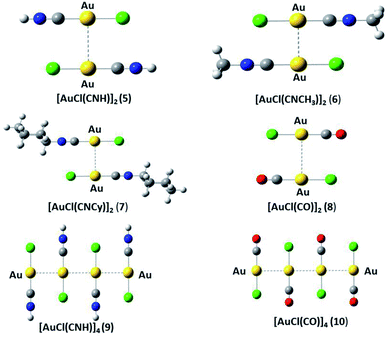
We used the [AuCl(L)] models (L = CNR (R = –H, –CH3, Cy); CO) (models 1 to 4 from Fig. 1) to model the aurophilic attractions of the [AuCl(L)]n (n = 2, 4) complexes shown in Fig. 2, defined as models 5 to 10. The dimers and tetramers in Fig. 2 were built with an antiparallel orientation to simulate the experimental geometry.50 The geometries were fully optimized at the scalar relativistic HF, MP2, SCS-MP2, CCSD(T), PBE (Perdew–Burke–Ernzerhof),53 B3LYP,54 PW91,55 and M06L56 levels in the gas phase for each fragment in the models. Grimme's dispersion correction was used to incorporate an accurate description of the weak forces when using the functionals, in what is nowadays known as the DFT-D3 level with the Becke–Johnson (BJ) damping function correction.57,58 The interaction energy (ΔEint) and geometric equilibrium distances (Re) of the complexes were obtained using the counterpoise correction for the basis-set superposition error (BSSE),59,60| ΔE = E(AB)AB − E(AB)A − E(AB)B | (1) |
The calculations were carried out using the Turbomole 7.0,61 and Gaussian 16 (ref. 62) program packages. We used the Turbomole program to obtain the optical properties, while the Gaussian program was used to obtain the equilibrium geometries and electronic properties. The 19 valence-electrons (VE) of the Au quasi-relativistic (QR) pseudo-potential (PP) of Andrae et al.63 were employed. We used 2f and 3f2g-type polarization and diffuse functions for gold, respectively (αf = 0.20, 1.19; αf = 1.41, 0.40; 0.15, αg = 1.20, 0.40). Also, the C, N, O, and Cl atoms were treated through PPs, using double-zeta basis sets with the addition of two d-type polarization functions.64 A double-zeta basis set plus two p-type polarization functions were used for the H atoms.65
Single point calculations of the equilibrium geometries were used to study the excitation spectra by PBE and B3LYP. The excitation energy was obtained using the time-dependent perturbation theory approach (TD),66 which is based on the random-phase approximation (RPA) method.67 The TD calculations do not evaluate the spin–orbit splitting, and the values were averaged for the metallic atoms described by pseudopotentials. Moreover, excitation energies and oscillator strengths were calculated at the approximate second-order coupled cluster (CC2) level using the scaled opposite-spin approximation (SCS-CC2).68,69 We used the equilibrium distance (Re) estimated at the SCS-MP2 level to calculate the excitation spectrum at SCS-CC2. The SCS-MP2 methodology is an accurate and efficient tool for incorporating electronic correlation for the study of models at a low computational cost.69 This method involves the Laplace transformation (LT) algorithm and the reduced-virtual-space (RVS) approximation. The RVS cut-off threshold was 60 eV.70
The optical properties are described from the theoretical calculations. The Stokes shifts described are the energy difference between the S0 → S1 absorption and the T1 → S0 emission (S0 → S1⋯T1 → S0).70 Also, we used a second definition, which is the energy between the S0 → T1 absorption and the T1 → S0 emission (S0 → T1 → S0).71 This approach assumes that the spin-allowed transitions dominate the absorption spectra with weaker contributions from spin-forbidden transitions.
2.2 Theory of intermolecular forces
We can partition the interaction energy of eqn (2) as:| ΔE = ΔE(SCF) + ΔE(corr) | (2) |
| Vint = Vshort + Velect + Vind + Vdisp | (3) |
The Hartree–Fock or DFT term (ΔE(HF)) is associated with the sum of short-range (Vshort), electrostatic (Velect), and induction (Vind) terms; while the ΔE(corr) electron correlation term is associated with dispersion (Vdisp).74 Hence, we aimed to relate the intermolecular interaction at the equilibrium distance Au–Au with the properties of the isolated [AuCl(CNR)] and [AuCl(CO)] through the dipole moment (μ), polarizability (α), and first ionization potential (IP1). The latter property was obtained from Koopmans' theorem.75 The Au–Au interactions were studied using the specific configuration given for [AuCl(CNR)]2 and [AuCl(CO)]2 concerning their dipole moment, as shown in Fig. 2. All dimer models have a conformation with antiparallel orientation (180°).
We based this study on previously published work on [AuCl(L)]2 dimers,48 where the dipole–dipole, induction, and dispersion terms are relevant. For this particular case, the expressions for the intermolecular potential are outlined in the following equations.
 | (4) |
 | (5) |
 | (6) |
3. Results and discussion
3.1 Aurophilic attractions and intermolecular forces
The [AuCl(L)]2 dimer systems (L = CNR (R = –H, –CH3, Cy) and CO (models 5–8) were used for modeling the aurophilic attractions. To compare and systemize the analysis of the aurophilic intermolecular interactions, we have included the results in Tables 1 and 2, where we summarize the interaction energies and Au–Au distances. In this context, the results reported in this study using the MP2, SCS-MP2 and CCSD(T) methods are at the same level as reported in the literature for both the interaction energy and the geometry.50,52 We can verify that using the Hartree–Fock (HF) method, there is a long-distance Au–Au attraction (approximately 400 pm) with a stabilizing interaction energy in all dimers. This result is not surprising since the antiparallel orientation of the dimers favours such attraction via the interaction of the dipole moments, which has already been reported for a classical [(ClAuPH3)2] system, where the dipole term dominates.48 We can also appreciate that when going from a 2f to a 3f2g basis for gold, the Au–Au interaction energy increases, and the Au–Au distance slightly decreases as a consequence. As is known,13,14 the MP2 method tends to overestimate the interaction energy and to shorten the Au–Au distance. The CCSD(T) method provides a better description, with a lower interaction energy and a longer Au–Au distance than obtained at the MP2 level. This trend can be observed in all complexes from their interaction energies and geometric parameters. The novelty in these results comes from the values obtained with the SCS-MP2 method, which generates similar accuracy to CCSD(T) but at a lower computational expense.| Monomer | Method | Au (basis) | Re | V(Re) |
|---|---|---|---|---|
| a Single point at Re in D3. | ||||
| [AuCl(CNH)]2 (5) | HF | 2f | 402.8 | −23.8 |
| MP2 | 2f | 352.2 | −42.3 | |
| SCS-MP2 | 2f | 362.7 | −34.9 | |
| CCSD(T) | 2f | 360.9 | −34.8 | |
| HF | 3f2g | 405.7 | −23.9 | |
| MP2 | 3f2g | 346.7 | −44.6 | |
| SCS-MP2 | 3f2g | 356.6 | −37.2 | |
| CCSD(T) | 3f2g | 360.7 | −35.6 | |
| PW91 | 3f2g | 369.3 | −23.3 | |
| M06L | 3f2g | 352.3 | −33.0 | |
| PBE-D3 | 3f2g | 352.6 | −38.1 | |
| B3LYP-D3 | 3f2g | 350.8 | −46.0 | |
| PBEa | 3f2g | 352.6 | −23.3 | |
| B3LYPa | 3f2g | 350.8 | −17.7 | |
| [AuCl(CNCH3)]2 (6) | HF | 2f | 391.9 | −28.6 |
| MP2 | 2f | 352.5 | −47.3 | |
| SCS-MP2 | 2f | 358.8 | −40.3 | |
| CCSD(T) | 2f | 363.7 | −40.6 | |
| HF | 3f2g | 393.2 | −28.0 | |
| MP2 | 3f2g | 346.0 | −50.4 | |
| SCS-MP2 | 3f2g | 354.4 | −42.5 | |
| CCSD(T) | 3f2g | 359.8 | −42.5 | |
| PW91 | 3f2g | 365.3 | −28.8 | |
| M06L | 3f2g | 347.9 | −41.0 | |
| PBE-D3 | 3f2g | 347.8 | −46.8 | |
| B3LYP-D3 | 3f2g | 346.9 | −54.2 | |
| PBEa | 3f2g | 347.8 | −29.3 | |
| B3LYPa | 3f2g | 346.9 | −30.9 | |
| Monomer | Method | Au (basis) | Re | V(Re) |
|---|---|---|---|---|
| a Cy is cyclohexyl.b Single point at Re in D3. | ||||
| [AuCl(CNCy)]2 (7) | HF | 2f | 401.1 | −27.1 |
| MP2 | 2f | 349.8 | −46.4 | |
| SCS-MP2 | 2f | 358.8 | −40.3 | |
| CCSD(T) | 2f | 360.5 | −39.1 | |
| HF | 3f2g | 399.4 | −26.2 | |
| MP2 | 3f2g | 344.6 | −49.7 | |
| SCS-MP2 | 3f2g | 354.4 | −42.5 | |
| PW91 | 3f2g | 368.3 | −26.5 | |
| M06L | 3f2g | 349.5 | −38.4 | |
| PBE-D3 | 3f2g | 347.3 | −45.6 | |
| B3LYP-D3 | 3f2g | 345.8 | −54.2 | |
| PBEb | 3f2g | 347.3 | −26.9 | |
| B3LYPb | 3f2g | 345.8 | −19.8 | |
| [AuCl(CO)]2 (8) | HF | 2f | 393.1 | −12.6 |
| MP2 | 2f | 352.3 | −30.9 | |
| SCS-MP2 | 2f | 362.8 | −25.5 | |
| CCSD(T) | 2f | 363.6 | −25.3 | |
| HF | 3f2g | 394.7 | −11.8 | |
| MP2 | 3f2g | 344.2 | −33.8 | |
| SCS-MP2 | 3f2g | 356.9 | −28.0 | |
| CCSD(T) | 3f2g | 356.4 | −26.9 | |
| PW91 | 3f2g | 361.7 | −15.5 | |
| M06L | 3f2g | 343.9 | −24.4 | |
| PBE-D3 | 3f2g | 347.1 | −29.2 | |
| B3LYP-D3 | 3f2g | 345.9 | −35.8 | |
| PBEb | 3f2g | 347.1 | −14.9 | |
| B3LYPb | 3f2g | 345.9 | −8.4 | |
| [AuCl(CNCy)]a | Exp.50 | 339 | ||
| 359 | ||||
| [AuCl(CO)] | Exp.52 | 338 | ||
For the DFT calculations, we used the larger 3f2g basis set. It has been shown that there are no significant differences between these methodologies. For the PBE and B3LYP functionals, only after the dispersion corrections (D3) were included were the interaction energy and Au–Au distances comparable to those obtained at the MP2 level. At the same time, the PW91 and M06L functionals showed different behaviour, as shown in Table 1. When we used PW91, it provided a poor description of the interaction energy and Au–Au distance. Meanwhile, results obtained using the M06L functional are similar to those obtained at the SCS-MP2 and CCSD(T) levels.
Using the results in Tables 1 and 2, we applied the theory of intermolecular forces to obtain an estimate of the aurophilic attractions and the electrostatic (dipole–dipole and inductive) term. At the equilibrium distance in each dimer, the aurophilic attraction is obtained by subtracting the V(Re) from the Hartree–Fock (HF) calculation at the MP2, SCS-MP2, and CCSD(T) levels of theory. The amount that remains from the subtraction is associated with the dipole–dipole and inductive terms. Meanwhile, at the PBE and B3LYP levels, this contribution comes directly from the D3 term, and the results are listed in Table 3. The [AuCl(CNR)]2 dimers showed that the aurophilic interaction coming from the dipole–dipole and the inductive terms are important. At the MP2 level, the aurophilic attraction is overestimated, while at the SCS-MP2 and CCSD(T) it decreases. The same behaviour was observed for the DFT methods. Among the systems here studied, the [AuCl(CO)]2 dimer (8) is a special case. The results show that the aurophilic interaction is the most important term, although the electrostatic term is not negligible.
| Monomer | Method | Au (basis) | Re | Aurophilic | ΔEelect |
|---|---|---|---|---|---|
| [AuCl(CNH)]2 (5) | MP2 | 2f | 352.2 | −24.9 | −17.4 |
| SCS-MP2 | 2f | 362.7 | −14.3 | −20.6 | |
| CCSD(T) | 2f | 360.9 | −13.7 | −21.2 | |
| MP2 | 3f2g | 346.7 | −31.6 | −13.0 | |
| SCS-MP2 | 3f2g | 356.6 | −17.2 | −18.4 | |
| CCSD(T) | 3f2g | 360.7 | −20.2 | −17.1 | |
| PBE-D3 | 3f2g | 352.6 | −14.8 | −23.3 | |
| B3LYP-D3 | 3f2g | 350.8 | −28.3 | −17.7 | |
| [AuCl(CNCH3)]2 (6) | MP2 | 2f | 352.5 | −25.4 | −21.9 |
| SCS-MP2 | 2f | 358.8 | −15.1 | −25.5 | |
| CCSD(T) | 2f | 363.7 | −16.1 | −24.1 | |
| MP2 | 3f2g | 346.0 | −32.3 | −18.0 | |
| SCS-MP2 | 3f2g | 354.4 | −20.8 | −21.3 | |
| CCSD(T) | 3f2g | 359.8 | −18.9 | −23.6 | |
| PBE-D3 | 3f2g | 347.8 | −17.6 | −29.3 | |
| B3LYP-D3 | 3f2g | 346.9 | −23.3 | −30.9 | |
| [AuCl(CNCy)]2 (7) | MP2 | 2f | 349.8 | −28.8 | −17.6 |
| SCS-MP2 | 2f | 358.8 | −20.3 | −19.9 | |
| CCSD(T) | 2f | 360.5 | −17.3 | −21.8 | |
| MP2 | 3f2g | 344.6 | −35.4 | −14.3 | |
| SCS-MP2 | 3f2g | 354.4 | −26.3 | −16.3 | |
| PBE-D3 | 3f2g | 347.3 | −18.7 | −26.4 | |
| B3LYP-D3 | 3f2g | 345.8 | −34.4 | −19.8 | |
| [AuCl(CO)]2 (8) | MP2 | 2f | 352.3 | −23.9 | −7.0 |
| SCS-MP2 | 2f | 362.8 | −15.7 | −9.8 | |
| CCSD(T) | 2f | 363.6 | −15.3 | −9.9 | |
| MP2 | 3f2g | 344.2 | −31.1 | −2.7 | |
| SCS-MP2 | 3f2g | 356.9 | −20.7 | −7.3 | |
| CCSD(T) | 3f2g | 356.4 | −19.7 | −7.2 | |
| PBE-D3 | 3f2g | 347.1 | −14.2 | −14.9 | |
| B3LYP-D3 | 3f2g | 345.9 | −27.4 | −8.4 |
To gain insight on the origin of the intermolecular forces present in the systems under study, we calculated the contributions to the interaction energy represented by eqn (4)–(6) to estimate the dipole–dipole, inductive, and dispersion terms. The contributions of these three forces at the Au–Au equilibrium distance were estimated at the MP2 level for each dimer, with the results summarized in Table 4. This was complemented by the determination of the electronic properties of each monomer, as listed in Table 5. For the [AuCl(CNR)]2 complex, the most important term is the dipole–dipole interaction (49% to 73%). However, for [AuCl(CNCy)]2 the dispersion term is relevant due to a high polarizability (α) (35%). This complex has been experimentally synthetized,50 from which it was observed that the geometry of the complex shows an antiparallel disposition of the monomers [AuCl(CNCy)]. This suggests that the dipolar term would be relevant in the orientation of the complex. However, the [AuCl(CO)]2 dimer shows that the dipole–dipole (50%) and dispersion (43%) terms are of similar magnitude because the polarization of the monomer is low. Hence, both terms are equivalent in magnitude. The [AuCl(CNR)]2 dimers show a high polarization reflected in a more relevant dispersion term.
| Properties | Vdipole–dipole | Vind | Vdisp |
|---|---|---|---|
| [AuCl(CNH)]2 | −108.4 (73%) | −18.7 (13%) | −21.3 (14%) |
| [AuCl(CNCH3)]2 | −147.8 (69%) | −31.4 (15%) | −34.1 (16%) |
| [AuCl(CNCy)]2 | −181.2 (49%) | −61.2 (15%) | −129.0 (35%) |
| [AuCl(CO)]2 | −24.6 (50%) | −3.8 (8%) | −21.2 (43%) |
| Properties | [AuCl(CNH)] | [AuCl(CNCH3)] | [AuCl(CNCy)] | [AuCl(CO)] |
|---|---|---|---|---|
| μ | 3.4907 | 4.0816 | 4.4677 | 1.6652 |
| α | 62.279 | 76.7312 | 129.8382 | 57.0902 |
| α⊥ | 42.5394 | 52.3356 | 95.3189 | 39.9445 |
| α∥ | 101.7605 | 125.5225 | 193.3875 | 91.3818 |
| IP1 | 0.3862 | 0.3776 | 0.3744 | 0.4125 |
3.2 Optical properties: absorption spectra
UV-Vis spectra have been calculated at the SCS-CC2 level. Also, the excitation energies of the models were calculated at the TDDFT level using the PBE-D3 and B3LYP-D3 functionals with the purpose of comparing their performance with respect to the SCS-CC2 results. We calculated the allowed spin-singlet transition for these systems based on the ground-state structures of the [AuCl(L)]n (n = 1, 2, 4) models, with the objective being to evaluate the electronic structure of the excited state via direct electronic excitations. The allowed transitions are listed in Table 6 for [AuCl(CNR)]n in models 1, 5–7, and 9, and Table 7 shows the excitation energies of [AuCl(CO)]n in models 4, 8, and 10.| System | Method | λcalc/nm | fa | Contributionb | Transition type |
|---|---|---|---|---|---|
| a Oscillator strength.b Values are |coeff.|2 × 100. | |||||
| [AuCl(CNH)] (1) | SCS-CC2 | 199 | 0.4973 | 18a → 20a (35) | LLCT(pz → π*) |
| 17a → 21a (35) | LLCT(pz → π*) | ||||
| PBE | 265 | 0.2550 | 18a → 20a (45) | LLCT(pz → π*) | |
| 17a → 19a (45) | LLCT(pz → π*) | ||||
| B3LYP | 222 | 0.223 | 17a → 20a (44) | LLCT(pz → π*) | |
| 18a → 19a (44) | LLCT(pz → π*) | ||||
| [AuCl(CNH)]2 (5) | SCS-CC2 | 238 | 0.4243 | 36a → 40a (61) |  |
| 36a → 38a (21) |  |
||||
| PBE | 238 | 0.2551 | 36a → 40a (44) |  |
|
| 36a → 38a (21) |  |
||||
| B3LYP | 257 | 0.1296 | 36a → 37a (85) |  |
|
| 241 | 0.1341 | 35a → 37a (57) |  |
||
| [AuCl(CNH)]4 (9) | SCS-CC2 | 263 | 1.3934 | 72a → 78a (71) |  |
| 72a → 74a (21) |  |
||||
| PBE | 321 | 0.4311 | 72a → 73a (96) |  |
|
| B3LYP | 270 | 0.7256 | 72a → 73a (95) |  |
|
| [AuCl(CNCH3)]2 (6) | SCS-CC2 | 217 | 0.3767 | 42a → 46a (53) |  |
| 42a → 44a (20) |  |
||||
| PBE | 228 | 0.382 | 40a → 46a (34) |  |
|
| 39a → 45a (20) |  |
||||
| B3LYP | 242 | 0.1563 | 42a → 43a (84) |  |
|
| [AuCl(CNCy)]2 (7) | SCS-CC2 | 238 | 0.3559 | 70a → 74a (53) |  |
| 70a → 73a (14) |  |
||||
| PBE | 234 | 0.5375 | 69a → 74a (34) |  |
|
| 67a → 73a (25) |  |
||||
| B3LYP | 245 | 0.1590 | 67a → 71a (92) |  |
|
| 234 | 0.1094 | 66a → 71a (57) |  |
||
| [AuCl(CNCy)]2 | Solid50 | 280 | |||
| System | Method | λcalc/nm | fa | Contributionb | Transition type |
|---|---|---|---|---|---|
| a Oscillator strength.b Values are |coeff.|2 × 100. | |||||
| [AuCl(CO)] (4) | SCS-CC2 | 220 | 0.0652 | 16a → 19a (67) |  |
| 213 | 0.0641 | 16a → 20a (69) |  |
||
| 204 | 0.5017 | 17a → 20a (41) |  |
||
| 18a → 19a (40) |  |
||||
| PBE | 260 | 0.2231 | 17a → 19a (46) |  |
|
| 17a → 20a (46) |  |
||||
| 233 | 0.2462 | 17a → 19a (48) |  |
||
| 18a → 20a (48) |  |
||||
| B3LYP | 232 | 0.2462 | 17a → 19a (48) |  |
|
| 18a → 20a (48) |  |
||||
| 189 | 0.0342 | 17a → 21a (45) |  |
||
| 18a → 21a (45) |  |
||||
| [AuCl(CO)]2 (8) | SCS-CC2 | 240 | 0.3982 | 36a → 38a (65) |  |
| 201 | 0.3739 | 33a → 38a (35) |  |
||
| 35a → 37a (28) |  |
||||
| PBE | 273 | 0.1167 | 32a → 37a (90) |  |
|
| 251 | 0.3310 | 33a → 40a (33) |  |
||
| 34a → 39a (21) |  |
||||
| B3LYP | 245 | 0.1279 | 32a → 37a (42) |  |
|
| 34a → 39a (31) |  |
||||
| 220 | 0.3318 | 33a → 40a (50) |  |
||
| 34a → 39a (22) |  |
||||
| [AuCl(CO)]4 (10) | SCS-CC2 | 263 | 1.2921 | 72a → 74a (77) |  |
| PBE | 356 | 0.4395 | 72a → 73a (95) |  |
|
| B3LYP | 298 | 0.7252 | 72a → 73a (96) |  |
|
| [AuCl(CO)] | CH3CN solvent51 | 208; 220; 250 | |||
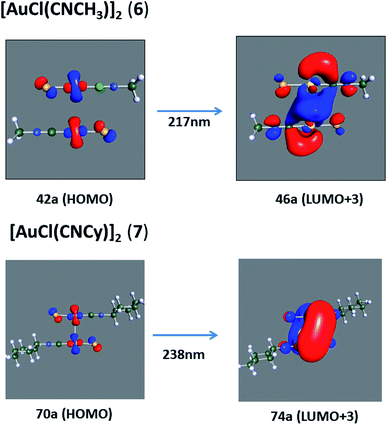
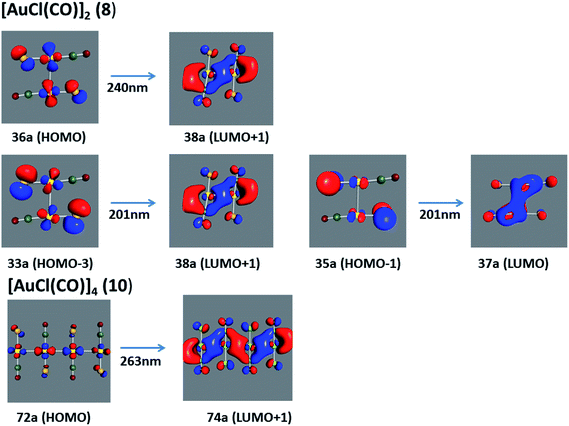
We considered only the strong transitions obtained at the SCS-CC2 level in the discussion of the properties of the excited states since they are in good agreement with the experimental data, and the states are easily identified by comparing the excitation energies with the ones calculated at the other levels of theory. We will discuss the properties of the models 1, 5–7, and 9 and [AuCl(CO)]n models 4, 8, and 10. The simulated spectra of all of the models are shown in Fig. 3–5. The most important molecular orbitals for describing the electronic transitions are shown in Fig. 6–9.
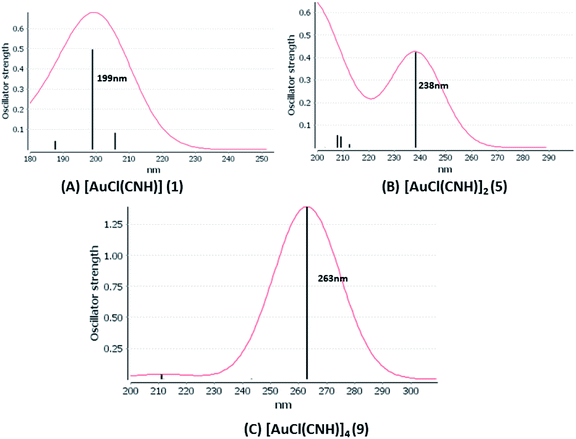 | ||
| Fig. 3 Electronic spectra at the SCS-CC2 level calculated for [AuCl(CNH)]n (n = 1, 2, 4) models (1, 5, and 9). | ||
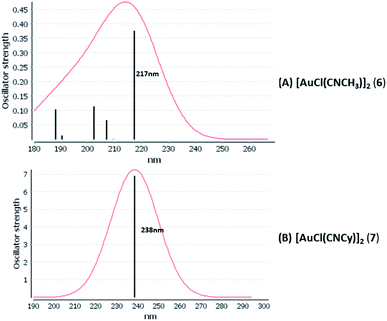 | ||
| Fig. 4 Electronic spectra at the SCS-CC2 level calculated for [AuCl(CNR)]2 (R = –CH3, –Cy) models (6 and 7). | ||
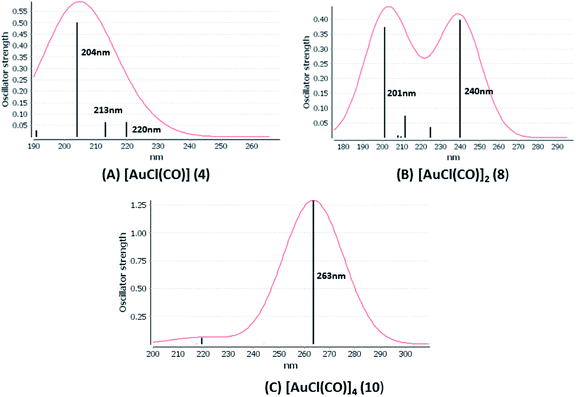 | ||
| Fig. 5 Electronic spectra at the SCS-CC2 level calculated for [AuCl(CO)]n (n = 1, 2, 4) models (4, 8, and 10). | ||
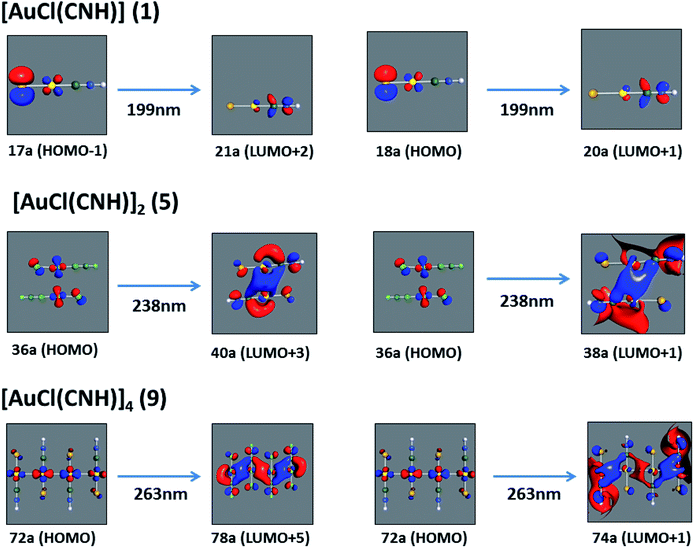 | ||
| Fig. 6 Most important active molecular orbitals in the electronic transitions of the [AuCl(CNH)]n (n = 1, 2, 4) models (1, 5, and 9) at the SCS-CC2 level. | ||
When we studied the [AuCl(CNR)]2 (R = –CH3, –Cy) system represented by models 6 and 7, with model 7 being a representation of the experimental complex; we can observe that at the SCS-CC2 level the main band is a consequence of the transitions at 217 and 238 nm for models 6 and 7, respectively. Both bands correspond to those observed in models 5 and 9, which can be attributed to MMCT, as depicted in Fig. 7. The most essential contribution corresponds to orbitals centred on gold atoms with strong bonding character among these atoms.
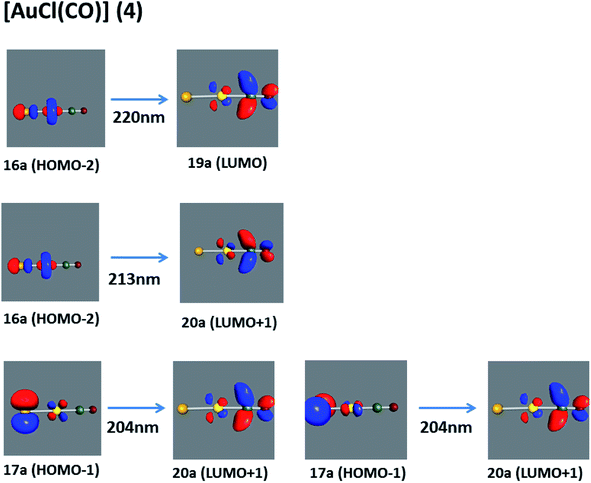 | ||
| Fig. 8 Most important active molecular orbitals in the electronic transitions of the [AuCl(CO)] model (4) at the SCS-CC2 level. | ||
Using the larger models 8 and 10, it is possible to appreciate the increase in the transition band (Fig. 5). The principal transitions can be assigned to 36a → 38a (240 nm) and 72a → 74a (263 nm) for models 8 and 10, respectively. These bands correspond to MMCT (see Fig. 9), very similar to those obtained for the [AuCl(CNR)]2 (R = –CH3, –Cy) systems represented by models 6 and 7 and described in the previous section.
3.3 Absorption and emission energies
The obtained absorption and emission energies, wavelengths and the corresponding Stokes shifts for the monomers and dimers are listed in Table 8. For the monomers of the [AuCl(CNH)] (1) and [AuCl(CO)] (4) models, the calculations show some differences between the absorption energies depending on the method used. The S0 → S1 absorption energies calculated at the SCS-CC2 are ∼0.5–1.2 eV higher than those obtained at the B3LYP and PBE levels. However, the T1 → S0 emission energies are very close among the three methods. The calculations yielded a large Stokes shift in both methods used here of 3.4–4.9 eV, without significant changes.| System | Method | S0 → S1 eV (nm) | T1 → S0 eV (nm) | Stokes shift S0 → S1⋯T1 → S0 eV | S0 → T1 eV (nm) | Stokes shift S0 → T1 → S0 eV |
|---|---|---|---|---|---|---|
| [AuCl(CNH)] (1) | SCS-CC2 | 6.37(195) | 1.46(848) | 4.91 | 6.04(205) | 4.58 |
| B3LYP | 5.32(233) | 1.50(825) | 3.82 | 5.21(238) | 3.71 | |
| PBE | 5.10(243) | 1.73(714) | 3.37 | 4.95(251) | 3.22 | |
| [AuCl(CNH)]2 (5) | SCS-CC2 | 5.25(236) | 2.84(436) | 2.41 | 4.75(263) | 1.91 |
| B3LYP | 4.86(255) | 2.63(471) | 2.23 | 4.81(256) | 2.18 | |
| PBE | 4.48(277) | 1.87(662) | 2.99 | 4.41(280) | 2.54 | |
| [AuCl(CO)] (4) | SCS-CC2 | 6.25(198) | 1.48(836) | 4.77 | 5.94(209) | 4.46 |
| B3LYP | 5.15(241) | 1.52(833) | 3.63 | 5.00(248) | 3.48 | |
| PBE | 4.92(252) | 1.48(837) | 3.44 | 4.85(255) | 3.37 | |
| [AuCl(CO)]2 (8) | SCS-CC2 | 5.52(225) | 2.99(414) | 2.52 | 5.57(222) | 2.58 |
| B3LYP | 4.82(257) | 2.33(532) | 2.49 | 4.78(259) | 2.45 | |
| PBE | 3.96(313) | 2.05(604) | 1.91 | 4.21(294) | 2.16 |
We carried out similar analysis for the dimers of [AuCl(CNH)]2 (5) and [AuCl(CO)]2 (8). The absorption energies of the dimers are red-shifted ∼0.30–1.2 eV compared to the S0 → S1 for the corresponding monomers. The emission energies for [AuCl(CNH)]2 are ∼0.14–1.4 eV higher for the monomer, while PBE remains almost constant and very close to the experimental luminescence spectra. Also, the emission energies for [AuCl(CO)]2 are ∼0.5–1.5 eV higher for the monomer.
The calculations show that the emission wavelength for the dimers is expected to be in the range of 400–650 nm, which agrees reasonably well with the experimental data for the solid-state material of both complexes.50 For the [AuCl(NCCy)] complex in solid state, the absorption and emission luminescence bands are around 270 and 600 nm, with a large Stokes shift (∼2.6 eV).50 The theoretical result at the PBE level is in agreement with the calculated absorption and spin-forbidden emission at 277 and 662 nm, respectively. Also, the Stokes shift S0 → T1 → S0 is 2.54 eV. However, the [AuCl(CO)] solid showed absorption and emission bands at 250 and 663 nm, respectively, with a large Stokes shift of ∼2.1 eV. The B3LYP and PBE results are in good agreement with the experimental data in the ranges of 257 and 313 nm for the absorption; and within 532 and 604 nm for emission. The Stokes shifts are in the range of 2.1–2.5 eV. Also, the comparison of the absorption and emission energies calculated at the DFT and the CC2 levels showed that the former underestimates the excitation energies with respect to CC2, although all the results show a similar trend.
From an experimental point of view, the large Stokes shifts can be attributed to the existence of exciplex formation with a shortening of the Au–Au distance in the excited state. Table 9 summarizes the Au–Au distance for the ground state and excited states (S1 and T1). We optimized the geometry for both excited states. In all methods used, we can see that for the [AuCl(CNH)]2 (5) and [AuCl(CO)]2 (8) dimer models, there is a strong shortening of the Au–Au distance. It was already possible to visualize this situation, when in the previous section it was shown that the main transition in the absorption spectra corresponded to a molecular orbital with strong bonding character among the gold atoms. This theoretical result confirms the predictions made by the Balch group in their experimental work on [AuX(CNCy)] complexes in the solid state.50
| Model | Method | Au–Au (S0) | Au–Au (S1) | Au–Au (T1) |
|---|---|---|---|---|
| [AuCl(CNH)]2 | SCS-MP2 | 356.6 | 281.9 | 263.7 |
| B3LYP | 350.8 | 269.5 | 267.7 | |
| PBE | 352.6 | 269.5 | 268.8 | |
| [AuCl(CO)]2 | SCS-MP2 | 356.9 | 290.7 | 297.2 |
| B3LYP | 345.9 | 273.7 | 271.3 | |
| PBE | 347.1 | 273.2 | 272.2 |
3.4 Aurophilic effect and optical properties
The aurophilic interactions are considered in most complexes to be mainly responsible for the electronic spectroscopic features, which have been proven to be highly dependent on the Au–Au distance.48 The complexes herein studied show two important attractive forces dominating the Au–Au attraction: dipole–dipole and dispersion. In this context, the dipole–dipole interaction is responsible for the formation of an antiparallel configuration between the monomeric units, and thus, for their final geometry. According to our results, this type of configuration determines the optical properties of the systems because it allows a shortening of the Au–Au distances. It has been shown to be an essential structural feature that defines the absorption and emission bands behavior of the complexes. The [AuCl(CNR)]2 (R = –H, –CH3, –Cy) and [AuCl(CO)]2 complexes show that the principal band is MMCT centered on the gold atoms for the absorption process. However, the emission energy shows a large Stokes shift that can be attributed to the existence of exciplex formation with shortening of the Au–Au distance in the excited state.In summary, taking into account the previous sections, although the aurophilic interaction is not relevant in the estimation of the direct electronic properties, it is mainly the equilibrium distances in the ground and first electronic state that define the optical properties of the complexes studied.
4. Conclusion
The main results presented in this study point toward the relationship among the intermolecular interaction energy, the gold–gold distance in dimers of various [AuCl(L)] systems, and their optical properties. The dominant terms are related to the properties of the monomers, and the antiparallel orientations of dimers show that the dipole–dipole and dispersion terms are relevant. For the models studied, the aurophilic attraction is composed of both terms. The dipole–dipole term fixes the antiparallel geometries in the dimers, which explains the experimental results and determines the optical properties in the complexes. Excitation energies of monomers, dimers, and tetramers calculated at the SCS-CC2 level agree well with the experimental excitation spectra. The SCS correction in the MP2 energy allowed a high efficiency method to be used at a low cost. It was shown that intermetallic interactions are mainly responsible for the MMCT in dimers and tetramers. Moreover, the calculated absorption and emission energies reproduce experimental behaviour with large Stokes shifts in the dimers at the SCS-CC2 and DFT levels. Finally, all models show strong dependence between the Au–Au intermolecular contacts in the T1 state and the optical bands with a shift effect seen in the experimental solid state data.Conflicts of interest
There are no conflicts to declare.Acknowledgements
Financial support of this work under Fondecyt project 1180158 and 1181082 is gratefully appreciated. Powered@NLHPC: this research was partially supported by the supercomputing infrastructure of the NLHPC (ECM-02).References
- G. M. Whitesides and R. F. Ismagliov, Science, 1999, 284, 89–92 CrossRef CAS PubMed.
- R. F. Ludlow and S. Otto, Chem. Soc. Rev., 2008, 37, 101–108 RSC.
- Thinking in Complexity, ed. K. Mainzer, Spinger-Verlang, New York, 3rd edn, 1997 Search PubMed.
- E. Mattia and S. Otto, Nat. Nanotechnol., 2015, 10, 111–119 CrossRef CAS PubMed.
- B. Grzybowski, S. Otto and D. Philp, Chem. Commun., 2014, 50, 14924–14925 RSC.
- O. Miljanic, Chem, 2017, 2, 502–524 CAS.
- Non-covalent Interactions in Quantum Chemistry and Physics, ed. A. Otero de la Roza and G. DiLabio, Elsevier, 2017 Search PubMed.
- J. F. Ayme and J.-M. Lehn, Adv. Inorg. Chem., 2018, 71, 3–78 CrossRef CAS.
- A. S. Mahadevi and G. N. Sastry, Chem. Rev., 2016, 116, 2775–2825 CrossRef CAS PubMed.
- P. Pyykkö, Chem. Soc. Rev., 2008, 37, 1967–1997 RSC.
- V. W.-W. Yam, V. K.-M. Au and S. Y.-L. Leung, Chem. Rev., 2015, 115, 7589–7728 CrossRef CAS PubMed.
- E. R. T. Tiekink, Coord. Chem. Rev., 2017, 345, 209–228 CrossRef CAS.
- P. Pyykkö, Chem. Rev., 1997, 97, 597–636 CrossRef PubMed.
- P. Pyykkö, N. Runeberg and F. Mendizabal, Chem.–Eur. J., 1997, 3, 1451–1457 CrossRef.
- N. Runeberg, M. Schütz and H.-J. Werner, J. Chem. Phys., 1999, 110, 7210–7215 CrossRef CAS.
- P. Pyykkö, Angew. Chem., Int. Ed., 2004, 43, 4412–4456 CrossRef PubMed.
- E. O'Grady and N. Kaltsoyannis, Phys. Chem. Chem. Phys., 2004, 6, 680–687 RSC.
- K. M.-C. Wong, V. K.-M. Au and V. W.-W. Yam, in Comprehensive Inorganic Chemistry II, ed. J. Reedijk and K. Poeppelmeier, Elsevier, Oxford, UK, 2nd edn, 2013, pp. 59–130 Search PubMed.
- M.-C. Tang, A. K.-W. Chan, M.-Y. Chan and V. W.-W. Yam, Top. Curr. Chem., 2016, 46, 374–405 Search PubMed.
- J. M. López-de-Luzuriaga, M. Monge and M. E. Olmos, Dalton Trans., 2017, 46, 2046–2067 RSC.
- R. Donamaría, M. C. Gimeno, V. Lippolis, J. M. López-de-Luzuriaga, M. Monge and M. E. Olmos, Inorg. Chem., 2016, 55, 11299–11310 CrossRef PubMed.
- Modern Supramolecular Gold Chemistry, ed. A. Laguna, Wiley-VCH, Weinheim, 2008 Search PubMed.
- E. J. Fernández, J. M. López-de-Luzuriaga, M. Monge, M. Montiel, M. E. Olmos, J. Pérez, A. Laguna, F. Mendizabal, A. A. Mohamed and J. P. Fackler, Inorg. Chem., 2004, 43, 3573–3581 CrossRef PubMed.
- V. W.-W. Yam, A. K.-W. Chan and E. Y.-H. Hong, Nat. Rev. Chem., 2020, 10, 528–541 CrossRef.
- F. Caddeo, V. Fernaández-Moreira, M. Arca, A. Pintus, A. Laguna, V. Lippolis and M. C. Gimeno, Dalton Trans., 2021, 50, 9709–9718 RSC.
- Gold-Progress in Chemistry, Biochemistry and Technology, ed. H. Schmidbaur, John Wiley & Sons, New York, 1999 Search PubMed.
- H. Schmidbaur and A. Schier, Chem. Soc. Rev., 2008, 37, 1931–1951 RSC.
- J. P. Fackler, Inorg. Chim. Acta, 2015, 424, 83–90 CrossRef CAS.
- J. Gil-Rubio and J. Vicente, Chem.–Eur. J., 2018, 24, 32–46 CrossRef CAS PubMed.
- G. Tárkányi, P. Király, G. Pálinkás and A. Deák, Magn. Reson. Chem., 2007, 45, 917–924 CrossRef PubMed.
- A. Deák, T. Megyes, G. Tárkányi, P. Király, L. Biczók, G. Pálinkás and P. J. Stang, J. Am. Chem. Soc., 2006, 128, 12668–12670 CrossRef PubMed.
- F. Mendizabal, S. Miranda-Rojas and L. Barrientos, Int. J. Quantum Chem., 2019, 119, e25675 CrossRef.
- P. Pyykkö and F. Mendizabal, Inorg. Chem., 1998, 37, 3018–3025 CrossRef.
- F. Mendizabal and P. Pyykkö, Phys. Chem. Chem. Phys., 2004, 4, 900–905 RSC.
- J. Muñiz, C. Wang and P. Pyykkö, Chem.–Eur. J., 2011, 17, 368–377 CrossRef PubMed.
- R.-F. Liu, C. A. Franzese, R. Malek, P. S. Zuchowski, J. G. Angyan, M. M. Szczesniak and G. Chalasinski, J. Chem. Theory Comput., 2011, 7, 2399–2407 CrossRef CAS PubMed.
- M. Andrejic and R. A. Mata, Phys. Chem. Chem. Phys., 2013, 15, 18115–18122 RSC.
- F. Mendizabal, S. Miranda-Rojas and L. Barrientos, Comput. Theor. Chem., 2015, 1057, 74–79 CrossRef CAS.
- E. Andris, P. C. Andrikopoulos, J. Schulz, J. Turek, A. Ruzicka, J. Roithova and L. Rulisek, J. Am. Chem. Soc., 2018, 140, 2316–2325 CrossRef CAS PubMed.
- F. Mendizabal, S. Miranda-Rojas and P. Castro-Latorre, Mol. Simul., 2020, 46, 521–529 CrossRef CAS.
- F. Mendizabal and S. Miranda-Rojas, RSC Adv., 2020, 10, 33549–33557 RSC.
- P. Castro-Latorre, S. Miranda-Rojas and F. Mendizabal, RSC Adv., 2020, 10, 3895–3901 RSC.
- L. Magnko, M. Schweizer, G. Rauhut, M. Schütz, H. Stoll and H.-J. Werner, Phys. Chem. Chem. Phys., 2002, 4, 1006–1013 RSC.
- P. Pyykkö, X.-G. Xiong and J. Li, Faraday Discuss., 2011, 152, 169–178 RSC.
- Q. Wan, J. Yang, W.-P. To and C.-M. Che, Proc. Natl. Acad. Sci. U. S. A., 2021, 118, e2019265118 CrossRef CAS PubMed.
- Q. Zheng, S. Borsley, G. S. Nichol, F. Duarte and S. L. Cockroft, Angew. Chem., Int. Ed., 2019, 131, 2–6 CrossRef.
- M. B. Brands, J. Nitsch and C. Fonseca-Guerra, Inorg. Chem., 2018, 57, 2603–2608 CrossRef CAS PubMed.
- P. Pyykkö and F. Mendizabal, Chem.–Eur. J., 1997, 3, 1458–1465 CrossRef.
- F. Mendizabal, Organometallics, 2001, 20, 261–265 CrossRef CAS.
- R. L. White-Morris, M. M. Olmstead, A. L. Balch, O. Elbjeirami and M. A. Omary, Inorg. Chem., 2003, 42, 6741–6748 CrossRef CAS PubMed.
- H. Kunkely and A. Vogler, J. Organomet. Chem., 1997, 541, 177–179 CrossRef CAS.
- P. G. Jones, Z. Naturforsch., 1982, 37b, 823–824 CrossRef CAS.
- J. Perdew, K. Burke and M. Ernzerhof, Phys. Rev. Lett., 1996, 77, 3865–3869 CrossRef CAS PubMed.
- A. D. Becke, Phys. Rev. A: At., Mol., Opt. Phys., 1988, 38, 3098–3100 CrossRef CAS PubMed.
- A. D. Becke, J. Chem. Phys., 2014, 140, 18A301 CrossRef PubMed.
- Y. Zhao and D. G. Truhlar, J. Chem. Phys., 2006, 125, 194101–194118 CrossRef PubMed.
- S. Grimme, S. Ehrlich and H. Krieg, J. Chem. Phys., 2010, 132, 154104–154119 CrossRef PubMed.
- W. Hujo and S. Grimme, J. Chem. Theory Comput., 2011, 7, 3866–3871 CrossRef CAS PubMed.
- S. F. Boys and F. Bernardi, Mol. Phys., 1970, 19, 553–566 CrossRef CAS.
- P. Habza and R. Zahradnik, Chem. Rev., 1988, 88, 871–897 CrossRef.
- Turbomole: R. Ahlrichs, M. Bär, M. Häser, H. Horn and C. Kölmel, Chem. Phys. Lett., 1989, 162, 165–169 CrossRef CAS.
- M. J. Frisch, et al., Gaussian 16, Pittsburgh, PA, 2003 Search PubMed.
- D. Andrae, M. Häusserman, H. Dolg, H. Stoll and H. Preuss, Theor. Chim. Acta, 1990, 77, 123–141 CrossRef CAS.
- A. Bergner, M. Dolg, M. W. Küchle, H. Stoll and H. Preuss, Mol. Phys., 1993, 80, 1431–1443 CrossRef CAS.
- T. Dunning and P. Hay, in Modern Theoretical Chemistry, ed. H. Schaefer, Plenum Press, 1997, vol. 3, pp. 1–28 Search PubMed.
- R. Bauernschmitt and R. Ahlrichs, Chem. Phys. Lett., 1996, 256, 454–464 CrossRef CAS.
- L. Olsen and P. Jörgensen, in Modern Electronic Structure Theory, ed. D. R. Yarkony, World Scientific, River Edge, NJ, 1995, vol. 2 Search PubMed.
- N. O. Winter and C. Hättig, J. Chem. Phys., 2011, 134, 184101–184115 CrossRef PubMed.
- M. Gerenkamp and S. Grimme, Chem. Phys. Lett., 2004, 392, 229–235 CrossRef CAS.
- N. O. Winter and C. Hättig, Chem. Phys., 2012, 401, 217–227 CrossRef CAS.
- H. Rabaa, M. A. Omary, S. Taubert and D. Sundholm, Inorg. Chem., 2018, 57, 718–730 CrossRef CAS PubMed.
- D. J. Liptropt and P. P. Power, Nat. Rev. Chem., 2017, 1, 004, DOI:10.1038/s41570-016-0004.
- A. D. Buckingham, P. W. Fowler and J. M. Hutson, Chem. Rev., 1988, 88, 963–988 CrossRef CAS.
- The Theory of Intermolecular Forces, ed. A. J. Stone, Clarendon Press, Oxford, 1996 Search PubMed.
- T. A. Koopmans, Physica, 1934, 1(1–6), 104–113 CrossRef.
| This journal is © The Royal Society of Chemistry 2022 |

