 Open Access Article
Developing the sensing features of copper electrodes as an environmental friendly detection tool for chemical oxygen demand
Esmat M. S. Elfekya,
Mohamed R. Shehata c,
Yahia H. Elbashard,
Mohammad H. Barakata and
Waleed M. A. El Rouby
 *b
*b
aHolding Company for Water and Wastewater (HCWW), Cairo, Egypt
bMaterials Science and Nanotechnology Department, Faculty of Postgraduate Studies for Advanced Science, Beni-Suef University, Beni-Suef, Egypt. E-mail: waleedmohamedali@yahoo.com; waleedmohamedali@psas.bsu.edu.eg
cChemistry Department, Faculty of Science, Cairo University, Giza, Egypt
dDepartment of Basic Science, El Gazeera High Institute for Engineering and Technology, Cairo, Egypt
First published on 2nd February 2022
Abstract
The chemical oxygen demand (COD) of water bodies is an essential indicator of organic contaminants. The majority of current testing methods have the drawbacks of requiring multiple processes, being time-consuming, and requiring the use of harmful and hazardous reagents. In this work, a low-cost copper wire (Cu-wire) electrode was designed and fabricated to be used as a sensing electrode for the detection of chemical oxygen demand in water. The sensing features were developed by electrodeposition of copper nanoparticles (nano-Cu) that were prepared by fast-scan cyclic voltammetry (FSCV) deposition at the optimum preparation conditions. For improving the adherence and stability of the deposited nano-Cu thin layer, the Cu-wire electrode was scratched to increase the surface roughness. The surface morphology of the prepared nano-Cu/Cu-wire electrode was investigated by scanning electron microscope (SEM). Energy-dispersive X-ray spectrometer (EDX) was used for elemental analysis characterization. The non-modified and the nano-copper modified electrode were utilized and optimized for electrochemical assay of COD using glycine as a standard in 0.075 M NaOH as an electrolyte solution. The calibration curves (COD, mg L−1 vs. I, mA) were plotted from linear sweep voltammetry (LSV) and chronoamperometry (I–t) curves for a wide range of COD under the optimized conditions. It shows that the electroanalytical features of the proposed nano-Cu-based COD sensor exhibit a linear range from 2 to 595 mg L−1 and a lower limit of detection (LOD) of 2.6 mg L−1 (S/N = 3). The established electrochemical method demonstrated a high tolerance level to Cl− ions where 1.0 M Cl− exhibited a negligible influence. The sensor was employed for detecting the COD in diverse real water samples and the attained results were validated using the standard dichromate method. The obtained results could open the window toward using simple and cost effective tools in order to monitor the water quality.
1 Introduction
With the advancement of contemporary industry, the preservation of water resources from pollution by waste effluents is becoming increasingly important. Organic molecules are a prevalent pollutant found in urban garbage, agricultural and livestock output, and industrial discharge. The chemical oxygen demand is an important measure for assessing the level of contamination caused by general organic chemicals, as it is a speedier alternative to the biochemical oxygen demand (BOD), which requires precise extensive estimating durations. COD is described as the amount of molecular oxygen (in mg of O2) necessary to breakdown all of the organic substances in 1 liter of aqueous environment to CO2 and H2O via chemical oxidation. In many countries, measuring COD with potassium dichromate as the oxidizer in H2SO4 media is a well-established and standardized method. However, because there is a reflux from 2 to 4 h in the process, and several expensive (Ag), corrosive (H2SO4 and Cr2O72−), and highly toxic (Hg and Cr(VI)) reagents are needed during the procedure, this approach is time-consuming, expensive, and ecologically dangerous.1To overcome the limitations of the traditional method, some novel trials and approaches have been investigated, some of which include the use of sensors. For the detection of COD, Teixeira designed a unique photochemiresistor sensor utilizing m-bismuth vanadate semiconductor.2 To develop a quick approach, Kong and Wu used UV spectroscopy to determine COD values in printing and dyeing wastewater effluents.3 Depending on a potassium permanganate–glutaraldehyde, Cheng and coworkers devised an elevated chemiluminescence approach for the determination.4 The COD concentrations of effluents were also determined using photocatalytic and photo-electrocatalytic techniques.5,6 Wang et al.7 has developed a portable photoelectrochromic visualization sensor for COD monitoring.
The challenge for electrochemical detection is to find a suitable simple technique, environmentally friend, highly sensitive, short analysis time and low cost. These factors deliver uses of solid electrodes in sensing and sensors with promising advantages as high sensitivity, accuracy, stability and reproducibility, low detection, and quantification limits.8,9 Solid electrodes become one the most appropriate electrodes for electroanalytical research for a wide range of applications in industry, water and wastewater quality monitoring, food and drug quality control.10,11 However, the solid electrode material selection depends on the redox behavior of the investigated electroactive species and the background current over the potential region required for the detection of the investigated analyte. The requirements imposed on electrodes are as follows: electrochemical inertness over a broad interval of potentials; high overvoltage of H2 and O2 evolution; low residual current; and easiness of surface treatment for good stability of applied material modified electrode.8,9,12
To realize the direct detection of COD electrochemically, many materials have been tested as electrocatalysts, including Cu-electrodes,8,9,12–15 CuO–AgO,16 Ni–Cu,17 nano-Ni,18 CoO,19 TiO2,5,20–37 PbO2,38 Pt-ring,39 nickel nanoparticle/nafion–graphene oxide (GO),40 boron doped diamond (BDD),41 Ti/Sb-SnO2/PbO2,34 WO3/W,42 palladium–graphene.43
COD analysis was developed over time starting from a simple titrimetric method to the novel sensing methods till now. The main concept of this development is to overcome some of the disadvantages as environmental impact, cost control and operation easiness.12 Herein, a modified copper electrode proposed as COD sensor for water quality monitoring. The proposed modified Cu electrode was prepared by FSCV technique and used for investigating a variety of water samples (synthetic, real). Which could enable the use of COD sensors as an online analyzer tool for monitoring the water resources and pollution control.
2 Materials and methods
2.1 Reagents and materials
Chemicals were purchased with high purity of minimum assay 99.9% and used as received without further purification. Double distilled water was used in the preparation of all solutions. Ag2SO4, H2SO4, HgSO4, CuSO4·5H2O, K2Cr2O7, NaOH and (NH4)2Fe(SO4)2 were purchased from Panreac (Spain), Sigma-Aldrich (USA) and glycine. Potassium Hydrogen Phthalate (KHP) as standard organic compounds was purchased from ADWIC fine chemicals (Egypt).2.2 Electrochemical preparation of nano-Cu sensing film
Electrochemical preparation of nano-Cu films was performed on a potentiostat/galvanostat (EG&G Princeton Applied Research, Model 273A). A conventional three-electrode system was employed. The working electrode was 1.5 mm diameter of commercially available/household electrical Cu-wire, the reference electrode was Ag/AgCl/(3.0 M KCl), the counter electrode was a platinum wire and the electrolyte solution was 0.075 M NaOH.Before electrodeposition, Cu-wire electrodes (6 electrodes) were treated mechanically by grit emery paper 60 then thoroughly rinsed in bi distilled water. The Cu-wire sensing film was electrodeposited from 4 mM CuSO4/1 mM H2SO4 by FSCV, the potential scan window was from 0.1 to −1.3 V for different (n) cycles at 100 mV s−1. The resulting electrodes coated with a thin film of CuNPs were rinsed with double distilled water to remove any adsorbed species before use.
2.3 Characterization of the prepared Cu electrodes
Field Emission Scanning Electron Microscopy (FESEM; Zeiss, Sigma 500 VP) was used for studying the surface morphology of the prepared Cu film on the surface of Cu wire. The elemental analysis of the obtained film was evaluated using the energy dispersive X-ray spectrometer detector (EDX; BRUKER) fixed on the SEM.2.4 Detection of COD using standard dichromate method
The closed reflux method was used to measure the COD values of real water samples taking into consideration the sampling (composite, grab) for sewage and wastewater samples that have high COD values and long term of interferences (Cl−, NO2−) as reported in the literature. Briefly, 10 mL water sample and 10 mL 0.04 M K2Cr2O7 solution were added into a 250 mL round-bottomed flask and refluxed for 2 h at 150 °C. Then the excess dichromate was determined using titration against 0.025 M Fe(NH4)2(SO4)2·6H2O and (2 to 3 drops) ferroin indicator. The value of COD was calculated according to the literature procedures.442.5 COD detection by the proposed sensing method
Before measurements, the real samples (water and wastewater) were filtrated using (GAST, USA) filtration apparatus, equipped with cellulose nitrate (pore size ∼0.2 μm) filter paper. The oxidation current obtained from LSVs was determined with a standard addition method. Standard COD solutions of different concentrations in the range 20–40 mg L−1 were added to a series of 100 mL flasks, each containing 5 mL of a filtered fresh real water sample, the volume of each flask complete to 100 mL using 0.075 M NaOH. The testing solution was placed into an electrochemical cell to measure the oxidation current where the coated copper wire was used as a working electrode. The oxidation current is proportional to the concentration of COD in the samples. All measurements were performed at room temperature (∼25 °C).3 Results and discussion
3.1 Characterization of Cu electrode surface morphology
Before surface treatment of the working electrode, mechanical treatment for Cu electrodes has been done to enhance the adhesion with the substrate surface and the film stability. Vigorous surface polishing of the prepared thin Cu film modified electrode may destroy the surface properties. Various sizes of CuNPs were electrodeposited on the Cu electrode via FSCV by varying the deposition time (e.g. scan rate, potential range and number of cycles).SEM images were taken for the free Cu-wire electrode and the prepared nano-Cu/Cu-wire electrode by FSCV at n = 30 cycles prepared previously at the optimum condition of preparation. It is clear that the non-modified Cu electrode has smooth surface features as seen in Fig. 1(A) and the magnified image indicated that there is no any identified particles at the surface as clear in the inset image of Fig. 1(A). However, after treatment of Cu electrode, there are many irregular shaped nanoparticles of copper are formed at the surface Fig. 1(B). The formed nanoparticles are monodispersed and distributed over the whole surface of Cu electrode.
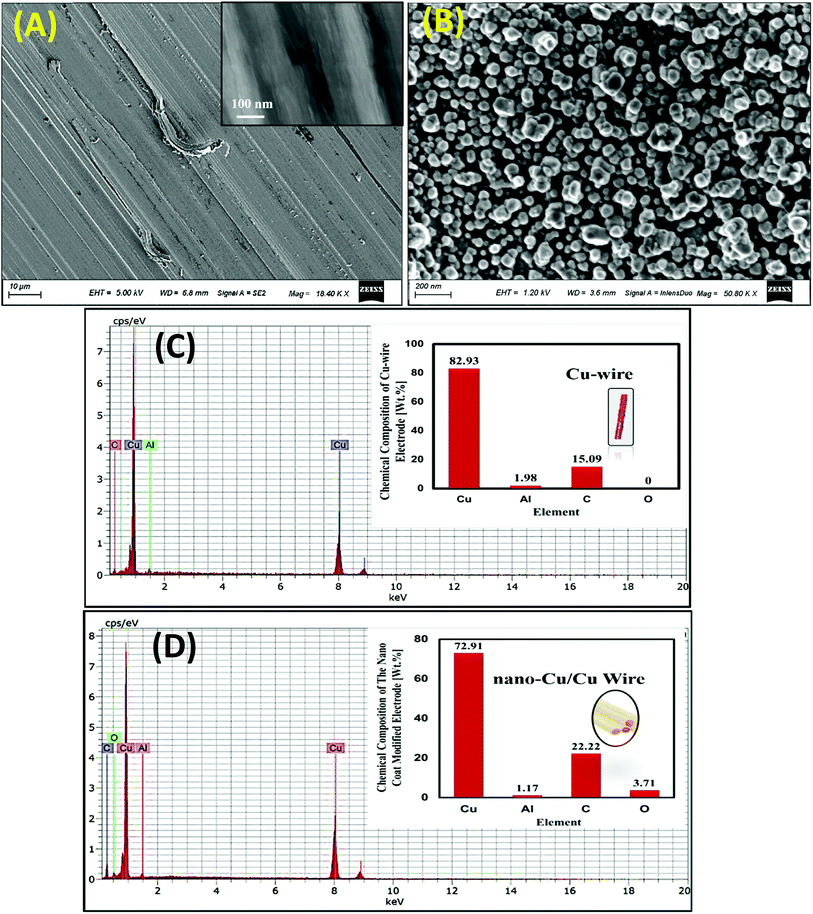 | ||
| Fig. 1 SEM images (A, B) and EDX analysis (C, D) for non-modified Cu-wire and nano-Cu/Cu-wire electrodes respectively. | ||
The chemical composition of the Cu-wire and nano-Cu/Cu-wire electrodes were analyzed by EDX (Fig. 1(C and D)) to determine the surface elements (%). It is cleare that the elemental composition of the non-modified Cu wire is Cu and some impurities of Al and C of low quantities Fig. 1(C).
The modification of Cu-electrode by nano-Cu based film that is composed of (Cu) as a bulk and minor impurities as (C), (Al) and (O) comes from the atmosphere as adsorbed CO2 or due to oxidation of the of some Cu particles on the surface as shown in Fig. 1(D). The formation of CuO enhance the electrocatalytic activity and the stability of the proposed nano-Cu modified Cu-wire electrode.
3.2 Electrocatalytic activity of Cu electrodes in alkaline medium
When Cu electrodes activated by cycling in an alkaline medium, it can electrocatalytically oxidize a wide range of organic species (synthetic, natural) responsible for COD. Cycling voltammetry has been adapted over the potential window from −1 to +0.7 V as indicated in Fig. 2. The oxidation peaks at (1) & (2) at −0.26 & −0.1 V respectively are corresponds to the formation of Cu-oxide species Cu(I)/Cu(II). At the potential of 0.70 V, the Cu species were oxidized and Cu(II)/Cu(III) was formed. In the reverse scan it is clearly seen that the reduction peaks (3) & (4) at −0.59 & −0.88 V respectively correspond to Cu-oxide species of Cu(II)/Cu(0) reduction reactions.8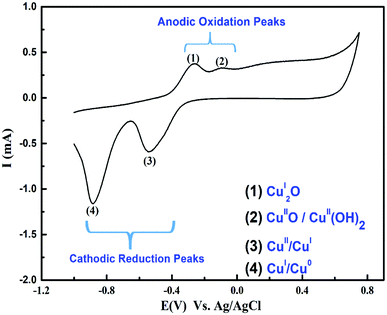 | ||
| Fig. 2 Cyclic voltammogram of Cu-wire electrode in 0.075 M NaOH over a potential scan window −0.1 V to +0.7 V and scan rate 100 mV s−1 at 25 °C. | ||
A solution of 0.075 M NaOH is used as an electrolyte to enhance the catalytic activity by formating hydroxyl radical (OH˙). This radical has a high oxidation potential and enhances the formation of Cu(III)OOH and Cu(OH)4. At high NaOH concentrations (>0.1 M) a large background noise was obtained. In addition, a lot of gas bubbles were observed on the modified electrode surface, causing difficulty in the measurement of the low current signal and decline in the sensitivity towards low COD concentrations. Thus, 0.075 M was chosen as the optimal concentration of COD detection.
Cu(III) is central in the electrocatalytic oxidation of organic compounds in the basic medium.3 The expected electro-catalytic oxidation of organic compounds (e.g., glycine) at the copper electrodes in the basic medium as follows:
| Cu + 2OH− → Cu(OH)2 + 2e− | (1) |
| Cu(OH)2 + OH− → Cu(III)OOH + H2O + e− | (2) |
| Cu(III)OOH. + organics(red) + H2O → Cu(OH)2 + organics(oxid) + OH− | (3) |
3.3 Optimization of the electrodeposition parameters of nano-Cu film
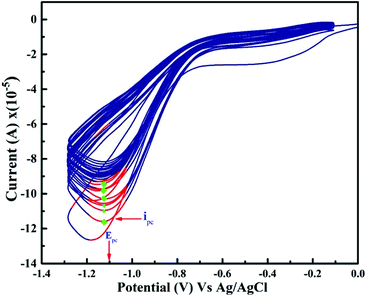
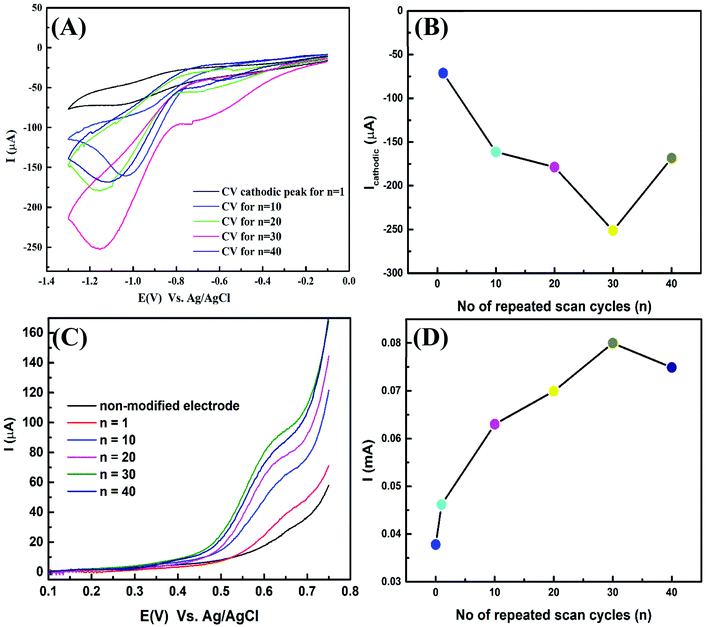
FSCV deposition of the nano-Cu film was deposited on the Cu-wire using the FSCV deposition technique at different number of cycles (n) of Cu-wire electrode at potential scan window between −0.1 to −1.3 V in 4 mM CuSO4/1 mM H2SO4 as indicated in Fig. 3. The resulting cathodic peak potential (Epc) is reached when all the substrate at the surface of the electrode has been reduced. In an stirred solution, mass transport of the analyte (Cu++) to the electrode surface occurs by diffusion and continual decrease on the current ipc due to unstirred Cu electrode.From CV and LSV experiments (current vs. potential), the potential swept between two values are often used to study the kinetics of electron transfer reactions including catalysis. The peak current response through the redox reaction by the electroactive species is recorded. It is noted that the maximum cathodic peak current at a potential −1.1 V is repetitive. The optimum condition of preparation is investigated by FSCV deposition for Cu-wire electrodes at a different number of cycles and determines the highest oxidation response by LSVs. Fig. 4(A) plotting the last CV curves obtain at different (n) cycles. Fig. 4(B) shows the relation between the (n) and the value of ipc. As clearly seen, with increasing the number of electrodeposition cycles, ipc was reaching the maximum at n = 30. For these prepared Cu-wire electrodes at n = 30, the LSVs were measured in 75 mg L−1 gly/0.075 M NaOH electrolyte as presented in Fig. 4(C). It was found that there is oxidation peak appeared at a potential of 0.6 V due to oxidation of glycine at (Cu electrode) as a catalyst and with increasing the surface area at Cu particles thin film modified Cu-wire electrode the electrocatalytic oxidation was increased. The electrode prepared by CV for n = 30 cycles shows the highest oxidation peak current response (Fig. 4(D)) and was selected as the optimal condition of preparation.
LSV experiments were carried out with the Cu electrode modified nano-Cu film to establish the effect of scan rate at a constant concentration (75 mg L−1) of glycine in 0.075 M NaOH. The anodic oxidation process can be described by Randles–Sevčik equation (eqn (4))
| Ip = (2.99 × 10⁵)n[(1 − α)nα]1/2ACb(Dν)1/2 | (4) |
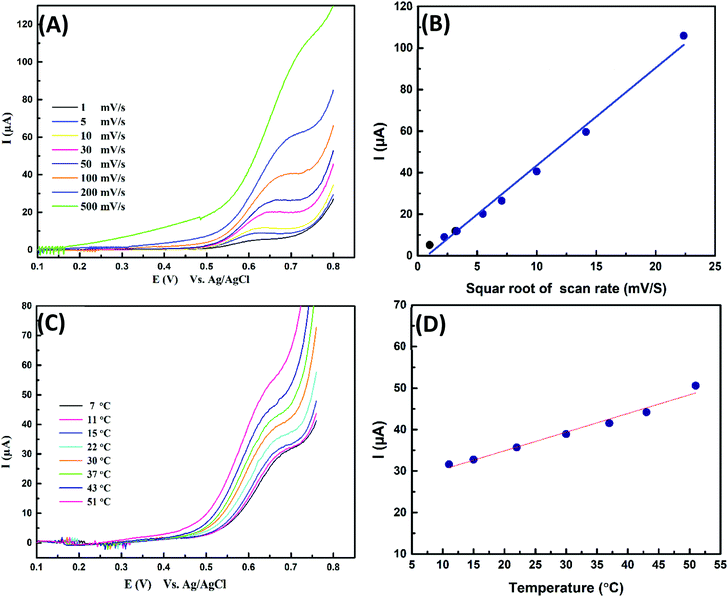
The electrocatalytic oxidation process is a diffusion-controlled process. LSV experiment (Fig. 5(A)) was performed at different scan rates for 75 mg L−1 gly/0.075 M NaOH, it is noted a linear relationship between the oxidation current and square root of scan rate with a positive shift with increasing scan rate as shown in Fig. 5(B). Furthermore, the electrocatalytic oxidation was examined at a different temperature; the oxidation response increased by temperature via increasing the diffusion rate, mass transport and charge transfer between the activated species (Cu(III) & organics) Fig. 5(C and D). Thus, we must take part in the effect of applied room temperature in running some of the specific features of sensors that require running the experiment at a different time as reversibility, reproducibility, stability, and lifetime of the proposed COD sensors.
3.4. Amperometric detection of COD
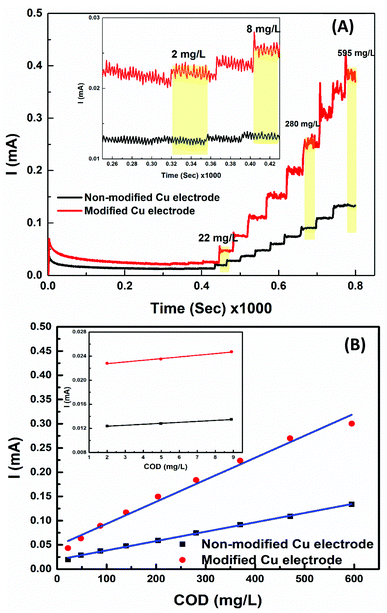
Chronoamperometry (I–t) response curve for Cu-wire electrode and nano-Cu based COD sensor has been used for the investigation (Fig. 6(A)). The electrolyte solution and the applied potential that is suitable for background current and detection of low COD concentrations have been selected. The effect of applied potential on (I–t) response curve was examined. It is found by running the amperometric detection at different applied potentials, the oxidation current signal of glycine remarkably increases with raising the detected potential from 0.6 to 0.9 V. The higher oxidation potential causes faster electron transfer and certainly enhances the oxidation current. When we further change the detected potential from 0.8 to 1 V, the oxidation current of glycine increases slightly, and the background current significantly increases. So, 0.075 M NaOH electrolyte solution and 0.75 V as the applied potential for suitable background current for detection of a wide range of COD values.46–48Analytical spike addition of COD concentrations (i.e., glycine), well-defined oxidation current signals was observed at Cu-wire electrode and nano-Cu based sensor. Background current decreases dramatically and attains a steady state at about 250 s. Upon increasing the COD concentrations, the oxidation current signals at Cu-wire and nano-Cu/Cu-wire linearly increases. With further increasing the additions of COD, the increment in oxidation current signal decreases (Highest Detection Limit, HDL) then inversely relationship as indicated in Fig. 6(A). The proposed sensors exhibited a fast response time of about 1 s at low COD values and 2 s for COD values higher than 300 mg L−1.
3.5 Analysis of real samples and recovery study
The developed COD sensor reliability was tested practically by analyzing different real water samples and synthetic samples simultaneously by both the classical dichromate method and the developed sensing method (nano-Cu/Cu-electrode). By calculating the relative error between the values of the two methods, it was found that the data changed from −0.6 to 12.6% and exhibited appropriate recovery as indicated in Table 1, in addition to the good correlation between the two methods, it showed linear regression coefficient: COD nano-Cu sensor (mg L−1) = 0.862 COD dichromate (mg L−1) + 6.18 (R2 = 0.995) and COD nano-Cu sensor (mg L−1) = 0.979 COD dichromate (mg L−1) − 0.768 (R2 = 0.997) for real water samples and synthetic samples, respectively as indicated in Fig. 7 with good evidence for using the new method for water quality and pollution monitoring.| COD values (mg L−1) | Recovery (%) | Relative error (%) | ||
|---|---|---|---|---|
| COD (nano-Cu sensor) | COD (di-chromate) | |||
| Real water samples | ||||
| 1 | 39.9 | 40.6 | 101.6 | 1.6 |
| 2 | 119.9 | 121.9 | 101.7 | 1.7 |
| 3 | 47.4 | 54.2 | 114.3 | 12.6 |
| 4 | 30.6 | 30.5 | 99.8 | −0.3 |
| 5 | 17.0 | 17.0 | 99.9 | −0.6 |
![[thin space (1/6-em)]](https://www.rsc.org/images/entities/char_2009.gif) |
||||
| Synthetic samples | ||||
| 1 | 69.20 | 73.4 | 106.1 | 5.7 |
| 2 | 102 | 111.9 | 109.7 | 8.8 |
| 3 | 62.8 | 62.9 | 100.2 | 0.2 |
| 4 | 39.1 | 39.3 | 100.5 | 0.5 |
| 5 | 42.6 | 42.9 | 100.6 | 0.7 |
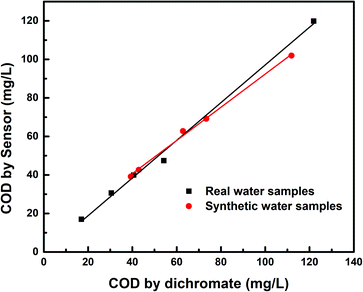 | ||
| Fig. 7 Co-relation between the data obtained from the analysis of COD by dichromate method for real water samples and synthetic samples in comparison with the data obtained by the nano-Cu sensor. | ||
3.6 Comparison with reported COD sensors
In comparison with the previously reported COD sensors based on electrode modification (e.g., electrodeposition of metallic nanomaterial,3–5 electrode modified film,19 composite electrodes,49 polymerization,50 activated electrodes,51 electrodes recently proposed with new electroanalytical features).26,40,50 The optimized nano-Cu/Cu-electrode prepared by FSCV exhibited lower LOD and high stability with high tolerance level towards inorganic interferences in comparison with listed electrochemical sensors in Table 2.| Sensor type | Target electro active species | Detection limit (mg L−1) | Linear range (mg L−1) | Electrode fouling (M) | Reproducibility (%) | Stability (%) |
|---|---|---|---|---|---|---|
| F-PdO2 sensor52 | Glucose | 15.5 | 100 to 1200 | If (CCl−/COD < 2.5) has no effect | 0.8 | 15 day deviate the response by ±5% |
| Activated Cu electrode16 | Glucose | 20.3 | 53.0 to 2801.4 | Sulphur-containing organics | ND | 15 day period |
| WO3/W nanopores42 | Light intensity of 214 μW cm−2 | 1.0 | 3 to 60 | ND | ND | ND |
| Nano-Ni/GCE53 | Glucose | 1.1 | 10 to 1533 | 0.02 | 4.7 | ≤5.5 |
| NiCu-alloy/GCE17 | Glucose | 1.0 | 10 to 1533 | 1.0 M has no effect on response | 3.6 | RSD = 4.2% of a series of NiCu/GCE sensors |
| Boron doped diamond (BDD)41 | Glucose, KHP, phenol | 7.5 | 20 to 9000 | ND | 1.87 | 4.31 |
| Pt-ring + Pt/PbO2-disk39 | Glucose, indigo, HQ | 15 | 10 to 500 & 500 to 5000 | ND | ND | Exhibits high stability |
| AgO–CuO sensor49 | AgO–CuO | 4.3 | 5 to 1400 | ND | Electrodes exhibit a high reproducibility, robustness, and storage stability for at least 1 year without renewal of the CPE surface | |
| Activated GCE electrode51 | Real water sample | 0.33 | 3.9 to 58.3 studied range | 0.02 | 5.6 to 8.7 | ND |
| A self-supported CuO/Cu nanowire electrode54 | Glucose, ascorbic acid, lactose and glycine | 2.3 | 5 to 1153 | 1.0 | 2.23 | 3.48 |
| Co-oxide/GCE19 | Real water sample | 1.1 | 1.7 to 170 | 0.02 | 5.7 | ND |
| Nafion CuO/Cu electrode50 | Glucose | 2.11 | 50 to 1000 | 10 mg L−1 by Cl− interference | 6.03 | |
| TiO2/Ti/TiO2-Pt55 | KHP | 9.5 | 10 to 1533 | 1400 mg L−1 Cl− | 3.6 | Good stability |
| Anatase-branch@hydrogenated rutile-nanorod TiO2 (AB@H-RTNR) photoelectrode26 | 6 carbon source (glucose, glycine, L-cysteine, KHP, D-ribose, sod acetate) | 0.2 | 1.25 to 576 | ND | 1.5 | Stable for 3000 measurement |
| This article nano-Cu/Cu-wire electrode | Glycine | 2.6 | 2 to 595 | 1.0 M Cl− & 0.01 M NO2− | 1.10 | Storing in air (stable about one week with no change) |
| Storing in water (stability enhanced for at least 1 year) |
4 Conclusion
A sensing electrode for the detection of chemical oxygen demand in water was fabricated easily from available household Cu-wire. The Cu wire surface was modified by copper nanoparticles (nano-Cu) using FSCV electrodeposition technique. The modified Cu electrode COD sensor was found to be environmentally find and with economic cost. It characterized by its fast electroanalytical detection response time and stable and reproducible response over a period of time. The modified nano-Cu electrode showed an excellent trend for a wide range of COD concentrations. In addition, the developed sensor shows excellent sensitivity toward COD with a lower detection limit of 2 mg L−1 with a linear range of 2 to 595 mg L−1. Moreover, it possesses a high tolerance level towards inorganic interferences Cl−, NO2− of about 1.0 M, 0.1 M respectively. Analysis of real water samples by the newly developed nano-Cu modified COD sensor showed a good agreement (good repeatability) compared to the standard dichromate method, with low relative standard deviation and good accuracy with acceptable blank recovery results. This is assuring that using the new nano-Cu/Cu-wire electrode in the routine analysis of different kinds of water resources including surface water (e.g., drinking water, lakes and rivers) with low COD value up to industrial wastewater with high COD content, will help in enhancing water quality monitoring.Conflicts of interest
There are no conflicts to declare.Acknowledgements
Authors express their deep gratitude to Dr Ahlam M. Fathi (Physical Chemistry Department-National Research Center) and Dr Mohammed Ismaeil (General Manager of Reference Laboratories for Wastewater at HCWW) for their help in applying the new technologies in the water field and looking at the advancement of Egypt's water future.References
- M. Gutiérrez-Capitán, A. Baldi, R. Gómez, V. García, C. Jiménez-Jorquera and C. Fernández-Sánchez, Anal. Chem., 2015, 87, 2152–2160 CrossRef PubMed.
- N. A. Alves, A. Olean-Oliveira, C. X. Cardoso and M. F. S. Teixeira, ACS Appl. Mater. Interfaces, 2020, 12, 18723–18729 CrossRef CAS PubMed.
- H. Kong and H. Wu, Water Environ. Res., 2009, 81, 2381–2386 CrossRef CAS PubMed.
- H. Yao, B. Wu, H. Qu and Y. Cheng, Anal. Chim. Acta, 2009, 633, 76–80 CrossRef CAS PubMed.
- L. Zhu, Y. Chen, Y. Wu, X. Li and H. Tang, Anal. Chim. Acta, 2006, 571, 242–247 CrossRef CAS PubMed.
- C. Li and G. Song, Sens. Actuators, B, 2009, 137, 432–436 CrossRef CAS.
- Z. Dai, N. Hao, M. Xiong, X. Han, Y. Zuo and K. Wang, Anal. Chem., 2020, 92, 13604–13609 CrossRef CAS PubMed.
- H. H. Hassan, I. H. A. Badr, H. T. M. Abdel-Fatah, E. M. S. Elfeky and A. M. Abdel-Aziz, Arabian J. Chem., 2018, 11, 171–180 CrossRef CAS.
- I. H. A. Badr, H. H. Hassan, E. Hamed and A. M. Abdel-Aziz, Electroanalysis, 2017, 29, 2401–2409 CrossRef CAS.
- R. A. Durst, Pure Appl. Chem., 1997, 69, 1317–1324 CAS.
- B. Uslu and S. A. Ozkan, Comb. Chem. High Throughput Screening, 2007, 10, 495–513 CrossRef CAS PubMed.
- R. B. Geerdink, R. S. van den Hurk and O. J. Epema, Anal. Chim. Acta, 2017, 961, 1–11 CrossRef CAS PubMed.
- L. Tian and B. Liu, Appl. Surf. Sci., 2013, 283, 947–953 CrossRef CAS.
- T. You, O. Niwa, M. Tomita, H. Ando, M. Suzuki and S. Hirono, Electrochem. Commun., 2002, 4, 468–471 CrossRef CAS.
- Y. Zhang, L. Su, D. Manuzzi, H. V. E. de los Monteros, W. Jia, D. Huo, C. Hou and Y. Lei, Biosens. Bioelectron., 2012, 31, 426–432 CrossRef CAS PubMed.
- C. R. Silva, C. D. C. Conceição, V. G. Bonifácio, O. Fatibello Filho and M. F. S. Teixeira, J. Solid State Electrochem., 2009, 13, 665–669 CrossRef CAS.
- Y. Zhou, T. Jing, Q. Hao, Y. Zhou and S. Mei, Electrochim. Acta, 2012, 74, 165–170 CrossRef CAS.
- T. Jing, Y. Zhou, Q. Hao, Y. Zhou and S. Mei, Anal. Methods, 2012, 4, 1155–1159 RSC.
- J. Wang, C. Wu, K. Wu, Q. Cheng and Y. Zhou, Anal. Chim. Acta, 2012, 736, 55–61 CrossRef CAS PubMed.
- H. Zhao, D. Jiang, S. Zhang, K. Catterall and R. John, Anal. Chem., 2004, 76, 155–160 CrossRef CAS.
- S. Zhang, L. Li, H. Zhao and G. Li, Sens. Actuators, B, 2009, 141, 634–640 CrossRef CAS.
- J. Zhang, B. Zhou, Q. Zheng, J. Li, J. Bai, Y. Liu and W. Cai, Water Res., 2009, 43, 1986–1992 CrossRef CAS PubMed.
- J. Li, L. Zheng, L. Li, G. Shi, Y. Xian and L. Jin, Electroanal. Int. J. Devoted Fundam. Pract. Asp. Electroanal., 2006, 18, 2251–2256 CAS.
- C. Wang, J. Wu, P. Wang, Y. Ao, J. Hou and J. Qian, Sens. Actuators, B, 2013, 181, 1–8 CrossRef CAS.
- S. Zhang, L. Li and H. Zhao, Environ. Sci. Technol., 2009, 43, 7810–7815 CrossRef CAS PubMed.
- M. Zu, M. Zheng, S. Zhang, C. Xing, M. Zhou, H. Liu, X. Zhou and S. Zhang, Sens. Actuators, B, 2020, 321, 128504 CrossRef CAS.
- X. Wang, S. Zhang, H. Wang, H. Yu, H. Wang, S. Zhang and F. Peng, RSC Adv., 2015, 5, 76315–76320 RSC.
- K.-H. Lee, Y.-C. Kim, H. Suzuki, K. Ikebukuro, K. Hashimoto and I. Karube, Electroanal. Int. J. Devoted Fundam. Pract. Asp. Electroanal., 2000, 12, 1334–1338 CAS.
- J. Li, L. Zheng, L. Li, G. Shi, Y. Xian and L. Jin, Electroanal. Int. J. Devoted Fundam. Pract. Asp. Electroanal., 2006, 18, 1014–1018 CAS.
- J. Li, L. Zheng, L. Li, G. Shi, Y. Xian and L. Jin, Meas. Sci. Technol., 2007, 18, 945 CrossRef CAS.
- H. Wang, S. Zhong, Y. He and G. Song, Sens. Actuators, B, 2011, 160, 189–195 CrossRef CAS.
- Z. Zhang, Y. Yuan, Y. Fang, L. Liang, H. Ding and L. Jin, Talanta, 2007, 73, 523–528 CrossRef CAS PubMed.
- J. Li, L. Li, L. Zheng, Y. Xian and L. Jin, Meas. Sci. Technol., 2006, 17, 1995 CrossRef CAS.
- C. Ma, F. Tan, H. Zhao, S. Chen and X. Quan, Sens. Actuators, B, 2011, 155, 114–119 CrossRef CAS.
- S. Ai, J. Li, Y. Yang, M. Gao, Z. Pan and L. Jin, Anal. Chim. Acta, 2004, 509, 237–241 CrossRef CAS.
- Y. Chai, H. Ding, Z. Zhang, Y. Xian, Z. Pan and L. Jin, Talanta, 2006, 68, 610–615 CrossRef CAS PubMed.
- R. Wang, M. Zu, S. Yang, S. Zhang, W. Zhou, Z. Mai, C. Ge, Y. Xu, Y. Fang and S. Zhang, Sens. Actuators, B, 2018, 270, 270–276 CrossRef CAS.
- S. Ai, M. Gao, Y. Yang, J. Li and L. Jin, Electroanal. Int. J. Devoted Fundam. Pract. Asp. Electroanal., 2004, 16, 404–409 CAS.
- P. Westbroek and E. Temmerman, Anal. Chim. Acta, 2001, 437, 95–105 CrossRef CAS.
- B. Zhang, L. Huang, M. Tang, K. W. Hunter, Y. Feng, Q. Sun, J. Wang and G. Chen, Microchim. Acta, 2018, 185, 1–9 CrossRef PubMed.
- H. Yu, C. Ma, X. Quan, S. Chen and H. Zhao, Environ. Sci. Technol., 2009, 43, 1935–1939 CrossRef CAS PubMed.
- X. Li, J. Bai, Q. Liu, J. Li and B. Zhou, Sensors, 2014, 14, 10680–10690 CrossRef CAS PubMed.
- L. H. Abdel-Rahman, A. A. Abdelhamid, A. M. Abu-Dief, M. R. Shehata and M. A. Bakheet, J. Mol. Struct., 2020, 1200, 127034 CrossRef CAS.
- APHA-AWWA-WPCF, Standard methods for the examination of water and wastewater, APHA American Public Health Association, 1981 Search PubMed.
- A. J. Bard, L. R. Faulkner, J. Leddy and C. G. Zoski, Electrochemical Methods: Fundamentals and Applications, Wiley, New York, 1980, vol. 2, p. 4 Search PubMed.
- J. Yang, J. Chen, Y. Zhou and K. Wu, Sens. Actuators, B, 2011, 153, 78–82 CrossRef CAS.
- H. Yu, H. Wang, X. Quan, S. Chen and Y. Zhang, Electrochem. Commun., 2007, 9, 2280–2285 CrossRef CAS.
- R. M. A. Hameed, Biosens. Bioelectron., 2013, 47, 248–257 CrossRef PubMed.
- J. Orozco, C. Fernández-Sánchez, E. Mendoza, M. Baeza, F. Céspedes and C. Jiménez-Jorquera, Anal. Chim. Acta, 2008, 607, 176–182 CrossRef CAS PubMed.
- T. Carchi, B. Lapo, J. Alvarado, P. J. Espinoza-Montero, J. Llorca and L. Fernández, Sensors, 2019, 19, 669 CrossRef PubMed.
- C. Wu, S. Yu, B. Lin, Q. Cheng and K. Wu, Anal. Methods, 2012, 4, 2715–2720 RSC.
- J. Li, L. Li, L. Zheng, Y. Xian, S. Ai and L. Jin, Anal. Chim. Acta, 2005, 548, 199–204 CrossRef CAS.
- Q. Cheng, C. Wu, J. Chen, Y. Zhou and K. Wu, J. Phys. Chem. C, 2011, 115, 22845–22850 CrossRef CAS.
- X. Huang, Y. Zhu, W. Yang, A. Jiang, X. Jin, Y. Zhang, L. Yan, G. Zhang and Z. Liu, Molecules, 2019, 24, 3132 CrossRef CAS PubMed.
- X. Qu, M. Tian, S. Chen, B. Liao and A. Chen, Electroanalysis, 2011, 23, 1267–1275 CrossRef CAS.
| This journal is © The Royal Society of Chemistry 2022 |

