DOI:
10.1039/D1RA08845A
(Paper)
RSC Adv., 2022,
12, 6855-6868
Study on the adsorption properties of multiple-generation hyperbranched collagen fibers towards isolan-series acid dyes
Received
5th December 2021
, Accepted 7th February 2022
First published on 1st March 2022
Abstract
In the present study, collagen fibers derived from leather solid wastes were used and modified as insoluble vectors and successfully employed as adsorbents for the removal of acid dyes. A “one-step” method was applied to synthesis effective adsorbents, which provided a sustainable way to reuse leather solid wastes via multifunctional modification. The adsorption properties of amino-terminated hyperbranched polymer (HBPN)-modified collagen fibers for the removal of different kinds of acid dyestuff from aqueous solutions were studied. The adsorption capacities of the second generation of modified collagen fibers (CF-HBPN-II) toward Isolan Black 2S-LD, Supralan Yellow, Isolan Grey K-PBL 02, Isolan Dark Blue 2S-GL 03, and Isolan Brown NHF-S were determined to be 224.87, 340.14, 287.36, 317.80, and 251.25 mg g−1, respectively. Three kinetic models, namely, pseudo-first-order, pseudo-second-order and intraparticle diffusion, were used to analyze the kinetic data. The fitting result indicated that the adsorption process of Isolan Black 2S-LD on CF-HBPN-II followed a pseudo-second-order rate model. The adsorption equilibrium of amino-terminated hyperbranched polymer-modified collagen fibers (CF-HBPN) was analyzed using the Langmuir, Freundlich and Temkin isotherm models. The Langmuir isotherm was suitable to describe the adsorption process of Isolan Black 2S-LD. RL was observed to be in the range of 0–1. The values of ΔH, ΔS and ΔG suggest that adsorption is an endothermic and spontaneous process. The adsorbed dye from the modified collagen fiber was successfully desorbed by 0.1 M NaOH. This research provides theoretical guidance for the engineering and recycling application of bio-based adsorbents.
1. Introduction
Dye effluents usually originate from leather, printing and dyeing, paper and dye intermediate production industries.1 The productivity of dyes in China reached 89.5 million tons, which is about 65% of the world total output. The main properties of dye effluents from the leather industry are as follows: (a) high chroma, mainly due to dyes, and tanning and auxiliary agents; (b) high chemical oxygen demand (a large number of organic materials existed too); and (c) turbidity due to the decomposition components of hide scrap.2 In the leather industry, anionic dyes, direct dyes and metal complex dyes are three kinds of common dyes. The common treatment methods for dying wastewater are as follows: physical adsorption, membrane filtration,3 chemical coagulation, photo-catalytic oxidation, and electrochemical and biochemical processes. Adsorption is one of the most effective methods for dye treatment using porosity solids such as active carbon,4–6 natural polymers and microporous resin. Chemical and physical modification of traditional adsorbents to improve the adsorption efficiency and recycling property has become a research hotspot in recent years.
In order to reduce the cost and make the adsorbent price-attractive, many kinds of industrial waste materials, for instance, chitosan and agriculture wastes have been reused in the preparation of adsorbents to remove heavy metals, and organic and inorganic materials from wastewater and many remarkable achievements have been achieved. In the leather-making process, large amounts of solid wastes and wastewater (tanning wastewater and dying wastewater) were generated, which brought great influence to the surrounding. Except for few non-collagenous protein hair (wool) and meat residues, most of the solid wastes are leftover materials and leather shavings. The reuse of this part of collagenous material is the critical part in the sustainable leather industry. Researchers did a lot of works focusing on the reuse of the solid waste generated in the leather industry,7 such as pet food,8 industrial oil,9 collagen extract,10 industrial gelatin and protein finishing agents.11,12 The preparation of new adsorption materials is one of the hotspots in the reuse of leather solid wastes.
The collagen fiber (CF) is a kind of fibrous material. It is also the main component of the hide and skin, which has good biocompatibility and biodegradability.13 The active groups on its surface, for example, carboxyl groups, amino groups and hydroxyl groups, are the fundamental conditions of the hide and skin being manufactured. The physical and chemical modifications of CFs endow it with better adsorption properties. For the removal of dyes by CFs, however, few investigations have been reported. Gu investigated decolouration and adsorption behaviors of three anionic dyes, namely,14 acid yellow 11, direct yellow 11 and reactive blue 19, on Fe(III), Zr(IV), and Al(III) immobilizing collagen fibers (MLCFs) at various initial concentrations and adsorbent doses. The adsorption capacity increased with the increase in MLCF dosage. Qiang examined the adsorption process of acid black dye NT on aminated collagen fibers and also evaluated the effects of pH,15 adsorption equilibrium, kinetics and thermodynamics. The results indicated that the Freundlich isotherm provided a better description of the adsorption process.
A hyperbranched polymer is a kind of highly branched polymer with three-dimensional structure and a unique cavity in its interior. It has good solubility and low viscosity properties. The multi-terminated groups on its exterior can be functionalized, which enable it with diversified and particular properties.16–18 In this work, the CF was modified with an amino-terminated hyperbranched polymer. The modification process not only brings more active groups onto the surface of collagen fibers, but also strengthens the three-dimensional structure of collagen fibers. Furthermore, dye adsorption experiments on the amino-terminated hyperbranched polymer-modified collagen fiber (CF-HBPN) were carried out in a single dying system. The influences of pH, temperature and adsorbent dose on the acid dye adsorption efficiency were studied. Meanwhile, the adsorption kinetics as well as adsorption isotherms were investigated. What is more, the adsorption mechanism was discussed. This study provides a new idea for the modification of collagen-based adsorbents and their application in dyeing wastewater treatment. Through the derivation of kinetics and isotherm, the adsorption mechanism can be understood, which provides theoretical guidance for the engineering application of this bio-based adsorbent.
2. Materials and methods
2.1 Materials
Five different kinds of acid dyestuffs were used in the research, including Isolan Black 2S-LD, Isolan Dark Blue 2S-GL 03, Supralan Yellow, Isolan Grey K-PBL 02, and Isolan Brown NHF-S. These dyes are all of industrial grade and obtained from DyStar Trading Co. Ltd (Shanghai, China). The properties of these dyes are shown in Table 1. These are 1![[thin space (1/6-em)]](https://www.rsc.org/images/entities/char_2009.gif) :
:![[thin space (1/6-em)]](https://www.rsc.org/images/entities/char_2009.gif) 2 metal complex disulfonated dyes.19–21
2 metal complex disulfonated dyes.19–21
Table 1 Properties of different acid dyes
| Acid dye |
λmax (nm) |
Property |
Usage |
| Isolan black 2S-LD |
568 |
1![[thin space (1/6-em)]](https://www.rsc.org/images/entities/char_2009.gif) : :![[thin space (1/6-em)]](https://www.rsc.org/images/entities/char_2009.gif) 2-metal complex dyes, disulfonated 2-metal complex dyes, disulfonated |
Leather, wool, textile |
| Isolan dark blue 2S-GL 03 |
570 |
| Supralan yellow |
438 |
| Isolan grey K-PBL 02 |
570 |
| Isolan Brown NHF-S |
350 |
2.2 Synthesis of adsorbents
The first generation of collagen fibers functionalized with amino-terminated hyperbranched polymers (CF-HBPN-I) were prepared by a “one-step” method (hyperbranched polymer grafting directly) according to our previous work,22 as shown in Fig. 1(a). Following the procedure reported in the literature, second-generation amino-terminated hyperbranched collagen fibers (CF-HBPN-II) were obtained when CF-HBPN-I was further reacted with glutaraldehyde and an amino-terminated hyperbranched polymer (HBPN). First, 2 g CF-HBPN-I and 50 mL glutaraldehyde solution were added into a three-necked flask. The concentration of glutaraldehyde solution is 2.51 g L−1. The pH of the solution was adjusted to 9. After reacting for 130 min, 10 mL HBPN solution was added into the 3-necked flask through a constant pressure drip funnel. The concentration of the HBPN solution was 8.957 g L−1. Then, they reacted for further 4 h. After the reaction, CF-HBPN-II was obtained by filtering the solution through a 100-mesh nylon fabric. The synthesis route for CF-HBPN-II is shown in Fig. 1(b).
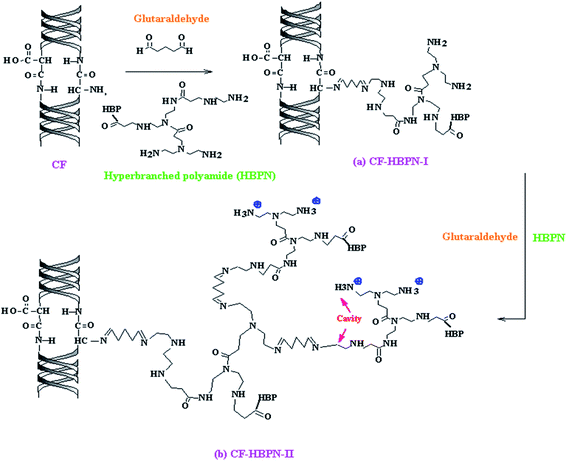 |
| | Fig. 1 Synthesis route of CF-HBPN-I (a) and CF-HBPN-II (b). | |
2.3 Characterization of adsorbents
2.3.1 Determination of amino group contents. The salicylic aldehyde method was used to determine the amino group content of the adsorbents.23 The adsorbent samples were first dehydrated with ethyl alcohol and dried to a constant weight. The CF, CF-HBPN-I and CF-HBPN-II were weighed and added into a conical flask. Then, 10 mL salicylic aldehyde-pyridine solution (0.5 mol L−1) was added into the flask separately. The flask was then put into a water bath thermostatic oscillator at 30 °C for 30 min. The blank contrast test was conducted by merely adding 10 mL salicylic aldehyde-pyridine solution (0.5 mol L−1) into the conical flask. After the reaction, the 100-mesh nylon cloth was used to filter the adsorbents. Then, 30 mL pyridine was used to rinse the samples and the wall of the conical flask. The filter was collected. Following this, 1 mL phenolphthalein-pyridine (1%) indicator was added into the conical flask. The sodium methoxide-pyridine (0.5 N) solution that was calibrated with benzoic acid was used to titrate the filter until the color of the solution changed to blue. The amino group content of the adsorbent was calculated using eqn (1):| |
 | (1) |
where V0 is the consumed volume of the sodium methoxide-pyridine solution by the blank contrast test, L; V1 is the consumed volume of the sodium methoxide-pyridine solution by the sample, L; N is the concentration of the sodium methoxide-pyridine solution calibrated with benzoic acid, mol L−1; M is the molar mass of the amino group, g mol−1; and m is the mass of the sample, g.
2.3.2 Amino acid analysis. The sample was prepared according to the GB/T 5009.124-2003.24 An L-8900 amino acid analyzer (Hitachi Ltd Co., Japan) was utilized to analyze the amino acid content of the sample.
2.3.3 Organic element analysis. The sample was first put into an electric drying oven for drying until the weight was constant. Then, 2–3 mg sample was weighed and analyzed using a Vario EL III type organic element analyzer (Elemeraor Ltd Co., Germany).
2.3.4 SEM. The morphology of the adsorbent was observed using an S4800 field emission scanning electron microscope (SEM, Hitachi, Japan). Platinum was sprayed onto the surface of the sample to increase the electrical conductivity.
2.3.5 BET. The sample was analyzed using a Gemini VII 2390 Automatic fast specific surface area and porosity analyzer (Micromeritics instruments Co. Ltd, American).
2.3.6 Particle size. The particle size of CF-HBPN-I and CF-HBPN-II was analyzed using a laser particle sizer. Before testing, the samples were ground and screened. The sample was first evenly dispersed in water ultrasonically. Then, the laser particle sizer (Mastersizer 2000, Malvern Panalytical Ltd, England) was employed to analyze the particle size.
2.3.7 FT-IR. FT-IR analysis of pristine CF-HBPN-II as well as consumed CF-HBPN-II was conducted to elucidate the adsorption mechanism using a Verte-70 FT-IR (Bruker, Germany).
2.4 Adsorption experiments
In this research, simulated dye solutions with different concentrations were prepared by diluting the stock solution of acid dyes, and the pH of the solution was adjusted to the expected value using a NaOH (0.1 M) or H2SO4 (0.1 M) solution. Various batch adsorption tests were carried out by mixing 50 mL of dye solution and adsorbents in a conical flask. Then, the flask was put into a constant temperature water bath oscillator for the reaction. The water content of adsorbents was approximately 55%. The adsorption comparison experiments toward five kinds of acid dyes by CF-HBPN-I and CF-HBPN-II were conducted under the following conditions: pH = 2.7, C0 = 300 mg L−1, solid (mg)/liquid (mL) ratio = 0.08![[thin space (1/6-em)]](https://www.rsc.org/images/entities/char_2009.gif) :
:![[thin space (1/6-em)]](https://www.rsc.org/images/entities/char_2009.gif) 100 and time = 2 h. Isolan Black 2S-LD was chosen as the target dye in the following experiments, because it is the most commonly used commercial dye in the leather industry. Adsorption experiments of Isolan Black 2S-LD on CF-HBPN-II were further carried out to evaluate the influence of adsorbent dosages (0.05–0.2 g), initial pH of the solution (1.5–5.5) and adsorption temperature (20–60 °C). The experiments were performed when one of the parameters was changed according to the setting trend and the others were fixed. The absorbance of the dye solution before and after adsorption was measured using a 722N visible spectrophotometer (Shanghai Sincere Dedication of Science and Technology Innovation). The average adsorption capacity from two parallel adsorbent samples was taken for each type of adsorbent.
100 and time = 2 h. Isolan Black 2S-LD was chosen as the target dye in the following experiments, because it is the most commonly used commercial dye in the leather industry. Adsorption experiments of Isolan Black 2S-LD on CF-HBPN-II were further carried out to evaluate the influence of adsorbent dosages (0.05–0.2 g), initial pH of the solution (1.5–5.5) and adsorption temperature (20–60 °C). The experiments were performed when one of the parameters was changed according to the setting trend and the others were fixed. The absorbance of the dye solution before and after adsorption was measured using a 722N visible spectrophotometer (Shanghai Sincere Dedication of Science and Technology Innovation). The average adsorption capacity from two parallel adsorbent samples was taken for each type of adsorbent.
The adsorption capacity and removal efficiency were calculated using eqn (2)–(4), respectively.
where
qt and
qe are the adsorption capacities at time
t and equilibrium (mg g
−1);
C0,
Ct and
Ce are the concentrations of the dye solution initially, at time
t and at equilibrium (mg L
−1);
V is the volume of the solution (L);
m is the dose of the adsorbent (g); and
R% is the removal efficiency of the dye from the solution.
2.4.1 Adsorption kinetics. The mass transfer tendency at different temperatures (30–50 °C) and contact time points, specifically, adsorption kinetics, was analyzed by the empirical model. First, 0.04 g of CF-HBPN-II was added to a set of conical flasks containing 50 mL of Isolan Black 2S-LD solution (C0 = 300 mg L−1). These flasks were then put into a constant temperature water bath oscillator at the setting temperature. During the reaction process, 3 mL samples were taken from the flask and filtrated at a settled time.
2.4.2 Adsorption isotherms. The adsorption equilibrium isotherms were analyzed by changing the initial concentrations of dye solutions and reaction temperatures (30–50 °C). A series of dye solutions with an initial concentration of 50–1000 mg L−1 were prepared. Then, 0.04 g of CF-HBPN-II was added to the flasks containing 50 mL of dye solution. The concentrations of dye solutions were measured when the adsorption process reached equilibrium.The empirical models used for the analysis of adsorption kinetics and isotherm data are given in Table 2, wherein three kinetic models were employed to study the dye removal dynamics, namely, the pseudo-first-order, pseudo-second-order, and intraparticle diffusion model. Furthermore, Langmuir, Freundlich, and Temkin equilibrium models were selected to describe the adsorption isotherm. By specifically analyzing the parameters of equations, the adsorption characteristics can be better described.
Table 2 Various models and equations utilized in the study
| |
Theoretical model |
Equations |
No |
Plot made |
| Adsorption kinetic |
Pseudo-first-order kinetics |
lg(qe − qt) = lg![[thin space (1/6-em)]](https://www.rsc.org/images/entities/char_2009.gif) qe − k1t/2.303 qe − k1t/2.303 |
(5) |
lg(qe − qt) versus t |
| Pseudo-second-order kinetics |
t/qt = 1/(k2qe2)+t/qe |
(6) |
t/qt versus t |
| Kannan intra-particle diffusion |
qt = kidt0.5 |
(7) |
qt versus t0.5 |
| Adsorption isotherm |
Langmuir |
1/qe = 1/(bqmCe)+1/qm |
(8) |
qe−1 versus 1/Ce |
| Freundlich |
ln![[thin space (1/6-em)]](https://www.rsc.org/images/entities/char_2009.gif) qe = ln qe = ln![[thin space (1/6-em)]](https://www.rsc.org/images/entities/char_2009.gif) kF + ln kF + ln![[thin space (1/6-em)]](https://www.rsc.org/images/entities/char_2009.gif) Ce/n Ce/n |
(9) |
ln![[thin space (1/6-em)]](https://www.rsc.org/images/entities/char_2009.gif) qe versus ln qe versus ln![[thin space (1/6-em)]](https://www.rsc.org/images/entities/char_2009.gif) Ce Ce |
| Temkin |
qe = B![[thin space (1/6-em)]](https://www.rsc.org/images/entities/char_2009.gif) ln ln![[thin space (1/6-em)]](https://www.rsc.org/images/entities/char_2009.gif) A + B A + B![[thin space (1/6-em)]](https://www.rsc.org/images/entities/char_2009.gif) ln ln![[thin space (1/6-em)]](https://www.rsc.org/images/entities/char_2009.gif) Ce Ce |
(10) |
qe versus ln![[thin space (1/6-em)]](https://www.rsc.org/images/entities/char_2009.gif) Ce Ce |
In Table 2, k1 is the adsorption rate constant of pseudo-first-order kinetics; k2 is the adsorption rate constant of pseudo-second-order kinetics; kid is the adsorption rate constant of the Kannan intra-particle diffusion; b is the Langmuir isotherm constant; qm is the maximum adsorption capacity; kF and n are the Freundlich isotherm constants; and A and B are the Temkin isotherm constants.
2.4.3 Thermodynamics parameters. Adsorption thermodynamics parameters were determined by using the thermodynamic equilibrium coefficients obtained at different temperatures to verify possible adsorption mechanisms. The degree of the adsorption process can be measured by the equilibrium parameter value RL that expresses the essential characteristic of the isotherm. It can be calculated using eqn (11). The Gibbs free energy change (ΔG, kJ mol−1) is associated with the spontaneity of the adsorption process, and it can be calculated using Gibbs free energy eqn (12). The Gibbs free energy is the difference between the adsorption enthalpy (ΔH, kJ mol−1) and the adsorption entropy (ΔS, kJ mol−1 K−1) at a constant temperature. Van't Hoff's eqn (13) can be used to determine the thermochemical parameters through the plot of ln![[thin space (1/6-em)]](https://www.rsc.org/images/entities/char_2009.gif) ka vs. 1/T. The angular coefficient is equal to ΔH/R and a linear coefficient is equal to ΔS/R. The entropy can be calculated using Gibbs–Helmholtz's eqn (14):
ka vs. 1/T. The angular coefficient is equal to ΔH/R and a linear coefficient is equal to ΔS/R. The entropy can be calculated using Gibbs–Helmholtz's eqn (14):| |
ΔG = −RT![[thin space (1/6-em)]](https://www.rsc.org/images/entities/char_2009.gif) ln ln![[thin space (1/6-em)]](https://www.rsc.org/images/entities/char_2009.gif) ka ka
| (12) |
| |
ln![[thin space (1/6-em)]](https://www.rsc.org/images/entities/char_2009.gif) ka = −ΔH/RT + ΔS/R ka = −ΔH/RT + ΔS/R
| (13) |
where b is the Langmuir isotherm constant, C0 is the initial concentration of dye solutions, mg L−1; R is the ideal gas constant, 8.314, J mol−1 K−1; T is the absolute temperature, K; ka is the thermodynamics equilibrium constant, L g−1, which was obtained from the slope of the initial linear portion of qe vs. Ce25 and converted to a dimensionless constant according to Milonjić,26 ka = bqeL,cal (where b is the Langmuir adsorption constant).
2.4.4 Regeneration study. The regeneration study is necessary to assess the regeneration capacity of the adsorbent for reuse in a more economic manner. First, 0.04 g adsorbent was mixed with 50 mL of 300 mg L−1 dye solution in the flasks and reacted at 30 °C until the equilibrium was reached. After that, the consumed adsorbent was collected by filtration and washed with distilled water. Then, it was dried at 50 °C for 12 h in the oven. The adsorption capacities were calculated according to eqn (2). The utilized adsorbents were mixed with deionized water or 0.1 M NaOH solution (the solid (mg)/liquid (mL) ratio of 1![[thin space (1/6-em)]](https://www.rsc.org/images/entities/char_2009.gif) :
:![[thin space (1/6-em)]](https://www.rsc.org/images/entities/char_2009.gif) 2) in the flasks and shaken at 30 °C for 2 h. The amount of dye desorbed (mg) was calculated from the increased concentration of the dye in the desorption solution. The percentage of the dye desorbed from the adsorbent was calculated using eqn (12):
2) in the flasks and shaken at 30 °C for 2 h. The amount of dye desorbed (mg) was calculated from the increased concentration of the dye in the desorption solution. The percentage of the dye desorbed from the adsorbent was calculated using eqn (12):| | |
Desorption percentage = (mass of dye desorbed/mass of dye adsorbed) × 100%
| (15) |
3. Results and discussion
3.1 Characterization
3.1.1 Amino acid analysis. Table 3 lists the amino acid analysis reports of CF-HBPN-I and CF-HBPN-II. The changes that occurred in the content of a certain amino acid in the amino acid analysis results can be used as evidence that the amino acid residues were involved in some chemical reactions. The histidine content of CF-HBPN-II was higher than that of CF-HBPN-I, indicating that the amino acid content of the CF-HBPN-II surface increased significantly after HBPN modification.
Table 3 Amino acid analysis results of modified collagen fibers
| Amino acid |
Content (g kg−1) |
| CF-HBPN-I |
CF-HBPN-II |
| Aspartic acid (Asp) |
33.8107 |
30.9997 |
| Threonine (Thr) |
14.3902 |
13.1189 |
| Serine (Ser) |
20.7003 |
18.7335 |
| Glutamic acid (Glu) |
69.4644 |
63.4828 |
| Glycine (Gly) |
135.4738 |
123.4121 |
| Alanine (Ala) |
62.1782 |
60.4311 |
| Cystine (Cys) |
0.0000 |
0.0000 |
| Valine (Val) |
18.8539 |
18.9530 |
| Methionine (Met) |
9.7139 |
7.8193 |
| Isoleucine (Ile) |
8.8376 |
7.3668 |
| Leucine (Leu) |
21.5120 |
14.8003 |
| Tyrosine (Tyr) |
16.4507 |
24.1882 |
| Phenylalanine (Phe) |
15.5871 |
16.5721 |
| Lysine (Lys) |
16.2593 |
14.7863 |
| Histidine (His) |
9.2587 |
9.8336 |
| Arginine (Arg) |
49.8530 |
44.6995 |
| Proline (Pro) |
81.5867 |
72.6448 |
3.1.2 Organic element analysis. The results of element analysis are shown in Table 4. After HBPN modification, the N element content of CF-HBPN-I and CF-HBPN-II was significantly higher than that of CF, indicating that HBPN was introduced into the surface of the collagen fiber after crosslinking with glutaraldehyde, thereby increasing the N element content of the collagen fiber.
Table 4 Elemental analysis results of the modified collagen fiber
| Sample |
N (%) |
C (%) |
H (%) |
| CF |
8.867 |
46.77 |
7.192 |
| HBPN |
18.86 |
52.10 |
9.012 |
| CF-HBPN-I |
10.25 |
47.33 |
7.289 |
| CF-HBPN-II |
9.703 |
47.20 |
7.411 |
3.1.3 SEM. Fig. 2 shows the SEM analysis results of CF-HBPN-I and CF-HBPN-II. As can be seen from Fig. 2, the surface of CF-HBPN-II is rough and the porosity is large. Compared with CF-HBPN-I, the fiber dispersion of CF-HBPN-II is improved and the pore structure is enhanced.
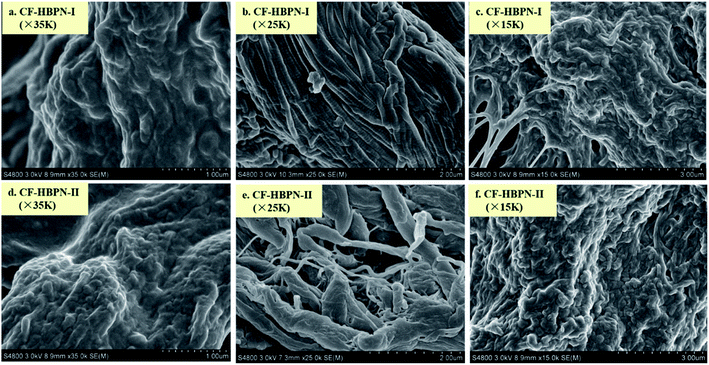 |
| | Fig. 2 SEM pictures of CF-HBPN and CF-HBPN-II. | |
3.1.4 BET. The BET surface area of CF-HBPN-I and CF-HBPN-II was obtained by the nitrogen adsorption method at 78 K using a surface area and porosity analyzer. The BET surface area results are shown in Table 5. According to the results, CF-HBPN-II possesses a larger specific surface area as well as saturated adsorption capacity of the single layer. The results are consistent with the SEM pictures of CF-HBPN-I and CF-HBPN-II. The branching and microporous structures of second generation of hyperbranched polymer-modified collagen fibers were strengthened. The grafting of the hyperbranched polymer onto CF-HBPN-I enlarged the interval of the collagen fiber. Therefore, the BET surface area of CF-HBPN-II is larger than that of CF-HBPN-I.
Table 5 BET surface area of CF-HBPN-I and CF-HBPN-II
| Sample |
BET surface area/(m2 g−1) |
Saturated adsorption capacity of single layer/(cm3 g−1 STP) |
| CF-HBPN-I |
0.587 |
0.135 |
| CF-HBPN-II |
0.687 |
0.158 |
(1) Nitrogen adsorption properties of modified collagen fibers. The N2 adsorption isotherms of CF-HBPN-I and CF-HBPN-II are shown in Fig. 3. According to Fig. 3, with the increase in pressure, the adsorption capacity became larger. At a relative pressure (p/p°) < 0.9, the increase degree is small. When the relative pressure is in the range of 0.9–1, the increase degree is high. The transition occurred for the adsorption capacity of N2.
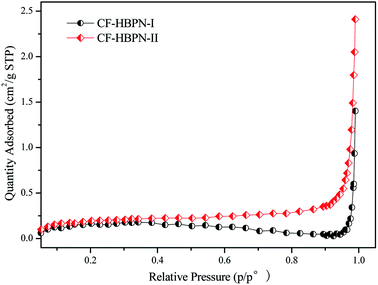 |
| | Fig. 3 N2 adsorption isotherms of CF-HBPN-I and CF-HBPN-II. | |
Table 6 presents the BJH cumulative pore volume (N2 adsorption) and the average pore size determination results. As can be seen from Table 6, the mesopore volume of CF-HBPN-II is bigger than that of CF-HBPN-I. N2 was adsorbed into the micropore by filling the pore. The mesopore and macropore acted as the channel of molecular motion. With the increase in the pressure, the micropore was covered with N2. The increase in adsorption capacity at this time is mainly due to the increase in N2 in the mesopore and macropore.
Table 6 BJH cumulative pore area constants of the collagen fiber material
| Sample |
Cumulative BJH pore volume adsorption (cm3 g−1) |
| Micropore < 2 nm |
Mesoporous (2–50 nm) |
Macropore > 50 nm |
Sum |
BJH average pore size (nm) |
| CF-HBPN-I |
0.022 |
0.022 |
0.085 |
0.129 |
138.400 |
| CF-HBPN-II |
0.014 |
0.065 |
0.029 |
0.108 |
65.010 |
3.1.5 Particle size determination. The determination results are shown in Fig. 4. According to Fig. 4, the particle sizes of CF-HBPN-I and CF-HBPN-II were 250.6 nm and 280.6 nm, respectively. This might be attributed to the structure of the modified collagen fiber. After modification, CF-HBPN-II had more terminal amino groups and a larger side branching chain than CF-HBPN-I. Its fibrous structure became looser. The reticulate structure was strengthened, and the particle size was increased.
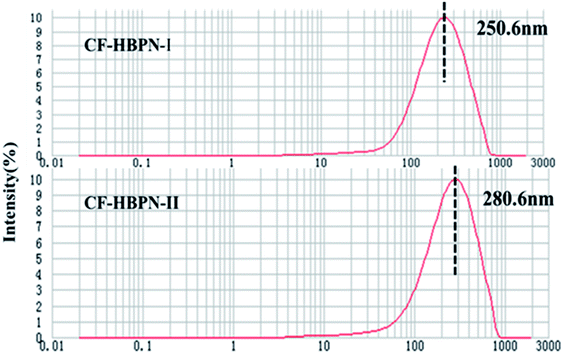 |
| | Fig. 4 Determination of particle size distribution of CF-HBPN-I and CF-HBPN-II. | |
3.2 Enhanced adsorption performance towards acid dyes
Fig. 5 displays the five kinds of dyes adsorbed on CF-HBPN-I and CF-HBPN-II. CF-HBPN-II showed a higher adsorption capacity than that of CF-HBPN-I. The adsorption capacity of CF-HBPN-II was determined to be 224.87, 340.14, 287.36, 317.80, and 251.25 mg g−1 for Isolan Black 2S-LD, Supralan Yellow, Isolan Grey K-PBL 02, Isolan Dark Blue 2S-GL 03, and Isolan Brown NHF-S, respectively, while the data of CF-HBPN-I were 116.65, 252.05, 233.84, 229.49, and 188.11 mg g−1. For Supralan Yellow and Isolan Dark Blue 2S-GL 03, the dye adsorption capacities of CF-HBPN-I and CF-HBPN-II were larger than those of Isolan Black 2S-LD, Isolan Grey K-PBL 02, and Isolan Brown NHF-S.
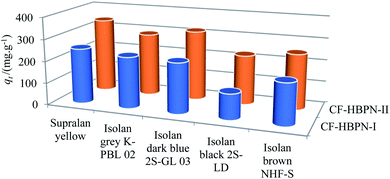 |
| | Fig. 5 Enhanced adsorption performance of CF-HBPN-II towards acid dyes compared with CF-HBPN-I. | |
The determination of surface functional groups is important to verify whether the surface property can promote the adsorption of anionic dyes. The amino contents of CF and CF-HBPN were determined by the salicylic aldehyde method. It was observed that the amino acid contents (mass percentage) of CF, CF-HBPN-I, and CF-HBPN-II were 5.33%, 8.8%, and 12.48%, respectively. The existence of amino groups enables the adsorbent with higher adsorption efficiency due to the electrostatic attraction. After modification, the amino content of CF-HBPN-II increased by 41.8% when compared with CF-HBPN-I. The adsorption capacities of CF-HBPN-II toward Isolan Black 2S-LD, Supralan Yellow, Isolan Grey K-PBL 02, Isolan Dark Blue 2S-GL 03 and Isolan Brown NHF-S were increased by 34.89%, 21.22%, 35.03%, 42.93%, and 25.04% compared with CF-HBPN-I. The result indicated that the adsorption process might be dominated by the chemical adsorption (electrostatic attraction) rather than physical adsorption.
3.3 Single-factor optimization of Isolan Black 2S-LD adsorption by CF-HBPN-II
Various preliminary experiments were conducted to evaluate the effects of adsorbent dosages, initial pH of the solution and temperature on the adsorption efficiency of CF-HBPN-II.
3.3.1 Effect of pH. The pH of the dye solution plays an important role in the adsorption process, which influences the surface electrical properties of the adsorbent as well as the ionization degree of the dye molecule.27 The pH of the leather making industry wastewater varies and mainly depends on the chemical reagent and craft involved in the process. For example, in the leather making process, the pH is 12.5–13 for liming wastewater, 2–2.8 for pickling wastewater, and 3.8–4.0 for tanning wastewater. At the same time, at the last stage of the dyeing process using acid dyes, formic acid has to be added to fix the dyes onto the collagen fiber. The pH was adjusted to about 2.7 to help the interaction between the acid dye and the collagen fiber.In this study, the influence of the pH (1.5 to 5.5) on the adsorption capacity as well as the removal efficiency of CF-HBPN-II was investigated according to the leather dyeing process. The result is shown in Fig. 6. The pH of the solution influences the protonation degree of the adsorbent, thereby determining the specific charge of the binding sites and the adsorption performance of the adsorbent.28 The CF-HBPN-II contains amino (pKa) groups. When the pH was lesser than pKa, the cationic form was dominated. It is due to the protonation process of amino groups. When the pH increases from 2.0 to 2.5, the adsorption capacity increased fast, which means the increase in protonation of amino groups, allowing them to interact more effectively with the ionized sulfonic groups of the dye.29 When the pH was larger than pKa, the protonation degree of amino groups decreased, and the adsorption capacity decreased. Subsequent assays were conducted at pH = 3.0.
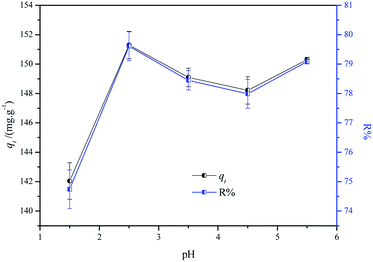 |
| | Fig. 6 Effect of pH on the adsorption process (experimental conditions: adsorbent dosage, 1.6 g L−1; initial concentration, 300 mg L−1; temperature, 30 °C; contact time, 2 h; pH = 1.5, 2.5, 3.5, 4.5, and 5.5). | |
3.3.2 Effect of adsorbent dosage. Fig. 7 displays the effect of CF-HBPN-II dosage (0.05–0.2 g) on the Isolan Black 2S-LD adsorption capacity at a fixed initial concentration (300 mg L−1). As expected, an increase in adsorbent dosage leads to an increase in removal efficiency. Initially, a rapid enhancement (57.93% to 85.14%) of dye removal efficiency can be observed with the increase in adsorbent dosage from 1 g L−1 to 1.6 g L−1. When the adsorbent dosage increased to 2.8 g L−1, the removal efficiency of acid dye reached to 99.26%. For a fixed initial solution concentration, the increase in adsorbent dose provided a larger adsorption surface area and adequate active adsorption sites, and thus greatly enhanced the removal rate.30 However, the increase in dosage (beyond 2.8 g L−1) resulted in a decrease in adsorption capacity, specifically, 176.18 mg g−1 (adsorbent dosage 1 g L−1) to 75.60 mg.g−1 (adsorbent dosage 4 g L−1), indicating that the amount of 2.8 g L−1 is the optimum adsorbent dose (adsorption capacity 107.80 mg g−1, dye removal efficiency 99.25%) when the initial concentration of the dye molecule is 300 mg L−1. The decrease in adsorption capacity might be attributed to the decrease in effective collision between the adsorbent and the adsorbate. When the adsorbent dose increased to a predetermined one, the adsorption reached equilibrium, and further increasing the adsorbent dose will result in a “vacant” phenomenon. As a result, the adsorption mass per gram adsorbent decreased. The process of dye molecule transfer from the solution to the solid would be difficult due to the increasing mass transfer power.
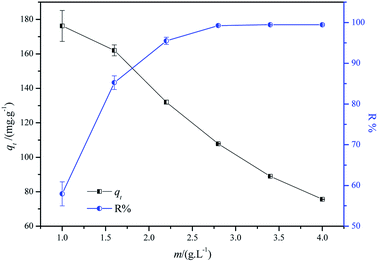 |
| | Fig. 7 Effect of adsorbent dosage on the adsorption process (experimental conditions: adsorbent dosage = 1, 1.6, 2.2, 2.8, 3.4, and 4 g L−1, initial concentration = 300 mg L−1, temperature = 30 °C, contact time = 2 h, initial pH = 3.0, and volume of dye solution = 50 mL). | |
3.3.3 Effect of adsorption temperature. It is well known that the adsorption temperature plays an important role in the adsorption process. With the increase in temperature, the adsorption capacity and dye removal efficiency increased. When the reaction temperature was further increased, the adsorption capacity decreased. It was attributed to the interaction function of physical adsorption and chemical adsorption. The physical adsorption is the main adsorption mechanism at low temperatures. With the increase in temperature, the transition from physical adsorption to chemical adsorption occurred. With the increase in temperature, the intensity of molecular motions increased. The frequent contact between the adsorbent and the adsorbate increased the adsorption efficiency.31,32 The proper reaction temperature increment accelerated the intraparticle diffusion and mass transfer speed. Fig. 8 shows the effect of different temperatures on dye adsorption. As a result, the values of adsorption capacity and removal efficiency of the dye increased with the increase in temperature. It can be calculated that the adsorption capacity increased from 208.16 mg g−1 to 385.75 mg g−1 when the reaction temperature increased from 20 °C to 50 °C. Further increasing the reaction temperature led to a quick decline in the adsorption capacity (385.75 mg g−1 to 264.18 mg g−1). Moreover, when the temperature further increased, the dye molecule could escape from the solid phase, resulting in a decrease in removal efficiency.33
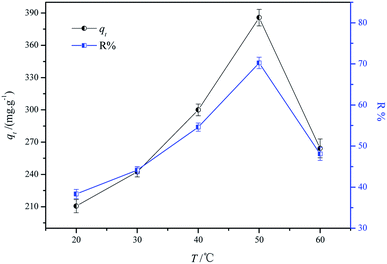 |
| | Fig. 8 Effect of reaction temperature on the adsorption process (experimental conditions: adsorbent dosage = 2 g L−1, initial concentration = 1000 mg L−1, temperature = 20, 30, 40, 50, and 60 °C, contact time = 2 h, and initial pH 3.0). | |
3.4 Kinetics studies
The investigation of adsorption kinetics is meaningful to distinguish the rapid and slow adsorption processes.34 In this study, the effect of reaction temperature on the adsorption process was investigated. In addition, the dye removal rate versus contact time is plotted in Fig. 9.
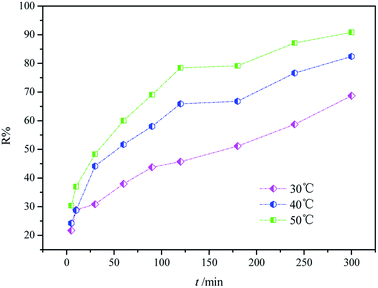 |
| | Fig. 9 Kinetic study of dye adsorption on CF-HBPN-II at 30 °C, 40 °C, and 50 °C. | |
It was found that approximately 80% of the dye molecule was removed from the aqueous solution by CF-HBPN-II at 40 °C in 5 h with an initial concentration of 300 mg L−1. Extending the contact time resulted in a small variation in the removal rate, indicating that adsorption equilibrium was reached. Therefore, a minimum contact time of 6 h was applied in the following tests. What is more, the removal efficiency in which equilibrium is reached increased with the increase in reaction temperature. The removal efficiency of the dye molecule increased rapidly at the beginning of the process when the reaction temperature increased to 50 °C, indicating that a higher adsorption rate of CF-HBPN-II was reached at a higher temperature.
In order to investigate the mechanism and characteristics of the adsorption process, the adsorption kinetics of Isolan Black 2S-LD on CF-HBPN-II was fitted by pseudo-first-order (eqn (5)), pseudo-second order (eqn (6)) and intra-particle diffusion kinetics models (eqn (7)). The results are shown in Fig. 10(a)–(c). Table 7 displays various model parameters, including rate constant, equilibrium adsorption capacity (qe), and correlation coefficient (R2).
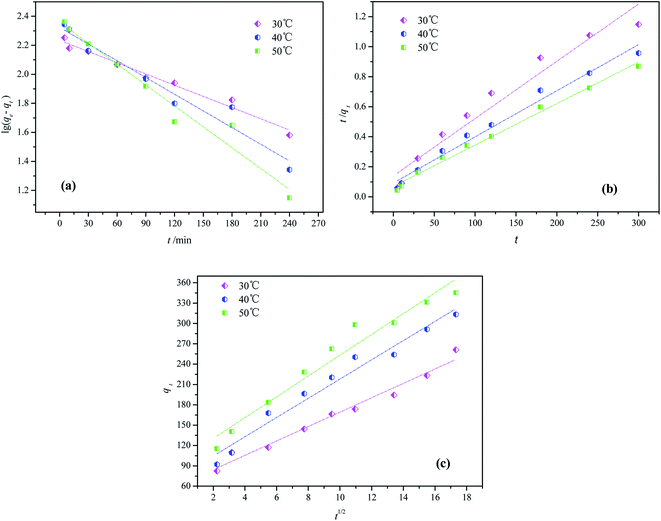 |
| | Fig. 10 Linear plot of the pseudo-first-order kinetic model (a), the pseudo-second-order kinetic model (b) and intraparticle diffusion kinetic model (c). | |
Table 7 Kinetic parameters evaluated for acid dye adsorption for CF-HBPN-II at 30 °C at initial pH 5.5
| Kinetic models |
Parameters |
T/°C |
| 30 |
40 |
50 |
| Pseudo-first order |
qe,exp/(mg g−1) |
260.75 |
287.17 |
389.58 |
| qe1,cal/(mg g−1) |
171.62 |
210.90 |
228.24 |
| k1 |
0.00594 |
0.00884 |
0.0111 |
| R2 |
0.976 |
0.950 |
0.961 |
| Pseudo-second order |
qe2,cal/(mg g−1) |
261.78 |
325.73 |
362.32 |
| k2 |
0.000105 |
0.000103 |
0.00011 |
| R2 |
0.949 |
0.981 |
0.990 |
| Intraparticle diffusion |
kid |
10.62 |
14.18 |
15.34 |
| R2 |
0.974 |
0.966 |
0.955 |
Apparently, the linear regression correlation coefficient reached 0.99 (50 °C) for the pseudo-second-order kinetic model. Moreover, the calculated equilibrium adsorption capacities (qe2,cal) of the pseudo-second-order kinetic order were much closer to the experimental values (qe,exp). The pseudo-second-order was based in the chemisorption assumption, i.e., the establishment of a chemical reaction between the adsorbent and the adsorbate.35
At the beginning of the adsorption process, the R% increases very fast. This is because the adsorbent dispersion degree was high, which exposed a large external specific surface area of the adsorbent.36 The rate constant (k2) decreased as the temperature increased from 30 °C to 50 °C, indicating that the adsorption is dependent on the temperature. Thus, it is reasonable to conclude that the Isolan Black 2S-LD adsorption on CF-HBPN-II followed the pseudo-second-order kinetics.37
The R2 value for the intraparticle diffusion model was calculated to be 0.974, 0.966 and 0.955 when the temperatures were 30 °C, 40 °C and 50 °C. The intraparticle diffusion model from the experiments indicated that the adsorption process can be divided into three linear stages. The dyes slightly moved to the surface and crossed it to move into the pores of the adsorbent. Then, it would penetrate into the micropores of CF-HBPN-II and connect with the active adsorption sites. At last, the adsorption equilibrium was reached.
3.5 Adsorption isotherms
CF-HBPN-II possesses high density of functional amino-terminated groups, which can be released as the adsorption sites. The equilibrium adsorption curves under different initial concentrations can be obtained by measuring the adsorption isotherm.
Fig. 11 displays the isotherm between the adsorption capacity and the dye concentration at equilibrium (qe vs. Ce). The shape of the isothermal curve looks like “L” (I type isotherm), indicating that the adsorption process corresponds to the Langmuir monolayer reversible adsorption process and it was called “favorable adsorption isotherm”.38,39 Moreover, the adsorption capacities increased sharply when the equilibrium dye concentration increased to 100 mg L−1, indicating that the adsorption equilibrium was reached in a very short time. In addition, the interaction force between the adsorbent and the adsorbate was strong under acidic conditions. Besides, the saturated adsorption capacities (qe,exp) of CF-HBPN-II are as follows: 260.75 mg g−1 (30 °C), 287.17 mg g−1 (40 °C), and 389.57 mg g−1 (50 °C). The equilibrium adsorption capacity increased with the increase in reaction temperature, indicating the adsorption process might be an endothermic reaction.
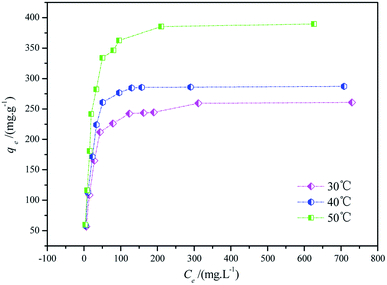 |
| | Fig. 11 Adsorption isotherms for Isolan Black 2S-LD at an initial dye concentration between 50 mg L−1 and 1000 mg L−1, an adsorption dosage of 0.5 g L−1, and temperatures of 30 °C, 40 °C, and 50 °C. | |
The Langmuir (eqn (8)), Freundlich (eqn (9)) and Temkin (eqn (10)) isotherm adsorption models were used to further elucidate the adsorption mechanism of CF-HBPN-II. The fitting result of Langmuir models is shown in Fig. 12. Necessarily, the analysis of dye adsorbed at equilibrium and the adsorption parameters calculated through the linearization of the Langmuir, Freundlich and Temkin models (Table 8) are crucial. It can be observed that the Langmuir model is much more suitable to describe the adsorption process rather than the Freundlich and Temkin models, as reflected by the correlation coefficient (R2). The Langmuir isotherm model supposes that the active adsorption sites are uniformly distributed on the surface of adsorbents with the same adsorption energy. Moreover, the adsorption process is positioning adsorption, which means that the relationship between the adsorption site and the adsorbate is “one-to-one model”. As a result, the maximum adsorption capacity (qeL,cal) calculated from the Langmuir equation is the amount of monolayer dye molecule covered on the surface of CF-HBPN-II. In addition, the qeL,cal values of 290.70 mg g−1(30 °C), 335.57 mg g−1 (40 °C), and 458.72 mg g−1(50 °C) were closer to the maximum adsorption amount measured in the experiments [qe,exp = 260.75 mg g−1 (30 °C), 287.17 mg g−1 (40 °C), and 389.57 mg g−1(50 °C)].
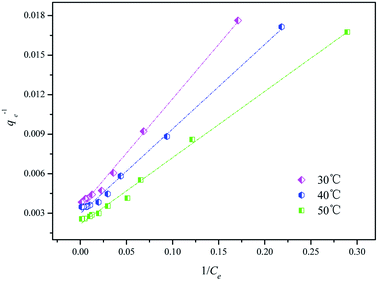 |
| | Fig. 12 Langmuir isotherms for Isolan Black 2S-LD at an initial dye concentration between 50 mg L−1 and 1000 mg L−1, an adsorption dosage of 0.5 g L−1, and temperatures of 30 °C, 40 °C, and 50 °C. | |
Table 8 Isotherm parameters evaluated for acid dye adsorption of CF-HBPN-II at 30 °C at initial pH 5.5
| Isotherm models |
Parameters |
T/°C |
| 30 |
40 |
50 |
| Langmuir isotherm |
qe,exp/(mg g−1) |
260.75 |
287.17 |
389.58 |
| qeL,cal/(mg g−1) |
290.70 |
335.57 |
458.72 |
| b/(L mg−1) |
0.0417 |
0.0464 |
0.0433 |
| R2 |
0.995 |
0.995 |
0.996 |
| Freundlich isotherm |
kF |
50.43 |
58.64 |
63.60 |
| 1/n |
0.299 |
0.302 |
0.353 |
| R2 |
0.760 |
0.726 |
0.753 |
| Temkin isotherm |
A |
1.21 |
1.55 |
1.09 |
| B |
44.56 |
49.31 |
70.96 |
| R2 |
0.862 |
0.813 |
0.869 |
RL of the dye adsorption process onto CF-HBPN-II was calculated at 30 °C. When RL = 0 or RL > 1, the adsorption is an unfavorable type.40 When RL = 1, the adsorption occurs easily. When 0 < RL < 1, the adsorption is favorable. The calculated RL value of different initial concentrations (50–1000 mg L−1) was in the range of 0.0234–0.324, indicating that adsorption is favorable.
3.6 Thermodynamics parameters
The thermodynamic parameters are given in Table 9. The adsorption enthalpy increment ΔH appeared positive, which meant the adsorption process was an endothermic process. The adsorption efficiency was enhanced with the increase in temperature. The result was consistent with the analysis of adsorption kinetics. The adsorption free energy ΔG was negative, which means that adsorption was a spontaneous process.41 The spontaneous degree of the system increased with the increase in temperature. The adsorption entropy was positive. The above-mentioned results indicated that the adsorption process was a confusion increased process. What is more, the adsorption process was mainly dominated by entropy change rather than the enthalpy change (|TΔS| > |ΔH|).
Table 9 Thermodynamic parameters
| T/K |
ΔG/(kJ mol−1) |
ΔH/(kJ mol−1) |
ΔS/[kJ (mol K)−1] |
TΔS |
| 303 |
−6.29 |
20.08 |
0.0870 |
26.36 |
| 313 |
−7.15 |
27.23 |
| 323 |
−8.03 |
28.10 |
3.7 Regeneration study
In order to evaluate the regeneration ability of adsorbents,42 the desorption experiments were carried out by mixing consumed CF-HBPN-I and CF-HBPN-II with deionized water or 0.1 M NaOH to estimate how many dye molecules could be desorbed from the occupied adsorbents. Table 10 presents the desorption percentage of dye molecules by different desorption agents. It was found that the desorption rate of deionized water was quite small, and only few adsorbates (around 1%) were desorbed. Hence, the interaction force between CF-HBPN and acid dye was strong enough to resist the water scrubbing. It was also noted that approximately 20% of adsorbed dye molecules (Isolan series) were desorbed by 0.1 M NaOH solution. As a result, the adsorption of acid dyes (Isolan series) onto CF-HBPN-I and CF-HBPN-II was extremely feasible. What is more, a large amount of Supralan Yellow dye molecules, in particular, 54.98% of exhausted CF-HBPN-I and 74.44% of occupied CF-HBPN-II, were desorbed by a 0.1 M NaOH solution, indicating that the adsorption of Supralan Yellow was reversible. More alkaline conditions and other kinds of regeneration methods will be attempted in the future study.
Table 10 Desorption rates of different exhausted adsorbents
| Adsorbent |
Dye |
Desorption rate (%) |
| H2O |
0.1 M NaOH |
| CF-HBPN-I |
Isolan Black 2S-LD |
0.94 |
13.33 |
| Isolan Dark Blue 2S-GL 03 |
0.81 |
25.70 |
| Supralan Yellow |
0.78 |
54.98 |
| Isolan Grey K-PBL 02 |
0.13 |
7.32 |
| Isolan Brown NHF-S |
0.70 |
13.96 |
| CF-HBPN-II |
Isolan Black 2S-LD |
1.39 |
23.35 |
| Isolan Dark Blue 2S-GL 03 |
0.34 |
33.62 |
| Supralan Yellow |
1.16 |
74.44 |
| Isolan Grey K-PBL 02 |
0.19 |
6.89 |
| Isolan Brown NHF-S |
2.70 |
17.65 |
A comparison of the present equilibrium adsorption capacity with the published results is important to assess the adsorption capabilities of CF-HBPN-I and CF-HBPN-II. However, since the exact same dye was not found, some similar acid dye adsorption results are presented in Table 11. From Table 11, it was found that the dye adsorption capacity of CF-HBPN-II was higher than that of most of the reported adsorbents.
Table 11 Adsorption capacities of various adsorbents used for acid dye removal
| Adsorbents |
Adsorbate |
Adsorption capacity (mg g−1) |
Ref. |
| ACF |
Acid black NT |
210.97 |
15 |
| LDO-CF |
Anionic dye |
373.07 |
43 |
| MWCNT |
Acid red 183 |
45.30 |
44 |
| PANI-coated magnetic CoFe2O4 particles |
Acid Red 18 |
172.41 |
45 |
| Activated carbon derived from pistachio shells |
Acid red-14 |
516.00 |
46 |
| Oil palm wastes-derived activated carbons |
Acid orange 10 |
18.76 |
47 |
| Moringa oleifera seed husk |
Acid Blue 9 |
329.50 |
48 |
| APC |
Acid orange II |
599.66 |
49 |
| PANI-KpF nanocomposites |
Methyl orange |
136.75 |
50 |
| CDC1.5 |
AB113 |
220.0 |
51 |
| RB5 |
294.7 |
| CF-HBPN-I |
Isolan Black 2S-LD |
116.65 |
Present study |
| CF-HBPN-II |
Isolan Black 2S-LD |
224.87 |
Present study |
| CF-HBPN-II |
Supralan Yellow |
340.14 |
Present study |
| CF-HBPN-II |
Isolan Grey K-PBL 02 |
287.36 |
Present study |
| CF-HBPN-II |
Isolan Dark Blue 2S-GL 03 |
317.80 |
Present study |
| CF-HBPN-II |
Isolan Brown NHF-S |
251.25 |
Present study |
3.8 Discussion on adsorption mechanism
The mechanism of the adsorption process of CF-HBPN-II to acid dye is similar to the dying process of leather manufacture.52 In the leather making process, collagen fibers are positively charged in an acid bath because the pH of the processing solution is smaller than the isoelectric point of collagen. The positive charge in the collagen fiber would connect with the acid dye, which shows a negative charge by an electrovalent bond.
In this research, the acid dye was first dissolved and then converted into anionic dye ions (eqn (16)) in an aqueous solution.53 Furthermore, in the presence of H+ under acidic conditions, the amino groups of CF-HBPN-II became protonated (eqn (17)), and then protonated CF-HBPN-II offers an attractive positive site to the anionic colored component (eqn (18)). Finally, the adsorption process was complete.
| |
 | (16) |
| |
 | (17) |
| |
 | (18) |
The preferable adsorption performance of CF-HBPN-II not only contributes to the large amount of exterior active amino-terminated polymers, but also results from the three-dimensional structure of the hyperbranched polymer and unique cavity existing in the interior of the collagen fiber. These properties enable CF-HBPN-II with good chemical and physical adsorption properties toward dye molecule. With the increase of active adsorption groups on the surface of CF-HBPN-II, specifically, amino groups, the adsorption efficiency of the adsorbent increased.
The FT-IR spectra of CF-HBPN-II before and after adsorption of dye are shown in Fig. 13. The N–H stretching vibration absorption of the amide A band appeared near 3435 cm−1, and the C–N stretching vibration absorption of the amide B band appeared near 2925 cm−1. The N–H bending vibration and –CH2 bending vibration absorption near 1564 cm−1 and 1558.43 cm−1 were attributed to the amide II band. Compared with the spectra of CF-HBPN-II, no obvious change appeared in the FT-IR spectra of consumed CF-HBPN-II. The adsorption process is mainly based on electrostatic bonding and hydrogen bonding, and no chemical bonding was involved, so the chemical structure of the adsorbent did not change significantly.
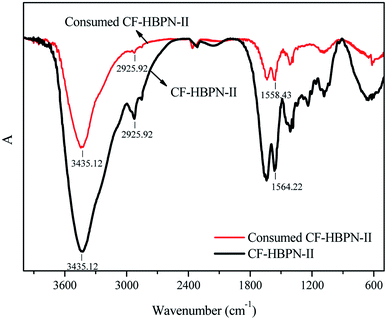 |
| | Fig. 13 FT-IR spectra of the adsorption material before and after dye adsorption. | |
4. Conclusions
In this research, amino-terminated hyperbranched polymers were used to modify collagen fibers to prepare different generations of hyperbranched polymer-modified collagen fibers. The hyperbranched polymer that has three-dimensional structure and multi-terminal active groups was grafted onto the collagen fiber adsorbent to improve its adsorption properties. Multiple-generations of collagen fiber-based adsorption materials were applied to the adsorption process of five different acid dyes. The experimental results indicated that the adsorption capacity of CF-HBPN-II to the acid dye was larger than that of CF-HBPN-I because of more terminal amino groups and branching structures. Furthermore, CF-HBPN-II and the widely used Isolan Black 2S-LD were chosen to evaluate the adsorption mechanism. The experimental results indicated that the adsorption process of CF-HBPN-II toward Isolan Black 2S-LD is in accordance with the pseudo-second-order model. The adsorption isotherm corresponds to the Langmuir adsorption isotherm model. This study provides a theoretical basis for the preparation of a new type of natural collagen fiber adsorbent, which is environmentally friendly and efficient. Moreover, the modification method of the collagen fiber provides a new way of enhancing the dye-uptake rate in the leather manufacturing process.
Conflicts of interest
There are no conflicts to declare.
Acknowledgements
This work was supported by the National Natural Science Foundation of China (Grant No. 22078165), College Student Innovation and Entrepreneurship Training Program of Shandong Province (Grant No. 29), Solid-state Fermentation Resource Utilization Key Laboratory of Sichuan Province (Grant No. 2018 GTJ012).
References
- Y. C. Wong, Y. S. Szeto, W. H. Cheung and G. McKay, Langmuir, 2003, 19, 7888–7894 CrossRef CAS.
- S. P. Jeferson, A. F. Liliana, C. Mírian and G. Mariliz, J. Chem. Eng. Data, 2013, 58(4), 873–882 CrossRef.
- D. Georgouvelas, H. N. Abdelhamid, J. Li, U. Edlund and A. P. Mathew, Carbohydr. Polym., 2021, 264(1), 118044 CrossRef CAS PubMed.
- C. Patra, E. Suganya, S. Sivaprakasam, G. Krishnamoorthy and S. Narayanasamy, Chemosphere, 2021, 281, 130706 CrossRef CAS PubMed.
- A. R. Shaikh, M. Chawla, A. A. Hassan, I. Abdulazeez, O. A. Salawu, M. N. Siddiqui, S. Pervez and L. Cavallo, J. Mol. Liq., 2021, 337, 116433 CrossRef CAS.
- S. Palanivel, A. Mani and P. Thayumanavan, J. Cleaner Prod., 2012, 22(1), 67–75 CrossRef.
- J. Kanagaraj, N. K. Chandra Babu and A. B. Mandal, J. Cleaner Prod., 2008, 16, 1807–1813 CrossRef CAS.
- J. J. Ma and D. H. Huang, Anim. Husb. Feed Sci., 2011, 33(3), 84–85 Search PubMed.
- P. J. Liu, Y. Song, S. J. Ma and X. L. Li, China Leather, 2020, 49(12), 46–54 Search PubMed.
- M. Garcia, J. L. Urrea, S. Collado, P. Oulego and M. Diaz, Waste Manag., 2017, 67, 278–287 CrossRef CAS PubMed.
- S. L. R. Marcilla and R. G. Donovay, J. Am. Leather Chem. Assoc., 1982, 77(6), 3 Search PubMed.
- K. Liu, Z. W. Ding and K. Y. Tang, China Leather, 2007, 36(19), 37–40 CAS.
- H. M. Cheng, R. Wang, Y. M. Wang, M. Chen, Z. Li, W. W. Duan, L. L. Liao and Z. Q. Li, J. Sichuan Univ., 2007, 39(3), 78–82 CAS.
- Y. C. Gu, X. P. Liao, Y. L. Wang and S. Bi, J. Basic Sci. Eng., 2008, 16(5), 647–658 Search PubMed.
- T. T. Qiang, M. Luo, Q. Q. Bu and X. C. Wang, Chem. Eng. J., 2012, 197, 343–349 CrossRef CAS.
- P. Liu and T. Wang, J. Hazard. Mater., 2007, 149(1), 75–79 CrossRef CAS PubMed.
- R. M. Crooks, M. Zhao, L. Sun, V. Chechik and L. K. Yeung, Acc. Chem. Res., 2001, 34(3), 181–190 CrossRef CAS PubMed.
- Ar. Michael and T. Dimitris, J. Hazard. Mater., 2009, 170(1), 35–42 CrossRef PubMed.
- F. T. Liu, Modern Silk Science & Technology, 2017, 32(2), 36–40 Search PubMed.
- R. Q. Chen, China Dyeing and Finishing, 2000, 5(4), 45–47 Search PubMed.
- S. Z. Cao, Silk Text. Technol. Overseas, 1988, 17, 37–41 Search PubMed.
- X. C. Wang, F. F. Zhang and T. T. Qiang, J. Funct. Mater., 2013, 44(4), 527–531 CAS.
- Z. X. Zhang and R. H. Zhang, 1990. Quantitative Analysis of Organic Functional Groups. Chemical industry press, Beijing, pp. 227–234 Search PubMed.
- Determination of amino acids in foods [S]. GB/T 5009.124-2003.
- G. Farhad, H. Mahnaz and S. Meysam, Microchem. J., 2018, 144, 64–72 Search PubMed.
- S. K. Milonjić, J. Serb. Chem. Soc., 2007, 72(12), 1363–1367 CrossRef.
- M. Sivakumar, S. Yadav, W. S. Hung and J. Y. Lai, J. Clean. Prod., 2020, 263, 121498 CrossRef CAS.
- J. Pérez-Calderón, A. Scian, M. Ducos, V. Santos and N. Zaritzky, Environ. Sci. Pollut. Res. Int., 2021, 28(47), 67032–67052 CrossRef PubMed.
- W. Y. Li, J. Liu, H. Chen, Y. Deng, B. Zhang, Z. Wang, X. Zhang and S. Hong, Chem. Eng. J., 2013, 225, 865–872 CrossRef CAS.
- B. Ivma, B. Vvt, B. Nvs, C. Gas and C. Vgk, J. Mol. Liq., 2021, 336, 116301 CrossRef.
- S. L. Zhao, F. S. Chen, X. D. Zhu, W. J. Liu, C. L. Wu, J. Zhang, S. B. Ren, Z. Z. Yan, W. L. Cao, Q. F. Zhang and X. N. Li, J. Hazard Mater., 2021, 413, 125299 CrossRef CAS PubMed.
- M. Arifin, S. Sudiono, M. Mudasir and T. Triyono, Key Eng. Mater., 2021, 884, 47–53 Search PubMed.
- K. Velusamy, et al., Environ. Pollut., 2021, 287, 117632 CrossRef CAS PubMed.
- M. A. Hubbe, S. Azizian and S. Douven, Bioresources, 2019, 14(3), 7582–7626 CrossRef.
- M. C. Silva, L. Spessato, T. L. Silva, G. K. P. Lopes, H. G. Zanella, J. T. C. Yokoyama, A. L. Cazetta and V. C. Almeida, J. Mol. Liq., 2021, 324, 114771 CrossRef CAS.
- F. Granados-Correa, J. Vilchis-Granados, M. Jiménez-Reyes, L. A. Quiroz-Granados and P. Valentao, J. Chem., 2012, 2013, 751696 Search PubMed.
- Y. S. Ho, J. Hazard. Mater., 2006, 136(3), 681–689 CrossRef CAS PubMed.
- Q. Z. Wang, Y. J. Zhao, Z. Shi, X. Y. Sun, T. Bu, C. Q. Zhang, Z. X. Mao, X. H. Li and L. Wang, Chem. Eng. J., 2021, 420, 129955 CrossRef CAS.
- P. Z. Zhou, J. Cheng, Y. Y. Yan, S. P. Xu and C. L. Zhou, Sep. Purif. Technol., 2021, 272, 118871 CrossRef CAS.
- A. Y. Shen, X. R. Liao and Y. Q. Li, Colloids Surf., A, 2021, 623, 126666 CrossRef CAS.
- J. G. Wang, W. Wang, Z. Ai, M. Li, H. L. Li, W. J. Peng, Y. L. Zhao and S. X. Song, Appl. Clay Sci., 2021, 210, 106153 CrossRef CAS.
- F. Xiao, Y. X. Cheng, P. C. Zhou, S. X. Chen, X. J. Wang, P. He, X. Q. Nie and F. Q. Dong, J. Environ. Chem. Eng., 2021, 9(4), 105681 CrossRef CAS.
- N. Yang, J. Z. Ma, J. B. Shi, X. Y. Yang and J. Lu, J. Colloid Interface Sci., 2022, 610, 182–193 CrossRef CAS PubMed.
- S. B. Wang, W. N. Choon, W. T. Wang, Q. Li and L. Q. Li, J. Chem. Eng. Data, 2012, 57(5), 1563–1569 CrossRef CAS.
- H. Mohammadi, M. Ghaed, M. Fazeli and M. M. Sabzehmeidani, Microporous Mesoporous Mater., 2021, 324, 111275 CrossRef CAS.
- F. Barjasteh-Askari, et al., Heliyon, 2021, 7(6), e07191 CrossRef PubMed.
- L. Baloo, M. H. Isa, N. B. Sapari, A. H. Jagaba, L. J. Wei, S. Yavari, R. Razali and R. Vasu, Alexandria Eng. J., 2021, 60(6), 5611–5629 CrossRef.
- O. dos Santos Escobar, C. F. de Azevedo, A. Swarowsky, M. A. Adebayo, N. M. Schadeck and M. F. Machado, J. Environ. Chem. Eng., 2021, 9(4), 105553 CrossRef CAS.
- Z. Y. Huang, P. Wu, Y. K. Yin, X. Zhou, L. Fu, L. X. Wang, S. H. Chen and X. Tang, React. Funct. Polym., 2022, 172, 105155 CrossRef CAS.
- R. B. Gapusan and M. D. L. Balela, Mater. Chem. Phys., 2020, 243, 122682 CrossRef CAS.
- Q. M. Kong, X. J. Wang, X. L. Zhao and T. Lou, J. Clean. Prod., 2022, 331, 130017 CrossRef CAS.
- Bayer, Asian Int. Conf. Leather Sci. Technol., 6th, 1981, In West Germany, vol. 6, pp. 30–35 Search PubMed.
- M. Valix, W. H. Cheung and G. McKay, Langmuir, 2006, 22(10), 4574–4582 CrossRef CAS PubMed.
|
| This journal is © The Royal Society of Chemistry 2022 |
Click here to see how this site uses Cookies. View our privacy policy here.  Open Access Article
 ab,
Jie Liu*ab,
Yuwei Wuab,
Liqiang Jinab,
Yulu Wangab and
Zhou Xu
 c
c
![[thin space (1/6-em)]](https://www.rsc.org/images/entities/char_2009.gif) :
:![[thin space (1/6-em)]](https://www.rsc.org/images/entities/char_2009.gif) 2 metal complex disulfonated dyes.19–21
2 metal complex disulfonated dyes.19–21
![[thin space (1/6-em)]](https://www.rsc.org/images/entities/char_2009.gif) :
:![[thin space (1/6-em)]](https://www.rsc.org/images/entities/char_2009.gif) 2-metal complex dyes, disulfonated
2-metal complex dyes, disulfonated
![[thin space (1/6-em)]](https://www.rsc.org/images/entities/char_2009.gif) :
:![[thin space (1/6-em)]](https://www.rsc.org/images/entities/char_2009.gif) 100 and time = 2 h. Isolan Black 2S-LD was chosen as the target dye in the following experiments, because it is the most commonly used commercial dye in the leather industry. Adsorption experiments of Isolan Black 2S-LD on CF-HBPN-II were further carried out to evaluate the influence of adsorbent dosages (0.05–0.2 g), initial pH of the solution (1.5–5.5) and adsorption temperature (20–60 °C). The experiments were performed when one of the parameters was changed according to the setting trend and the others were fixed. The absorbance of the dye solution before and after adsorption was measured using a 722N visible spectrophotometer (Shanghai Sincere Dedication of Science and Technology Innovation). The average adsorption capacity from two parallel adsorbent samples was taken for each type of adsorbent.
100 and time = 2 h. Isolan Black 2S-LD was chosen as the target dye in the following experiments, because it is the most commonly used commercial dye in the leather industry. Adsorption experiments of Isolan Black 2S-LD on CF-HBPN-II were further carried out to evaluate the influence of adsorbent dosages (0.05–0.2 g), initial pH of the solution (1.5–5.5) and adsorption temperature (20–60 °C). The experiments were performed when one of the parameters was changed according to the setting trend and the others were fixed. The absorbance of the dye solution before and after adsorption was measured using a 722N visible spectrophotometer (Shanghai Sincere Dedication of Science and Technology Innovation). The average adsorption capacity from two parallel adsorbent samples was taken for each type of adsorbent.
![[thin space (1/6-em)]](https://www.rsc.org/images/entities/char_2009.gif) qe − k1t/2.303
qe − k1t/2.303![[thin space (1/6-em)]](https://www.rsc.org/images/entities/char_2009.gif) qe = ln
qe = ln![[thin space (1/6-em)]](https://www.rsc.org/images/entities/char_2009.gif) kF + ln
kF + ln![[thin space (1/6-em)]](https://www.rsc.org/images/entities/char_2009.gif) Ce/n
Ce/n![[thin space (1/6-em)]](https://www.rsc.org/images/entities/char_2009.gif) qe versus ln
qe versus ln![[thin space (1/6-em)]](https://www.rsc.org/images/entities/char_2009.gif) Ce
Ce![[thin space (1/6-em)]](https://www.rsc.org/images/entities/char_2009.gif) ln
ln![[thin space (1/6-em)]](https://www.rsc.org/images/entities/char_2009.gif) A + B
A + B![[thin space (1/6-em)]](https://www.rsc.org/images/entities/char_2009.gif) ln
ln![[thin space (1/6-em)]](https://www.rsc.org/images/entities/char_2009.gif) Ce
Ce![[thin space (1/6-em)]](https://www.rsc.org/images/entities/char_2009.gif) Ce
Ce![[thin space (1/6-em)]](https://www.rsc.org/images/entities/char_2009.gif) ka vs. 1/T. The angular coefficient is equal to ΔH/R and a linear coefficient is equal to ΔS/R. The entropy can be calculated using Gibbs–Helmholtz's eqn (14):
ka vs. 1/T. The angular coefficient is equal to ΔH/R and a linear coefficient is equal to ΔS/R. The entropy can be calculated using Gibbs–Helmholtz's eqn (14):![[thin space (1/6-em)]](https://www.rsc.org/images/entities/char_2009.gif) ln
ln![[thin space (1/6-em)]](https://www.rsc.org/images/entities/char_2009.gif) ka
ka
![[thin space (1/6-em)]](https://www.rsc.org/images/entities/char_2009.gif) ka = −ΔH/RT + ΔS/R
ka = −ΔH/RT + ΔS/R
![[thin space (1/6-em)]](https://www.rsc.org/images/entities/char_2009.gif) :
:![[thin space (1/6-em)]](https://www.rsc.org/images/entities/char_2009.gif) 2) in the flasks and shaken at 30 °C for 2 h. The amount of dye desorbed (mg) was calculated from the increased concentration of the dye in the desorption solution. The percentage of the dye desorbed from the adsorbent was calculated using eqn (12):
2) in the flasks and shaken at 30 °C for 2 h. The amount of dye desorbed (mg) was calculated from the increased concentration of the dye in the desorption solution. The percentage of the dye desorbed from the adsorbent was calculated using eqn (12):


