 Open Access Article
Biocompatible nanocarriers for passive transdermal delivery of insulin based on self-adjusting N-alkylamidated carboxymethyl cellulose polysaccharides†
Yael
Cohen
ab,
Guy
Cohen
 cd,
Dmitry
Tworowski
e,
Noy
Eretz-Kdosha
c,
Eldad
Silberstein
f,
Elazar
Fallik
a and
Elena
Poverenov
 *a
*a
aAgro-Nanotechnology and Advanced Materials Center, Institute of Postharvest and Food Sciences, Agricultural Research Organization, The Volcani Institute, Rishon LeZion 7505101, Israel. E-mail: elenap@volcani.agri.gov.il; Tel: +972-39683354
bThe Robert H Smith, Faculty of Agriculture, Food and Environment, Institute of Biochemistry, Food and Nutrition, The Hebrew University of Jerusalem, Rehovot 76100, Israel
cThe Skin Research Institute, Dead Sea & Arava Science Center, Masada 86910, Israel
dEilat Campus, Ben-Gurion University of the Negev, Eilat 8855630, Israel
eDepartment of Structural Biology, Weizmann Institute of Science, 76100 Rehovot, Israel
fDepartment of Plastic Surgery, Soroka University Medical Center, Ben-Gurion University of the Negev, Beer-Sheva, Israel
First published on 2nd March 2022
Abstract
In this work, we present biocompatible nanocarriers based on modified polysaccharides capable of transporting insulin macromolecules through human skin without any auxiliary techniques. N-Alkylamidated carboxymethyl cellulose (CMC) derivatives CMC-6 and CMC-12 were synthesized and characterized using attenuated total reflectance Fourier transform infrared (ATR-FTIR) and nuclear magnetic resonance (NMR) spectroscopy, gel permeation chromatography and thermogravimetric, calorimetric and microscopic techniques. The prepared modified polysaccharides spontaneously assemble into soft nanoaggregates capable of adjusting to both aqueous and lipid environments. Due to this remarkable self-adjustment ability, CMC-6 and CMC-12 were examined for transdermal delivery of insulin. First, a significant increase in the amount of insulin present in lipid media upon encapsulation in CMC-12 was observed in vitro. Then, ex vivo studies on human skin were conducted. Those studies revealed that the CMC-12 carrier led to an enhancement of transdermal insulin delivery, showing a remarkable 85% insulin permeation. Finally, toxicity studies revealed no alteration in epidermal viability upon treatment and the absence of any skin irritation or amplified cytokine release, verifying the safety of the prepared carriers. Three-dimensional (3D) molecular modeling and conformational dynamics of CMC-6 and CMC-12 polymer chains explained their binding capacities and the ability to transport insulin macromolecules. The presented carriers have the potential to become a biocompatible, safe and feasible platform for the design of effective systems for transdermal delivery of bioactive macromolecules in medicine and cosmetics. In addition, transdermal insulin delivery reduces the pain and infection risk in comparison to injections, which may increase the compliance and glycemic control of diabetic patients.
Introduction
Transdermal delivery of therapeutic agents is a very promising field in modern medicine. However, it is challenging because of the strong lipid skin barrier. To facilitate transdermal penetration of active molecules, especially hydrophilic ones, delivery systems must be developed.1Biopolymer-based delivery systems are widely studied and utilized in numerous fields such as medicine, tissue engineering, cosmetics and food science.2–6 Among all biopolymers, polysaccharides are favourable candidates for the construction of biocompatible delivery systems since they are hypoallergenic, non-toxic, biodegradable and widely available.7–9 In addition, polysaccharides also possess the significant advantage of a defined monomer structure that allows their rational modification and the precise tuning of their properties.10–12 Numerous delivery systems, including polysaccharide-based systems, have been investigated for transdermal applications and demonstrated notable success in the delivery of small molecules.1,13–17
However, transdermal delivery of high molecular-weight molecules remains challenging. Molecules with molecular weights (MWs) higher than 500 Da are usually injected.18 For instance, insulin is an eminent example of a macromolecule for which transdermal delivery could significantly improve the quality of life of numerous patients.19,20 The hormone insulin is a daily treatment for patients suffering from diabetes mellitus, a metabolic disorder that causes abnormal accumulation of glucose in the blood.21 As a hydrophilic macromolecule that is 5.5–6.0 kDa in size, insulin can barely pass dermal barriers. Therefore, millions of patients must inject insulin at least once every day or more, or use subcutaneous insulin devices. These options are unpleasant, require strict self-discipline and involve risks of microbial infection, local tissue necrosis and nerve damage.19 In addition, using non-invasive transdermal delivery of insulin is less painful than hypodermic injections and can also be used by patients with needle phobia. Transdermal delivery is also pharmacokinetically preferable to other non-invasive methods such as oral administration due to the lack of first-pass effect of insulin. Collectively, these benefits can increase patients' compliance and glycaemic control.19–21
Advanced physical methods to help transport bioactive macromolecules, including insulin, across the skin barrier have been reported. These methods include the use of microneedles,22–26 ultrasound-mediated penetration,26,27 transdermal photopolymerization28 and skin electroporation.29,30 Delivery methods enabling the transport of insulin without the auxiliary physical penetration techniques are more feasible. Therefore, molecular systems for passive transdermal delivery have recently attracted a great deal of attention. To date, only a few examples of such vehicles have been reported; those systems have been based on synthetic peptides, phospholipids and polysaccharides.31–35 Coadministration with synthetic peptides,31 CaCO3 based nanoparticles, poly(ester amide) based hybrid hydrogels36 or choline ionic liquid37 and solid-in-oil nanodispersions38 presents examples of advanced approaches that have been used to facilitate the transport of insulin. Nanoparticles containing insulin had also been shown to enhance insulin permeation. For instance, Zhao et al. demonstrated that a supercritical antisolvent (SAS) micronization process can produce nanoparticles with a high permeation rate that was linear for 6 h.39 Gold nanoparticles40 as well as nanorods with near infrared light irradiation41 had been found active in vivo. To the best of our knowledge, no polysaccharide-based systems for transdermal delivery of insulin have been previously reported.
Here, we report the synthesis of polysaccharide-based carriers capable of adjusting their structure to various environments and consequently facilitating cross-phase transport. The prepared systems were used for passive transdermal delivery of insulin. Skin toxicity studies were also performed to verify the efficacy and safety of the prepared materials.
Experimental section
Materials
Sodium carboxymethyl cellulose (MW = 250 kDa; DS = 0.9), n-dodecylamine and N-hydroxysuccinimide (NHS) were purchased from Acros Organics (Geel, Belgium). n-Hexylamine pyrene, insulin (monomer, human recombinant) and insulin labeled with fluorescein isothiocyanate (FITC; human recombinant) were purchased from Sigma Aldrich (Steinheim, Germany). 1-(3-Dimethylaminopropyl)-3-ethylcarbodiimide hydrochloride (EDC) was purchased from Alfa Aesar (Lancashire, UK). Dextran standards were purchased from PSS Polymer (Mainz, Germany). Ethanol and absolute ethanol were purchased from Gadot Group (Netanya, Israel). Water, high performance liquid chromatography (HPLC) grade, was purchased from Bio Lab (Jerusalem, Israel). Organic cold pressed sunflower oil (SO) was purchased from Joe & Co. (Vicenza, Italy). Deionized (DI) water was obtained by mechanically filtering water through a Treion TS1173 column. Deuterated solvent for the NMR analysis (D2O) was purchased from Armar Chemicals (Döttingen, Switzerland). All reagents and solvents were used without any further purification.Methods
Characterization of CMC-6 and CMC-12
| % substitution = 100 × [TN(CMC6 or CMC12)/Mw(N)]/[TOC(CMC)/Mw(C)] |
![[thin space (1/6-em)]](https://www.rsc.org/images/entities/char_2009.gif) 000 Da (PSS Polymer Standards Service GmbH, Germany). All data provided by the GPC system were collected and analyzed with the Empower 3 personal dissolution software. CMC, CMC-6 and CMC-12 powders were dissolved in the mobile phase to a final concentration of 1 mg mL−1. The solutions were filtered through a 0.22 μm nylon syringe filter.
000 Da (PSS Polymer Standards Service GmbH, Germany). All data provided by the GPC system were collected and analyzed with the Empower 3 personal dissolution software. CMC, CMC-6 and CMC-12 powders were dissolved in the mobile phase to a final concentration of 1 mg mL−1. The solutions were filtered through a 0.22 μm nylon syringe filter.
In vitro examination of the abilities of CMC-6 and CMC-12 to introduce insulin into a lipid environment
Ex vivo transdermal delivery studies
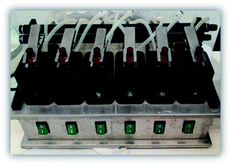
Transdermal insulin delivery was assessed using a Franz cell apparatus (Scheme 1; PermeGear, PA, USA). For preliminary evaluation, human skin (full thickness) was obtained from Zenbio (NC, US). All other experiments were performed on healthy women (between 30 and 65 years old) who were undergoing aesthetic abdominal surgery and had signed an informed consent form. The experiments were conducted with the approval of the IRB (Helsinki Committee) of Soroka Medical Center, Beer Sheva, Israel. A mechanical skin press apparatus was used to section the skin (with an average thickness of 2.2 ± 0.36 cm) and it was kept at −20 °C until it was used, but it was stored for no more than three months to retain the normal skin barrier.43,44 On the day of the experiment, the skin samples were pre-equilibrated with PBS for 1 h prior to use, with the dermal side submerged in the buffer. Then, the skin samples were clamped between the donor and receptor chambers, with the epidermal side facing the donor compartment (0.64 cm2 diffusion areas and 5 mL receptor volumes were used). The donor chamber was loaded with 200 μL of the sunflower oil solutions of the biopolymers, all containing insulin (0.2 mg mL−1). The sunflower oil containing insulin without biopolymer was used as a control treatment. The receptor chamber was filled with 5 mL of PBS containing sodium azide (to prevent microbial growth) and kept at 37 ± 0.5 °C under constant stirring (500 rpm). Samples (200 μL each) were taken at the indicated time points and an equal volume of the buffer was added immediately.To determine mass balance, the residual compounds in the donor chamber were collected, and five D-SQUAME® disc strips of the upper stratum corneum (nonspecific binding) were added and labeled as ‘Donor’. 15 additional tape strips were then taken to remove the stratum corneum and placed in glycine buffer supplemented with 0.5% Triton X-100 to elute the insulin. Then the epidermis and dermis were cut with a scalpel, submerged in glycine buffer supplemented with 0.5% Triton X-100 and vortexed for 5 min to elute the insulin (labeled as ‘viable skin’).
The amount of insulin permeated was quantified by enzyme-linked immunosorbent assay (ELISA; Mercodia, Uppsala, Sweden), using a designated standard curve. All of the samples were tested in three repetitions.
Skin integrity evaluation
Prior to the Franz cell permeation studies the integrity of the skin samples was visually evaluated. When indicated the following tests were also performed:Skin viability and irritation
All cell-culture media and reagents were purchased from Biological Industries (Beit-HaEmek, Israel). The skin samples were obtained from healthy women (between 30 and 65 years old) who were undergoing aesthetic abdominal surgery and had signed an informed consent form. The experiments were conducted with the approval of the IRB (Helsinki Committee) of Soroka Medical Center, Beer Sheva, Israel. Human skin culture preparation and treatments were performed under aseptic conditions. A mechanical skin-press apparatus was used to section the skin into 0.64 cm2 pieces, as previously described (Scheme 2; left).45 The skin explants were maintained in an air–liquid interface, with the dermal side submerged in the liquid. The biopolymers were applied topically (3 μL). After 48 h, the spent media were discarded and IL-1α was evaluated by ELISA (Biolegend, CA, US). In addition, the epidermis was separated and viability was determined by MTT, as previously reported after 48 h (Scheme 2; right).46 For morphological evaluation, the samples were fixed with 4% formaldehyde for 1 h at room temperature. Then, the tissues were washed with PBS and kept in 70% ethanol at 2–8 °C until use. Following dehydration, paraffin sections (10 μm) were prepared, and slides were stained with hematoxylin-eosin solution.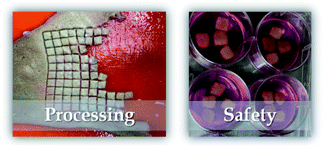 | ||
| Scheme 2 Skin processing (left) and ex vivo safety measurements of human skin organ cultures (right). | ||
Computational modelling
The 3D structures of cellulose 100mer chains were built using CarbBuilder program,47 and 90 hydroxyls in D-glucose units were randomly substituted by carboxymethyl moieties (corresponding to a DS of 0.9) using our python program SubRandoMol.py and the Indigo library/modules.48 Next, structures of CMC-6 and CMC-12 polymers were modelled by random replacement of CMC carboxy groups by 20 N-hexyl and 18 N-dodecyl-amide groups, according to our experimental DS values of 20% and 18% determined for CMC-6 and CMC-12, respectively.Multiple molecular dynamics (MD) trajectories (10–50 ns) were generated for different single 100mer CMC-6 and CMC-12 polymer chains by GROMACS 2021.2 (ref. 49) using the MD protocols.50,51 Different CMC-6 and CMC-12 single chains were placed into the 53 × 3.5 × 3.5 nm3 box filled with solvent (water) molecules. Total charges of CMC-6 (−78 e) and CMC-12 (−72 e) molecules were neutralized by 78 and 72 sodium (Na+) cations, respectively. Molecular topologies based on the amber99SB and carbohydrate GLYCAM06 force fields52 were prepared for MD simulations using AmberTools and acpype programs.53 For each trajectory, snapshots were collected, and the persistence length of CMC-6 and CMC-12 chains and conformational flexibility of CM groups and N-octyl-amide-CMC chains were analysed.
Results and discussion
Synthesis and characterization
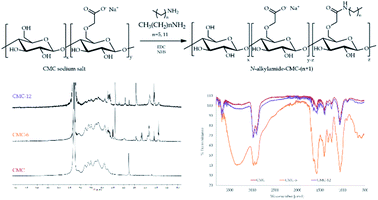
The N-alkylamidated polysaccharides were synthesized in a one-step reaction of carboxymethyl cellulose (CMC) with hexylamine or dodecylamine to yield CMC-6 or CMC-12, respectively (Fig. 1). The isolated products were characterized by ATR-FTIR and 1H-NMR spectroscopy, which confirmed the successful coupling. The ATR-FTIR scans included new peaks for alkyl C–H bending at 680–720 cm−1, amide frequencies at 1560–1580 cm−1 and N–H stretching at ∼3300 cm−1. The 1H-NMR scans showed the aliphatic protons of the coupled alkyl chains at 0.8–2.1 ppm and the α to amide bond protons at 2.8–3.2 ppm. The peaks of the original CMC were found to be in accordance with those reported in previous publications.54 The newly appearing peaks of the modified CMC-6 or CMC-12 correlate with the FTIR55,56 and 1H-NMR35,56 data of previously reported modified polysaccharides. Both characterization methods verify the formation of new secondary amide bonds confirming N-alkylamide CMC modifications.The modified polymers remain thermally stable. In the TGA spectra, CMC-6 displayed a thermal decomposition pattern similar to that of the original CMC with a water weight loss event at ∼57 °C and main pyrolytic decomposition events at 286.0 and 283.5 °C for CMC and CMC-6, respectively. The dodecyl substituted CMC-12 spectra were different, showing two defined pyrolytic decomposition events, one at 187.3 °C (with 20.3% weight loss) and the other at 290.0 (with 38.5% weight loss). The total weight loss for CMC, CMC-6, and CMC-12 was 77.6%, 71.9% and 87.2%, respectively. The water evaporation area points to ∼10% water content, which is expectable for polysaccharides. DSC studies showed thermal decomposition, without any prior glass transition because of the semi-rigid nature of the polysaccharide backbone (Fig. 2 and S1†).
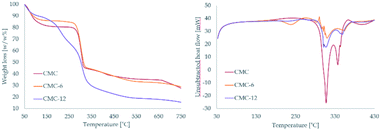 | ||
| Fig. 2 Thermal gravimetric analysis – TGA (left) and differential scanning calorimetry – DSC (right) of CMC, CMC-6 and CMC-12. | ||
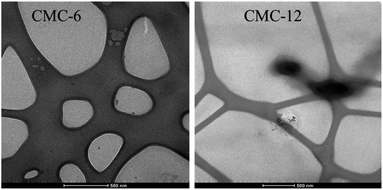
The degree of substitution was determined using the total organic carbon (TOC) method and was found to be 24% and 18% for CMC-6 and CMC-12, respectively. Conjugation with aliphatic amines provides the modified polysaccharides with amphiphilic properties, allowing spontaneous self-assembly that takes place above a specific concentration, termed the critical aggregation concentration (Table 1). While the original CMC does not undergo self-assembly, CMC-6 and CMC-12 derivatives spontaneously assemble at concentrations above 1.66 and 0.05 mg mL−1, respectively. Transmission electron microscopy (TEM) studies confirmed the formation of stable nanometric aggregates, 50–150 nm in size for CMC-6 and 150–230 nm in size for CMC-12 (Fig. 3).
| DS [%] | CAC [mg mL−1] | RT [min] | M n [kDa] | PDI | |
|---|---|---|---|---|---|
| CMC | — | — | 10.397 | 154 | 1.97 |
| CMC-6 | 24 | 1.66 ± 0.58 | 9.486 | 584 | 2.95 |
| CMC-12 | 18 | 0.05 ± 0.004 | 8.653 | 5423 | 2.85 |
Gel permeation chromatography (GPC) revealed that the coupled aliphatic chains caused a decrease in the retention time; the longer the chain, the shorter the retention time. The number average molecular weight (Mn) of the prepared polymers was calculated using dextran as a calibrating standard. Mn increases with the length of the coupled chain. It should, however, be noted that it is better to view Mn as a comparing parameter and not as an absolute value, since the spontaneous assembling ability affects the gel permeation properties of the prepared CMC-6 and CMC-8, and their Mn values (Table 1).
Transdermal delivery of insulin
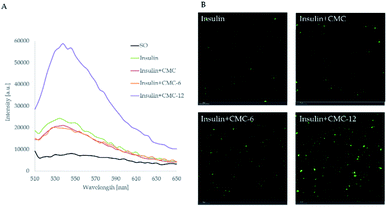
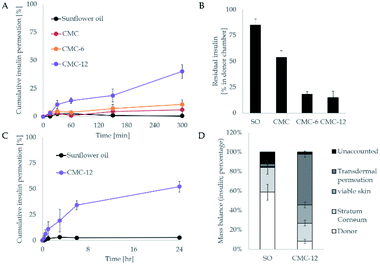
First, in vitro studies of the abilities of CMC-6 and CMC-12 to introduce insulin into a lipid environment were performed. For this purpose, insulin labeled with the FITC fluorescent probe in sunflower oil was used. The encapsulation ability of the prepared systems was measured by spectrofluorometry and confocal laser scanning microscopy (Fig. 4). It can be seen that among all of the examined treatments, the CMC-12 nanocarrier demonstrated the best performance.In the next stage, the insulin carrying biopolymers were mounted on the Franz cell apparatus and the kinetics of their permeation across human skin was measured (infinite dose settings). As shown in Fig. 5A, the unmodified CMC had no noticeable impact and did not enhance insulin permeation. Meanwhile, CMC-6 slightly enhanced insulin permeation, and a massive increase was obtained using the CMC-12 carrier, correlating with the results observed in in vitro studies. The superior performance of CMC-12 can be attributed to a long dodecyl substituent that increases the membrane penetration ability of that carrier. The effect of alkyl chain length on mass transport across membranes has been reported previously.57 In addition, it can be speculated that the dodecyl substituted CMC-12 biopolymer facilitates the formation of less tightly self-assembled structures, making it a better choice for the encapsulation of large macromolecules such as insulin. The fast kinetics shown here without a significant lag time is not characteristic of the permeation of macromolecules, such as insulin. However, Cevc et al. showed in as early as 1998 that carrier mediated transcutaneous insulin delivery by transferosomes can be rapid.58 This was also true for the transdermal delivery of insulin by iodine facilitators.59
In addition, the residual insulin in the donor chamber was examined and a mirror image was seen (Fig. 5B), further supporting the transdermal results. To further investigate the impact of the leading compound (CMC-12), a mass balance analysis was performed. The results shown in the lower panel of Fig. 5 demonstrate the enhanced capacity of the biopolymers, where less than 30% did not permeate through the stratum corneum.
As fast kinetics was found together with high efficacy, the possibility that the barrier capacity of the skin was hampered by the biopolymers was addressed. For this purpose, two additional skin integrity tests were used, Trans-Epidermal Water Loss (TEWL) and methylene blue permeation.60,61 The results shown in Table 2 depict the TEWL and methylene blue before the application of the compounds or after 5 or 24 h. As can be seen, the initial readings were within the expected range. Importantly, water loss was not affected by the compound, which implies that the barrier function was unaltered by the different treatments. SDS treatment was used as a positive control that indeed increased water loss by almost 3-fold, confirming that this experimental setting enables skin damage to be distinguished. Similarly, no detectable levels of methylene blue were found, further demonstrating the integrity of the skin samples after exposure to the biopolymer-based delivery system.
| TEWL test | SO | CMC | CMC-6 | CMC-12 | SDS 10% |
|---|---|---|---|---|---|
| Baseline | 9.6 ± 0.79 | 9.3 ± 0.63 | 8.1 ± 0.38 | 9.7 ± 0.19 | 10.0 ± 2.4 |
| 5 h pE | 10.1 ± 2.7 | 9.2 ± 0.67 | 7.0 ± 1.76 | 9.1 ± 1.70 | 27.1 ± 3.3 |
| Baseline | 9.8 ± 0.68 | 9.7 ± 1.37 | 9.7 ± 0.28 | 10.6 ± 0.51 | |
| 24 h pE | 10 ± 0.45 | 10.1 ± 0.33 | 10 ± 0.22 | 9.7 ± 0.76 |
| Methylene blue test | 5 h | 24 h |
|---|---|---|
| SO | <0.01 | <0.01 |
| CMC | <0.01 | <0.01 |
| CMC-6 | <0.01 | <0.01 |
| CMC-12 | <0.01 | <0.01 |
| SDS 10% | 0.13 ± 0.06 |
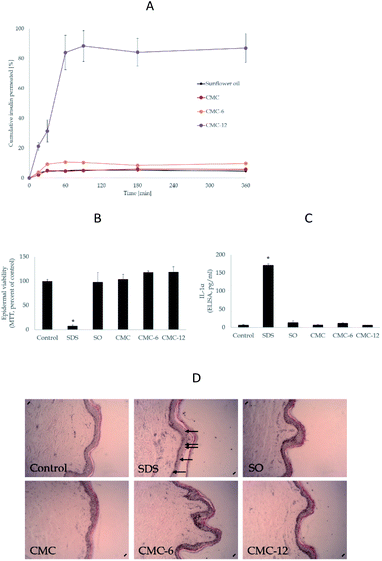
To assess the potential of the biopolymer for efficient delivery of a precise dose, a second transdermal evaluation was performed, but with a 5-fold lower insulin level (defined dose). As can be seen in Fig. 6A, the system transferred above 85% of the insulin amount through the dermal barrier. Thus, the action of the biopolymers can be controlled and seen after 1 h of application.
Next, an ex vivo human skin organ culture was used to exclude the possibility of skin damage during the transdermal delivery process. The biopolymers were topically applied to the epidermal side of the skin. As expected, sodium dodecyl sulphate (SDS) markedly compromised skin viability, as seen in the MTT results (Fig. 6B). However, none of the biopolymers had any negative effects on the skin, in comparison to the untreated control (Fig. 6C). Similar results were obtained from the histological evaluations: SDS markedly disrupted the epidermal layer, while no morphological alterations by the media (SO) or biopolymers were recorded. Lastly, the secreted level of the irritant cytokine IL-1α62,63 was used as an independent marker to assess the impact of the biopolymers on the skin. The results (Fig. 6D) clearly showed no enhancement by the compounds. Thus, the biopolymers were verified to be both effective and safe. The results of TEWL and methylene blue tests combined with the skin irritation test shown in Fig. 6 verify that the observed enhanced insulin penetration is highly unlikely the result of skin damage.
To the best of our knowledge, polysaccharide-based systems for transdermal delivery of insulin have not been reported before. Synthetic polymers,31 fatty substances,32 ionic small molecules,37 oily formulations,38,41 SASs,39 and gold nanostructure-based40,41 systems were reported in this regard. Delivery systems based on polysaccharides benefit from biocompatibility, safety and cost-effectiveness, since nature sourced polysaccharides are widely available. Most importantly, the properties of such systems can be carefully tuned, since polysaccharides have a well-defined chemical structure of monomer units allowing predictable rational modification.
Three-dimensional molecular modelling
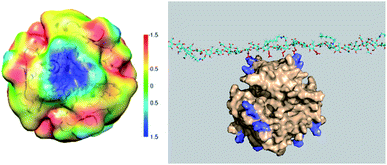
Three-dimensional molecular modelling and conformational dynamics studies of CMC-6 and CMC-12 in a dilute solution show that almost all trajectories of both polymers are converged after 25–30 ns. The hydrophobic patches on the modified CMC surface created by N-alkyl groups can (1) interact with non-polar amino acids of insulin molecules, (2) contribute to self-aggregation of CMC molecules, and (3) transport the CMC-bound insulin into a lipid phase. According to our model, processes (2) and (3) are favoured by long N-alkyl chains and therefore are most pronounced for CMC-12.Being solvated, amphiphilic polymers that bear anionic carboxyl groups, CMC-6 and CMC-12 can be involved in the electrostatic interactions with cationic lysine (Lys) and arginine (Arg) moieties. Indeed, significant charge complementarity between the positive charges on the molecular surfaces of the insulin hexamer and the negative charges of CMC-based polysaccharides was found. Specifically, two arginine (Arg22) and two lysine (Lys29) moieties from two different subunits on the insulin hexamer surface are exposed to the bulk aqueous solution and therefore are accessible for electrostatic attraction to the carboxyl groups of the modified CMC polysaccharide (Fig. 7 left). These attractions are possibly due to clusters of 4–6 carboxyls on the polysaccharide surface that enhance the negative charge. These negatively charged clusters are attracted to the areas of the positive potential (blue) on the molecular surface of insulin (Fig. 7 right).
Thus, in the N-alkylamidated CMC-based carriers the insulin binding is driven by electrostatic interactions, while the delivery into a lipid phase is promoted by long alkyl chains.
Conclusions
This study demonstrates the successful achievement of a challenging goal: the transdermal delivery of hydrophilic macromolecules using biocompatible carriers without any auxiliary physical treatment. N-Alkylamidated carboxymethyl cellulose polysaccharides CMC-6 and CMC-12, capable of spontaneously assembling into soft nanocarriers, were synthesized. These carriers exhibited a remarkable ability to self-adjust to aqueous and lipid environments and were, therefore, examined for transdermal delivery. The CMC-12 carrier led to a remarkable increase of transdermal delivery of insulin, showing a capacity of 85% of the compound in the receiver chamber. 3D molecular modelling and conformational dynamics studies shed light on the interactions of insulin molecules with the prepared carriers. Toxicity studies demonstrated high epidermal viability and the absence of cytokine release amplification, initially verifying their safety.The presented materials have the potential to become a safe and feasible platform for effective transdermal delivery of bioactive macromolecules in medicine and cosmetics. The progress in transdermal delivery of insulin is of particular importance, however additional studies are needed. Additional challenges need to be addressed prior to clinical usage of this new delivery system. The permeated insulin levels should be precisely regulated to reduce the possibility of hypo- or hyper-glycemia. The topical formulation and application area should also be controlled. The integration of insulin-containing carriers into a transdermal patch, for instance, will provide an easy way to control both the dosage and the surface area. In addition, in vivo validation of safety (multiple dosage) and efficacy needs to be done in further studies.
Author contributions
Conceptualization, Y. C., E. F. and E. P.; methodology, Y. C., G. C. and D. T.; software, Y. C. and D. T.; validation, Y. C. and E. P.; formal analysis, Y. C. and G. C.; investigation, Y. C. and N. E. K.; resources, G. C., E. S., E. F. and E. P.; writing – original draft preparation, Y. C.; writing – review & editing, Y. C., G. C., D. T., E. S. and E. P.; visualization, Y. C. and E. P.; supervision, G. C., E. F. and E. P.; project administration, Y. C. and E. P.; funding acquisition, G. C. and E. P.Conflicts of interest
The authors declare no conflict of interest.Acknowledgements
The authors would like to thank Dr Yael Levi-Kalisman for providing technical support for the TEM imaging, Eduard Belausov for his help with CLSM and Raanan Gvirtz for his help with the Franz cell apparatus. G. C. is partially supported by the Israel Ministry of Science and Technology (580458776).Notes and references
- R. Yang, T. Wei, H. Goldberg, W. Wang, K. Cullion and D. S. Kohane, Adv. Mater., 2017, 29, 1606596 CrossRef PubMed.
- M. J. Webber, E. A. Appel, E. W. Meijer and R. Langer, Nat. Mater., 2015, 15, 13–26 CrossRef PubMed.
- J. Kim, D. Jang, H. Park, S. Jung, D. H. Kim and W. J. Kim, Adv. Mater., 2018, 30, 1707351 CrossRef PubMed.
- Y. Cao and R. Mezzenga, Nat. Food, 2020, 1, 106–118 CrossRef.
- W. F. Lai and H. C. Shum, ACS Appl. Mater. Interfaces, 2015, 7, 10501–10510 CrossRef CAS PubMed.
- D. Witzigmann, D. Wu, S. H. Schenk, V. Balasubramanian, W. Meier and J. Huwyler, ACS Appl. Mater. Interfaces, 2015, 7, 10446–10456 CrossRef CAS PubMed.
- E. M. Bachelder, E. N. Pino and K. M. Ainslie, Chem. Rev., 2017, 117, 1915–1926 CrossRef CAS PubMed.
- B. Ates, S. Koytepe, A. Ulu, C. Gurses and V. K. Thakur, Chem. Rev., 2020, 120, 9304–9362 CrossRef CAS PubMed.
- Y.-H. Zhang, Y.-M. Zhang, J. Yu, J. Wang and Y. Liu, Chem. Commun., 2019, 55, 1164–1167 RSC.
- R. Malviya, P. K. Sharma and S. K. Dubey, Mater. Sci. Eng., C, 2016, 68, 929–938 CrossRef CAS PubMed.
- V. G. Muir and J. A. Burdick, Chem. Rev., 2021, 121, 10908–10949 CrossRef CAS PubMed.
- M. Grossutti and J. R. Dutcher, Biomacromolecules, 2020, 21, 4871–4877 CrossRef CAS PubMed.
- Y. Cohen, R. Rutenberg, G. Cohen, B. Veltman, R. Gvirtz, E. Fallik, D. Danino, E. Eltzov and E. Poverenov, ACS Appl. Bio Mater., 2020, 3, 2209–2217 CrossRef CAS PubMed.
- M. R. Prausnitz and R. Langer, Nat. Biotechnol., 2008, 26, 1261–1268 CrossRef CAS PubMed.
- M. S. Kapoor, A. D'Souza, N. Aibani, S. S. Nair, P. Sandbhor, D. kumari and R. Banerjee, Sci. Rep., 2018, 8, 16122 CrossRef PubMed.
- X. H. Wang, T. Su, J. Zhao, Z. Wu, D. Wang, W. N. Zhang, Q. X. Wu and Y. Chen, Cellulose, 2020, 27, 10277–10292 CrossRef CAS.
- J. Laubach, M. Joseph, T. Brenza, V. Gadhamshetty and R. K. Sani, J. Controlled Release, 2021, 329, 971–987 CrossRef CAS PubMed.
- S. Kalave, B. Chatterjee, P. Shah and A. Misra, Curr. Pharm. Des., 2021, 27, 4330–4340 CrossRef CAS PubMed; J. D. Bos and M. M. H. M. Meinardi, Exp. Dermatol., 2000, 9, 165–169 CrossRef PubMed.
- Y. Zhang, J. Yu, A. R. Kahkoska, J. Wang, J. B. Buse and Z. Gu, Adv. Drug Delivery Rev., 2019, 139, 51–70 CrossRef CAS PubMed.
- E. S. Khafagy, M. Morishita, Y. Onuki and K. Takayama, Adv. Drug Delivery Rev., 2007, 59, 1521–1546 CrossRef CAS PubMed.
- R. Bilous and R. Donnelly, Handbook of Diabetes, 4th edn, 2010 Search PubMed.
- J. Cao, N. Zhang, Z. Wang, J. Su, J. Yang, J. Han and Y. Zhao, Pharmaceutics, 2019, 11, 235 CrossRef CAS PubMed.
- S. Liu, M. N. Jin, Y. S. Quan, F. Kamiyama, K. Kusamori, H. Katsumi, T. Sakane and A. Yamamoto, Eur. J. Pharm. Biopharm., 2014, 86, 267–276 CrossRef CAS PubMed.
- I.-C. Lee, W.-M. Lin, J.-C. Shu, S.-W. Tsai, C.-H. Chen and M.-T. Tsai, J. Biomed. Mater. Res., Part A, 2017, 105, 84–93 CrossRef CAS PubMed.
- B. Xu, G. Jiang, W. Yu, D. Liu, Y. Zhang, J. Zhou, S. Sun and Y. Liu, J. Mater. Chem. B, 2017, 5, 8200–8208 RSC.
- P. Zhang, Y. Zhang and C. G. Liu, RSC Adv., 2020, 10, 24319–24329 RSC.
- S. Lee, B. Snyder, R. E. Newnham and N. Barrie Smith, Diabetes Technol. Ther., 2004, 6, 808–815 CrossRef CAS PubMed.
- J. Elisseeff, K. Anseth, D. Sims, W. Mcintosh, M. Randolph and R. Langer, Proc. Natl. Acad. Sci. U. S. A., 1999, 96, 3104–3107 CrossRef CAS PubMed.
- C. Lombry, N. Dujardin and V. Préat, Pharm. Res., 2000, 17, 32–37 CrossRef CAS PubMed.
- A. Sen, M. E. Daly and S. W. Hui, Biochim. Biophys. Acta, Biomembr., 2002, 1564, 5–8 CrossRef CAS.
- Y. Chen, Y. Shen, X. Guo, C. Zhang, W. Yang, M. Ma, S. Liu, M. Zhang and L. P. Wen, Nat. Biotechnol., 2006, 24, 455–460 CrossRef CAS PubMed.
- J. Guo, Q. Ping and L. Zhang, Drug Delivery, 2000, 7, 113–116 CrossRef CAS PubMed.
- B. Godin and E. Touitou, Crit. Rev. Ther. Drug Carrier Syst., 2003, 20, 63–102 CrossRef CAS PubMed.
- M. Witting, A. Boreham, R. Brodwolf, K. Vávrová, U. Alexiev, W. Friess and S. Hedtrich, Mol. Pharm., 2015, 12, 1391–1401 CrossRef CAS PubMed.
- S. Son, J. Lim, T. Kang, J. Jung and E.-K. Lim, Nanomaterials, 2017, 7, 427 CrossRef PubMed.
- S. Zhang, P. Xin, Q. Ou, G. Hollett, Z. Gu and J. Wu, J. Mater. Chem. B, 2018, 6, 6723–6730 RSC.
- E. E. L. Tanner, K. N. Ibsen and S. Mitragotri, J. Controlled Release, 2018, 286, 137–144 CrossRef CAS PubMed.
- Y. Tahara, S. Honda, N. Kamiya and M. Goto, Medchemcomm, 2012, 3, 1496–1499 RSC.
- X. Zhao, Y. Zu, S. Zu, D. Wang, Y. Zhang and B. Zu, Drug Dev. Ind. Pharm., 2010, 36, 1177–1185 CrossRef CAS PubMed.
- M. Shilo, P. Berenstein, T. Dreifuss, Y. Nash, G. Goldsmith, G. Kazimirsky, M. Motiei, D. Frenkel, C. Brodie and R. Popovtzer, Nanoscale, 2015, 7, 20489–20496 RSC.
- K. Nose, D. Pissuwan, M. Goto, Y. Katayama and T. Niidome, Nanoscale, 2012, 4, 3776–3780 RSC.
- O. Setter and Y. D. Livney, Phys. Chem. Chem. Phys., 2015, 17, 3599–3606 RSC.
- T. S. Pereira, G. N. Gotor, L. S. Beltrami, C. G. Nolla, J. A. V. Rocha, F. P. Broto, L. R. Comellas and V. M. F. Vargas, Mutat. Res., Genet. Toxicol. Environ. Mutagen., 2010, 702, 78–85 CrossRef CAS PubMed.
- J. Kielhorn, S. Melching-Kollmuss and I. Mangelsdorf, IPCS: Dermal Absorption; Environmental Health Criteria; 235, Geneva, Hanover, Germany, 2006 Search PubMed.
- N. Ogen-Shtern, K. Chumin, G. Cohen and G. Borkow, J. Cosmet. Dermatol., 2020, 19, 1522–1527 CrossRef PubMed.
- S. Kahremany, I. Babaev, R. Gvirtz, N. Ogen-Stern, S. Azoulay-Ginsburg, H. Senderowitz, G. Cohen and A. Gruzman, Skin Pharmacol. Physiol., 2019, 32, 173–181 CrossRef CAS PubMed.
- M. M. Kuttel, J. Ståhle and G. Widmalm, J. Comput. Chem., 2016, 37, 2098–2105 CrossRef CAS PubMed.
- M. Pavlov and D. Rybalkin, Indigo Toolkit, https://lifescience.opensource.epam.com/indigo/index.html, accessed 12 November 2021 Search PubMed.
- Welcome to the GROMACS documentation! — GROMACS 2021.2 documentation, https://manual.gromacs.org/documentation/2021.2/index.html, accessed 23 November 2021 Search PubMed.
- Y. Yu, T. Tyrikos-Ergas, Y. Zhu, G. Fittolani, V. Bordoni, A. Singhal, R. J. Fair, A. Grafmüller, P. H. Seeberger and M. Delbianco, Angew. Chem., Int. Ed. Engl., 2019, 58, 13127–13132 CrossRef CAS PubMed.
- Y. Tidhar, H. Weissman, D. Tworowski and B. Rybtchinski, Chem.–Eur. J., 2014, 20, 10332–10342 CrossRef CAS PubMed.
- K. N. Kirschner, A. B. Yongye, S. M. Tschampel, J. González-Outeiriño, C. R. Daniels, B. L. Foley and R. J. Woods, J. Comput. Chem., 2008, 29, 622–655 CrossRef CAS PubMed.
- A. W. Sousa Da Silva and W. F. Vranken, BMC Res. Notes, 2012, 5, 367 CrossRef PubMed.
- H. Kono, K. Oshima, H. Hashimoto, Y. Shimizu and K. Tajima, Carbohydr. Polym., 2016, 146, 1–9 CrossRef CAS PubMed.
- T. Taubner, A. Synytsya and J. Čopíková, Int. J. Biol. Macromol., 2015, 72, 11–18 CrossRef CAS PubMed.
- A. Pettignano, A. Charlot and E. Fleury, Polym, 2019, 11, 1227 Search PubMed.
- G. L. Flynn and S. H. Yalkowsky, J. Pharm. Sci., 1972, 61, 838–852 CrossRef CAS PubMed.
- G. Cevc, D. Gebauer, J. Stieber, A. Schätzlein and G. Blume, Biochim. Biophys. Acta, Biomembr., 1998, 1368, 201–215 CrossRef CAS.
- A. C. Sintov and U. Wormser, J. Controlled Release, 2007, 118, 185–188 CrossRef CAS PubMed.
- K. Guth, M. Schäfer-Korting, E. Fabian, R. Landsiedel and B. van Ravenzwaay, Toxicol. In Vitro, 2015, 29, 113–123 CrossRef CAS PubMed.
- F. K. Akomeah, G. P. Martin and M. B. Brown, J. Pharm. Sci., 2007, 96, 824–834 CrossRef CAS PubMed.
- R. Gvirtz, N. Ogen-Shtern and G. Cohen, Pharmaceutics, 2020, 12, 299 CrossRef CAS PubMed.
- D. S. Olsen, M. Lee and A. P. Turley, Toxicol. In Vitro, 2018, 50, 426–432 CrossRef CAS PubMed.
Footnote |
| † Electronic supplementary information (ESI) available: Comprehensive TGA data derivatives, calibration curve of methylene blue and immunoassay method validation analysis. See DOI: 10.1039/d2na00005a |
| This journal is © The Royal Society of Chemistry 2022 |

