 Open Access Article
Can molecular flexibility control crystallization? The case of para substituted benzoic acids†
Sin Kim
Tang
,
Roger J.
Davey
 *,
Pietro
Sacchi
 and
Aurora J.
Cruz-Cabeza

Department of Chemical Engineering and Analytical Science, School of Engineering, University of Manchester, M13PL, UK. E-mail: roger.davey@manchester.ac.uk
First published on 16th November 2020
Abstract
Despite the technological importance of crystallization from solutions almost nothing is known about the relationship between the kinetic process of nucleation and the molecular and crystal structures of a crystallizing solute. Nowhere is this more apparent than in our attempts to understand the behavior of increasingly large, flexible molecules developed as active components in the pharmaceutical arena. In our current contribution we develop a general protocol involving a combination of computation (conformation analysis, lattice energy), and experiment (measurement of nucleation rates), and show how significant advances can be made. We present the first systematic study aimed at quantifying the impact of molecular flexibility on nucleation kinetics. The nucleation rates of 4 para substituted benzoic acids are compared, two of which have substituents with flexible chains. In making this comparison, the importance of normalizing data to account for differing solubilities is highlighted. These data have allowed us to go beyond popular qualitative descriptors such ‘crystallizability’ or ‘crystallization propensity’ in favour of more precise nucleation rate data. Overall, this leads to definite conclusions as to the relative importance of solution chemistry, solid-state interactions and conformational flexibility in the crystallization of these molecules and confirms the key role of intermolecular stacking interactions in determining relative nucleation rates. In a more general sense, conclusions are drawn as to conditions under which conformational change may become rate determining during a crystallization process.
Introduction
Crystallization is an essential tool of the pharmaceutical, agrochemical and specialty chemical industries used to purify and to create products in reproducible solid forms.1 In the pharma arena it is clear that since the 1940s both the molecular weight and the number of rotatable bonds in active molecules have been increasing2 such that there is currently significant interest in the relationship between molecular conformation and the ‘ease’ with which a molecule will crystallize. One well-known example of the relevance of this issue is the case of Ritonavir, where conformational problems delayed the crystallization of the most stable polymorph, which started appearing randomly in formulated products two years after its commercialization. This reduced its bioavailability and resulted in product withdrawal.3 In general, the existence of crystal forms built from different conformers is well known4 but the 2000 paper by Yu et al.5 was one of the earliest to explore links between conformation and crystallization. They used the term ‘tendency to crystallize’ to frame their arguments and concluded that conformational flexibility could lead to a reduced crystallization tendency. Others followed and confirmed these ideas using additional qualitative concepts such as ‘crystallizability’ or ‘crystallization propensity’.6–8 Attempts have since been made to link these ideas more formally to crystallization kinetics. Baird et al.9 studied the melt crystallization of more than 50 molecules, Derdour et al.10–12 incorporated conformation into a formal kinetic model of crystal growth and Threlfall et al.13 suggested experimental metastable zone widths as a useful means to compare kinetics. Taken together, these studies indicate that molecules with large numbers of rotatable bonds can often be difficult to crystallize.A further, related, aspect of this issue, often discussed within the crystallography community, concerns the origin of structures having multiple molecules in their asymmetric unit (Z′). Of the many possible causes of this phenomenon, one area of speculation has been that such structures may originate from different conformers available in solution and therefore reflect events taking place during the nucleation process. Thus in 2003, Steed15 referred to the idea of such a crystal packing as a ‘fossil relic’ from the fastest growing nucleus. This was followed, in 2007, by further discussion of this idea, first by Desiraju16 and subsequently by Anderson and Steed.17 Desiraju speculated that ‘the idea that a higher Z′ polymorph is a manifestation of incomplete or interrupted crystallisation is attractive, but more proof is needed for this conjecture. The most interesting aspect, to my mind, of all this is that high Z′ structures may teach us something about the mechanism of crystallisation.’ Steed and Anderson further underlined the potential role of kinetic factors but were clear that, to suggest that this one explanation covers all examples ‘is a dangerous oversimplification and must be treated with extreme caution.’, a point reemphasised in the later review by Steed and Steed.14
There is thus a body of evidence, largely qualitative or semi-quantitative, linking conformational flexibility with difficulties of crystallisation. There has been much discussion suggesting that this behaviour may arise at the point of nucleation.18 However, up until now there has been no attempt to confirm the validity of this speculation through the direct experimental measurement of nucleation rates. The aim of this current contribution is to rectify this situation and provide a framework within which relevant experiments and computations may be performed. Fortunately, during the last decade crystal nucleation from solution has received much academic attention19 including the development of new, easily accessible, methodologies for determining rates.20 Thus, the roles of solution complexation and solute desolvation in particular have been well studied.21 In some cases, solvent dependent, solute self-aggregation appears to determine the polymorphic outcome of a crystallization experiment22,23 while in others there is apparently no link24 between solution and solid-state chemistry. Recently we reported on the nucleation kinetics of 4 para substituted benzoic acids25 concluding that it was the continuous aromatic, ring stacking interactions that determined the relative nucleation rates, a view supported by the more recent work of Liu et al. for the nucleation and growth rates of flufenamic acid (a meta substituted benzoic acid).26
Our current study builds on this previous work by considering two additional para substituted benzoic acids, p-butoxy benzoic acid (pBOBA) and p-pentyl benzoic acid (pPENTYLBA), both of which have flexible, five membered chains as para substituents. These chains each have four torsions and their crystal structures have multiple molecules in their asymmetric units and so are considered suitable for comparison with our previous data on p-toluic (pTA) and benzoic (BA) acids, which do not possess such conformational flexibility. Our objective is to draw some sound conclusions as to the relationship between ‘crystallizability’, kinetics, crystal structure and conformation.
pBOBA and pPENTYLBA conformational analysis
Both pBOBA and pPENTYLBA have five rotatable bonds of interest: four related to the alkyl chain conformation and one related to the carboxyl group orientation. Since the carboxylic group adopts a conformation close to planar with respect to the benzene ring with a torsion angle around either 0° or 180° or both if proton-disorder is present (which is common in benzoic acids, also in pBOBA), we will focus our conformational analysis around the alkyl chain only.Fig. 1 shows an overlay of the conformations of the two acids as they appear in their crystal structures: two for pBOBA (Z′ = 2, top right, Refcode BUXBZA01) and three for pPENTYLBA27 (Z′ = 3, CCDC Deposition number 2003448, lower right). The alkoxy and alkyl chain conformations have four associated torsions (θ1–θ4) as defined in Fig. 1 (left). The number of plausible conformers for a flexible molecule lies between 2N and 3N, depending on its composition and number of torsions (N). For pBOBA and pPENTYLBA this amounts to, respectively, 54 and 81 conformers. Given this potential number of stable conformers, we will focus on the conformations observed in the crystal structures and the energy barriers for their interconversion.
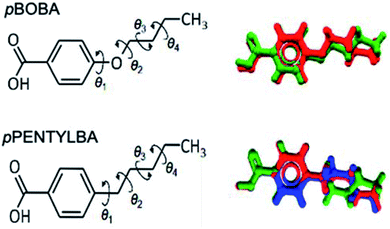 | ||
| Fig. 1 Molecular structure and definition of rotatable bonds in pBOBA and pPENTYLBA (left) and overlay of the conformations found in their crystal structures (right). | ||
From Fig. 1 we can appreciate that θ1 defines the conformation of the chain relative to the aromatic ring whilst θ2–θ4 define the configuration of the chain (linear versus twisted) itself. The observed values of θ1–θ4 for the various conformations found in the crystal structures of pBOBA and pPENTYLBA (together with their gas-phase conformers) are given in Table 1. Since both crystal structures are centrosymmetric, all symmetrically independent conformations also exist in their inverted geometries (both are presented in Table 1).
| Molecule | Crystal conformation | Type | Torsion angles in the crystal conformations, θ/° | Optimised conformera | Relative conformer energyb | Energy barriera | |||
|---|---|---|---|---|---|---|---|---|---|
| θ 1 | θ 2 | θ 3 | θ 4 | ||||||
| a Linear (CL) versus twisted (CTa or CTb). b Calculated at the M06/6-31+G** level of theory in the gas-phase using GAUSSIAN09. Similar calculations were done in implicit solvation models for toluene and IPA which resulted in similar results. | |||||||||
| pBOBA | BUXBZA01 m1 | Linear | 179.7 | 179.8 | −176.5 | 178.4 | CL | 1.5 kJ mol−1 | CL → CT |
| BUXBZA01 m1-inverted | −179.7 | −179.8 | 176.5 | −178.4 | (CT-i) | 12.0 kJ mol−1 | |||
| BUXBZA01 m2 | Twisted | 3.59 | 174.6 | −63.3 | −175.2 | CT | 0.0 kJ mol−1 | CL → CT | |
| BUXBZA01 m2-inverted | −3.59 | −174.6 | 63.3 | 175.2 | (CT-i) | 13.5 kJ mol−1 | |||
| pPENTYLB | Form I m1 | Twisted-a | 85.7 | 178.3 | −73.9 | 179.3 | CTa | 2.0 kJ mol−1 | CTa → CL → CTb |
| Form I m1-inverted | −85.7 | −178.3 | 73.9 | −179.3 | (CTa-i) | 10.3 kJ mol−1, 12.3 kJ mol−1 | |||
| Form I m2 | 74.3 | 176.2 | −65.3 | −176.8 | |||||
| Form I m2-inverted | −74.3 | −176.2 | 65.3 | 176.8 | |||||
| Form I m3 | Twisted-b | 116.8 | 174.0 | 70.3 | 166.3 | CTb | 2.0 kJ mol−1 | CTb → CL → CTa | |
| Form I m3-inverted | −116.8 | −174.0 | −70.3 | −166.3 | (CTb-i) | 10.3 kJ mol−1, 12.3 kJ mol−1 | |||
The –O–/–CH2– difference between the pBOBA and the pPENTYLBA chains mostly affects θ1. θ1 lies close to planarity in the alkoxy chain (0°/180°) whereas is ∼90°/−90° for the alkyl chain. This difference arises entirely from electronic effects due to the O/CH2 change. These θ1 preferences match the respective minima of the gas/solvent potential energy surfaces28 (PES) for both compounds as well as the conformational preferences found in the CSD29 (see ESI S1†).
With regards to torsions θ2–θ4, these define the linear versus twisted overall shape of the chains. In both systems, θ2 and θ4 always lie around 180° and the conformational differences are observed around θ3 (Table 1). For pBOBA, a linear (CL) and a twisted (CT) conformations are observed whereas for pPENTYLBA two inequivalent twisted conformations are found (CTa and CTb) but a linear conformation is not (see Fig. S1.3 †). The relative energies of the gas-phase optimised conformers originating from those crystal conformations were calculated to be very similar, lying around 2 kJ mol−1 from each other (M06/6-31+G**) and the energy barriers for their interconversion to lie around ∼13 kJ mol−1 (typical of alkyl chains). These energies remained virtually the same when the calculations were repeated using an implicit (SMD) solvation model for toluene and isopropanol (IPA) at the same level of theory. Potential energy surfaces28 together with Mogul searches29 are presented in the S1† for all torsions.
As discussed above, pBOBA and pPENTYLBA may exist in solution in 54 and 81 stable conformers respectively, four of which are found in their crystal structures. If we consider the attachment of molecules to a growing nucleus, then the central conformational issue concerns a molecule arriving at the nucleus in the wrong conformation and whether or not its conversion to the right conformer might be rate determining. To make progress with this question it is essential to obtain some rate data for the nucleation process and this is described in the next sections. Subsequently, consideration is then given to the implication of conformational issues in the nucleation of these two flexible molecules in comparison to the more rigid pTA and BA.
Solubilities
Because we are dealing here with molecules of significantly different sizes (122 < MW < 202) it is important that their differing solubilities be taken into account in the interpretation of subsequent kinetic data (see later). Fig. 2 thus provides the comparative solubilities of the four benzoic acids measured at 20 °C (see S2 and Table S2.1† for full details). The extremely high solubility of pPENTYLBA in IPA (not measured precisely but estimated to be at least five times that in toluene) meant that solute crowning (the deposition of crystals around the solution meniscus) prevented determination of nucleation rates from induction time experiments in this solvent.30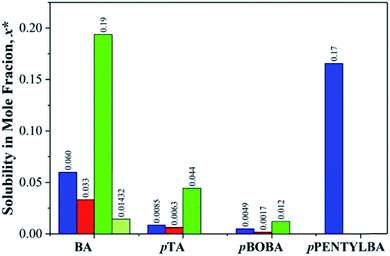 | ||
| Fig. 2 Comparative solubilities of the four substituted benzoic acids (mole fraction) measured at 20 °C in toluene (blue), acetonitrile (red), IPA (green) and IPA/water (light green). See Table S2.1† for full data. | ||
Nucleation kinetics
Nucleation kinetics were determined using the induction time method of terHorst and Jiang20 together with the experimental and analysis methodology of Xiao et al.30 Briefly, measurements were made using a Crystal16 multiple reactor (Technobis Crystallization Systems) in volumes of 1.5 ml and with ∼80 repeats for each supersaturation used. Nucleation rates were derived from the measured cumulative induction time probability distributions (see Fig. S3.1† for typical induction time probability data), assuming that each reactor behaves independently so that the probability of nucleus formation is governed by the Poisson Distribution.30 In this way we obtained nucleation rate data (nucleation rate, J vs. supersaturation, S) for pBOBA and pPENTYLBA in toluene and IPA at 20 °C which may be compared with our previously25,30 reported data for BA and pTA. We have used Classical Nucleation Theory (CNT), eqn (1), to fit the data and provide values of A and B, the kinetic and thermodynamic factors related to the rate of molecular attachment to the nucleus and the concentration of nuclei respectively19 (see S3.2† for analytical expressions). Following our previous conclusions, and unless otherwise stated, data fitting has been performed using the linearised form of eqn (1) (i.e. A and B were retrieved from plots of ln![[thin space (1/6-em)]](https://www.rsc.org/images/entities/char_2009.gif) J/S vs. 1/ln
J/S vs. 1/ln![[thin space (1/6-em)]](https://www.rsc.org/images/entities/char_2009.gif) 2S, Fig. S3.3 and 3.4†) rather than direct non-linear fitting. It is worth commenting that the varying metastability of the solutions leads to quite different accessible supersaturation ranges for each material. This is particularly restrictive in the case of pPENTYLBA leading to a limited dataset (full results and CNT fits given in S3†).
2S, Fig. S3.3 and 3.4†) rather than direct non-linear fitting. It is worth commenting that the varying metastability of the solutions leads to quite different accessible supersaturation ranges for each material. This is particularly restrictive in the case of pPENTYLBA leading to a limited dataset (full results and CNT fits given in S3†). | (1) |
| A = MA′ | (2) |
In order to normalise the impact of solvent dependant solubilities on the molecular attachment frequency for this varied set of acids, we recall that the rate constant A in eqn (1) may be rewritten as eqn (2) where M is the solubility in mol m−3. Fig. 3 then shows the dependence of the rate parameter J/M on supersaturation (S = x/xsat). We note that ‘normalising’ the data to account for solubility differences between systems and solvents also follows from the work of Sun et al. on crystal growth31 and our earlier work on p-aminobenzoic acid.23
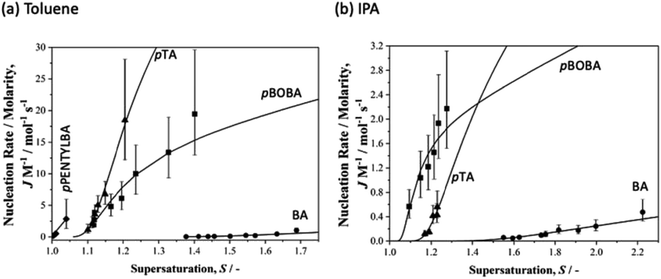 | ||
| Fig. 3 Normalised nucleation rates (J/M) as a function of supersaturation for BA (circles), pTA (triangles), pBOBA (squares) and pPENTYLBA (diamonds) in (a) toluene and (b) isopropanol solutions. Solid lines correspond to the CNT eqn (1) using the fitted values of A and B. | ||
Overall (see also Fig. S3.2†), these data confirm our previous observation25 that rates are considerably slower in IPA than in toluene. Here we reiterate our previous conclusions25 that formation of H-bonded dimers cannot be the rate-determining step since in a particular solvent the H-bond energies change very little from solute to solute (Table S4.1†) while the nucleation rates (J/M), at a particular supersaturation, change significantly. From Fig. 3a it is clear that in toluene BA nucleates the slowest and pPENTYLBA the fastest. The relative kinetic order of pTA and pBOBA appears to switch at low supersaturations between toluene and IPA. In toluene pPBOBA is clearly slower than pTA while the situation in IPA is less certain with the extrapolated J/M vs. S curves crossing over around S = 1.4. A large contributing factor in this uncertainty is the restricted supersaturation range available for studying pTA in IPA. Thus in toluene the relative order is pPENTYLBA > pTA > pBOBA > BA while in IPA it is pBOBA ∼ pTA > BA. Further, we estimated the overall activation energy for the nucleation of pBOBA using additional data measured at 40 °C (see Fig. S3. 2d†) and assuming the rate constant A′ to have an Arrhenius temperature dependence. This gave a value of 74 kJ mol−1, which compares well with Dunning and Shipman's value of 67 kJ mol−1 for sucrose in water.21
Fitted CNT parameters (see Table S3.3†) and the interfacial tension, γ, were tested for potential correlations with solution phase properties such as solubility, standard molar dissolution enthalpy (estimated from van't Hoff solubility plots) and solvent dielectric constant. From these (see Fig. S3.5†) it is evident that no correlation exists between any of these parameters supporting our earlier findings25 that relative rates are not linked to any macroscopic feature of the solution chemistry.
Given this situation, and following our previous approach,25 we used values of S1 as an alternative means of comparing rates across systems and solvents. Here S1 is defined (Fig. S3.6†) as the value of supersaturation at which J/M attains a value of 1 M−1 s−1. In previous work we used S200, however this is no longer appropriate with rates compared as J/M since such S values fall well outside the measured range. Fig. 4 then shows the relationship between this rate parameter, the values of γ derived from B (eqn 1, S3.2 and Table S3.3†) and the calculated lattice energies (Elatt).25 Here we find clear correlations in both cases: larger γ values are associated with higher values of S1 needed to initiate nucleation (Fig. 4a) and more negative Elatt (increasing structural stability) leading to smaller values of S1 (Fig. 4b), being easier to nucleate. (nb we note that in both correlations, BA in IPA/water appears to be anomalous, a feature which we attribute to the uncertainty in estimating S1 for this system: as Fig. 3b shows the BA-IP/water data are unique in extending only as far as JM−1 ∼ 0.5 so that significant extrapolation is required to reach S1 as seen in Fig. S3.6b†). Taken together, these correlations indicate that the nucleation rates of these 4 molecules are dominated by solid-state features (related to both the bulk and the surface stabilities) and not solution chemistry. Whilst the lattice energy (bulk stability) is independent of the solvent, the crystal/solution interfacial tension, γ, is not (systems with lower lattice energies also have lower surface energies).
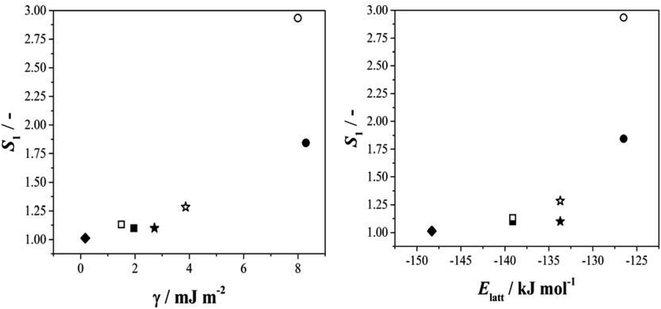 | ||
| Fig. 4 The relationship between S1 and the interfacial energy (γ) (left hand side) and the lattice energy (right hand side) for BA (circles), pTA (triangles), pBOBA (squares) and pPENTYL (diamonds). The filled and empty symbols refer to the solvents toluene and isopropanol (IPA/water in the case of BA), respectively. (nb The BA – IPA/water data point was derived using nonlinear fitting – see Fig. S3.6b†). | ||
Armed with these specific kinetic data we can now equate the qualitative notions of ‘tendency to crystallise’ or ‘crystallizability’ precisely with relative nucleation rates: increasing nucleation rates are equivalent to molecules having higher tendencies to crystallize. Taking as an example the toluene data of Fig. 3 we can say that the crystallisation tendency follows the order pPENTYLBA > pTA > pBOBA > BA strongly suggesting that conformational flexibility alone does not limit ‘crystallizability’ since, for example, pPENTYLBA has more rotatable bonds than either pTA or BA and yet is the fastest nucleator. This conclusion is confirmed by the conformational analysis above: in both pPENTYLBA and pBOBA the conversion between conformers involves crossing energy barriers of about 13 kJ mol−1 (ie ∼ 5RT). Typical conformational exchange rates for these chains calculated by molecular dynamics32,33 suggest that such a barrier is easily crossed and that it is unlikely to limit the interconversion. Indeed our estimated value of the overall activation energy for nucleation of pBOBA (74 kJ mol−1) being 5 times higher than the conformational energy barriers confirms that conformational change cannot be rate determining. Similarly it appears that in this case the differing numbers of molecules in the asymmetric units are also unlikely to be related to some early feature of the nucleation process since in this case pPENTYLBA and pBOBA with Z′ = 3 and 2 respectively both nucleate faster than BA with Z′ = 1.
Crystal structures, conformational issues and kinetics
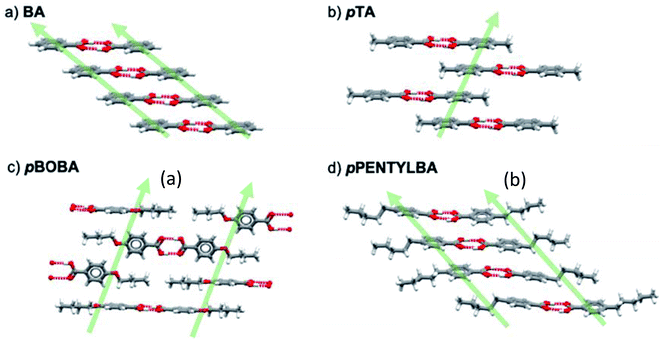
Having ruled out conformational issues and Z′ as being rate determining we now wish to explore further the underlying determinant of the observed relative nucleation rates. The potential importance of solid state features has been shown in Fig. 4 and so following our previous methodology25 we interrogated the crystal packing of the molecules in further detail. Fig. 5 shows the various packing of the four acids studied here. All of them form stable H-bonded carboxylic acid dimers which then stack infinitely in the solid state in varying geometries. In BA, the aromatic rings stack “face to face” by translation (Fig. 5a) whilst in pTA they stack “face to face” through inversion symmetry (Fig. 5b). In pBOBA and pPENTLYBA, the length of the chains in the para position are considerable and thus also involved in stabilising the infinite stacks which are more complex. In pBOBA and pPENTLYBA, the rings are variously interpenetrated by the substituent chains creating less obvious continuous dispersive interactions which involve “ring to ring” as well as “chain to chain” and “ring to chain” stacks occurring either through “face to face” or “edge to face” geometries (see S4† for details). Briefly, pBOBA uses “ring to chain” stacks in both “face to face” and “edge to face” orientations to build the infinite dispersive chains (Fig. 5c).34 In pPENTYLBA, stacks are all “face to face” but there is a mixture of “ring to ring”, “chain to chain” and “chain to ring” (Fig. 5d). The structures and interactions building the continuous dispersive bonds are further described in the S4.†Both solvent dependent H-bond dimerization energies (Edim,HB) and the non-polar dispersive dimer energies (Edim,stack) were therefore calculated so that their impact in determining rates could be assessed. For BA and pTA these data have been reported previously25 and are reprised here (Table S4.1†) together with the new calculations for pBOBA and pPENTYLBA. The computational procedure is explained in detail in S4.3.† Briefly, crystal structures of the acids were optimised using periodic PBE-d (VASP). Dimers were then built from the optimised crystal structures and a single point calculation of the dimer energies performed. The dimerization energy was calculated as the difference between the dimer energy and twice the energy of the optimised monomer using the same model. The dimer and monomer energies were calculated in the gas-phase and in solution using an implicit solvation model.
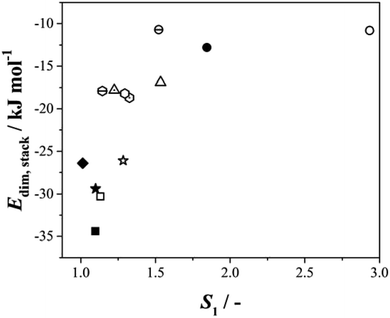
It is evident (Table S4.1†) that within this series of structures, and for a given solvent, the H-bonded dimer energies remain essentially constant (e.g. −78.6 and to 78.5 kJ mol−1 respectively for BA and pPENTYL in toluene and −57.8 and −58.2 kJ mol−1 in IPA), reinforcing our previous conclusion that H-bond dimer formation is not rate determining in the nucleation of these benzoic acids. The stacking/dispersive energies tend to be larger for pBOBA and pPENTYLBA than BA and pTA as expected since they are larger molecules with more atoms involved. To test the overall importance of the dimer stacking energies in determining the relative nucleation rates, Fig. 6 combines all our data on six para substituted carboxylic acids,25, (BA and para amino-, nitro-, toluic-, butoxy-, pentyl benzoic acids) nucleating in various solvents, in a plot of Edim,stackversus S1. In the cases of pBOBA and pPENTYLBA where there is no unique value of this stacking energy, we have used the smallest of the computed values (i.e. the weakest interaction). There is a strong correlation, with more stabilising interactions requiring lower values of S1. This confirms the central importance of stacking interactions25 in the nucleation process and reminds us that the creation of an acid H-bonded dimer is not a good way to build a crystal since it does not offer infinite, periodic, interactions, which in these cases are afforded by ring–ring and other dispersive contacts.
Nucleation–growth rates correlation
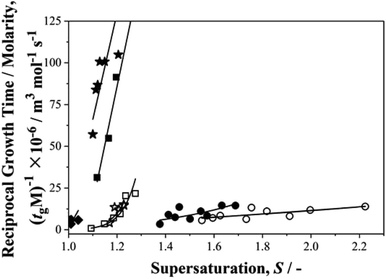
Finally, we return to the question of the correlation between growth and nucleation rates revealed in our previous work on p-aminobenzoic acid.35 We were keen to find out if such a correlation, never before reported, is a general phenomenon. In these nucleation experiments although we do not measure growth rates, per se, we do determine growth times, tg,27 – the time taken for a nucleus to grow to a size at which it may be detected. The inverse of such growth times normalised to solubilities, (1/tgM), may then be used as a measure of relative growth rates and Fig. 7 shows this parameter plotted as a function of supersaturation for the current data set. From this we see that for growth rates, pPENTYLBA > pTA > pPBOBA > BA in toluene while pPBOBA ≥ pTA > BA in IPA. In both solvents, these orders follow precisely those of the relative nucleation rates, J/M, again suggesting a correlation between nucleation and growth.Conclusions
This work has clarified and explored a number of important issues and provided a general framework with which to consider conformational flexibility in the context of crystallization processes. Beyond the computational aspects of the study, we have also highlighted the importance of normalizing rate data when comparing the behavior of materials with very different solubilities. In a general sense it has shown that current experimental techniques do make it possible to move beyond ill-defined terms and qualitative measures such as ‘crystallizability’ or ‘tendency to crystallize’ in favour of more precise measures of relative nucleation kinetics. For the series of molecularly and structurally related molecules studied here our methodology shows that increased conformational flexibility (as in increased number of rotatable bonds) does not, on its own, control their relative rates of nucleation. On the contrary, amongst this series of para substituted benzoic acids we find that rates (and crystallizability) are dominated by other solid-state features, notably continuous dispersive and stacking interactions. We may conclude that just because a molecule possesses many rotatable bonds, and as a consequence has multiple molecules in its crystallographic asymmetric unit, does not mean that conformation will dominate its ability to nucleate and crystallize. Indeed, conformational change is only one of the many activated processes that contribute to and control the kinetics of crystallization and its relative weight in the whole process will change depending on the system.We know from notorious cases of conformational polymorphism that the nature of rotatable bonds is much more important4 than their number. Ritonavir, for example, presents a very different situation to our systems. In contrast to low conformational energy barriers of ∼13 kJ mol−1 as in our benzoic acids, in Ritonavir the rotation of the carbamate bond to yield the metastable conformer is central to the formation of the stable form and has a conformational energy barrier36 of over 100 kJ mol−1. When these conformational energy barriers are compared to typical activation energies for nucleation (∼70 kJ mol−1), it becomes clear that the former would have no impact on the rate whilst the latter would indeed control the kinetics of nucleation of such a form. Thus, it is the nature and not the number of rotatable bonds that matters. Finally, we comment on our further evidence of the correlation between nucleation and growth rates: in the wider context of the experimental realisation of crystal structure prediction outputs this is an important general finding since while nucleation rates of different crystal structures cannot be predicted, growth rates can.25,37
Conflicts of interest
There are no conflicts of interest to declare.Acknowledgements
Acknowledgements. SKT thanks Pfizer, UK for the provision of a studentship and Dr K. Back of Pfizer, UK for helpful discussion. RJD thanks Prof. J. terHorst, University of Strathclyde for helpful discussions.References
- R. J. Davey and J. Garside, From molecules to crystallizers – an introduction to crystallisation, Oxford University Press, Oxford, 2000 Search PubMed.
- M. J. Bryant, S. N. Black, H. Blade, R. Docherty, A. G. P. Maloney and S. C. Taylor, The CSD Drug Subset: The Changing Chemistry and Crystallography of Small Molecule Pharmaceuticals, J. Pharm. Sci., 2019, 108, 1655–1662 CrossRef CAS.
- J. Bauer, S. Spanton, R. Henry, J. Quick, W. Dziki, W. Porter and J. Morris, Ritonavir: An Extraordinary Example of Conformational Polymorphism, Pharm. Res., 2001, 18, 859–866 CrossRef CAS.
- A. J. Cruz-Cabeza and J. Bernstein, Conformational Polymorphism, Chem. Rev., 2014, 114, 2170–2191 CrossRef CAS.
- L. Yu, S. M. Reutzel-Edens and C. A. Mitchell, Crystallization and Polymorphism of Conformationally Flexible Molecules: Problems, Patterns, and Strategies, Org. Process Res. Dev., 2000, 4, 396–402 CrossRef CAS.
- J. G. P. Wicker and R. I. Cooper, Will it crystallise? Predicting crystallinity of molecular materials, CrystEngComm, 2015, 17, 1927–1934 RSC.
- T. D. Turner, D. M. C. Corzo, D. Toroz, A. Curtis, M. M. Dos SantosR, B. Hammond, X. Lai and K. J. Roberts, The influence of solution environment on the nucleation kinetics and crystallisability of ara-aminobenzoic acid, Phys. Chem. Chem. Phys., 2016, 18, 27507–27520 RSC.
- B. C. Hancock, Predicting the Crystallization Propensity of Drug-Like Molecules, J. Pharm. Sci., 2017, 106, 28–30 CrossRef CAS.
- J. A. Baird, B. van Eerdenbrugh and L. S. Taylor, A Classification System to Assess the Crystallization Tendency of Organic Molecules from Undercooled Melts, J. Pharm. Sci., 2010, 99, 3787–3806 CrossRef CAS.
- L. Derdour, S. K. Pack, D. Skliar, C. J. Lai and S. Kiang, Crystallization from solutions containing multiple conformers: a new modeling approach for solubility and supersaturation, Chem. Eng. Sci., 2011, 66, 88–102 CrossRef CAS.
- L. Derdour and D. Skliar, Crystallization from Solutions Containing Multiple Conformers. 1. Modeling of Crystal Growth and Supersaturation, Cryst. Growth Des., 2012, 12, 5180–5187 CrossRef CAS.
- L. Derdour, C. Sivakumar, D. Skliar, S. K. Pack, C. J. Lai, J. P. Vernille and S. Kiang, Crystallization from Solutions Containing Multiple Conformers. 2. Experimental Study and Model Validation, Cryst. Growth Des., 2012, 12, 5188–5196 CrossRef CAS.
- T. L. Threlfall, R. W. De'Ath and S. J. Coles, Metastable Zone Widths, Conformational Multiplicity, and Seeding, Org. Process Res. Dev., 2013, 17, 578–584 CrossRef CAS.
- K. M. Steed and J. W. Steed, Packing Problems: High Z Crystal Structures and Their Relationship to Cocrystals, Inclusion Compounds, and Polymorphism, Chem. Rev., 2015, 115, 2895–2933 CrossRef CAS.
- J. W. Steed, Should solid-state molecular packing have to obey the rules of crystallographic symmetry?, CrystEngComm, 2003, 5, 169 RSC.
- G. R. Desiraju, On the presence of multiple molecules in the crystal asymmetric unit (Z′ > 1), CrystEngComm, 2007, 9, 91–92 RSC.
- G. R. Desiraju, K. M. Anderson and J. W. Steed, Comment on “On the presence of multiple molecules in the crystal asymmetric unit (Z′ > 1)”, CrystEngComm, 2007, 9, 91 RSC.
- W. Du, A. J. Cruz-Cabeza, S. Woutersen, R. J. Davey and Q. Yina, Can the study of self-assembly in solution lead to a good model for the nucleation pathway? The case of tolfenamic acid, Chem. Sci., 2015, 6, 3515–3524 RSC.
- R. J. Davey, S. M. L. Schroeder and J. H. ter Horst, Nucleation of Organic Crystals – A Molecular Perspective, Angew. Chem., Int. Ed., 2013, 52, 2166–2179 CrossRef CAS.
- S. Jiang and J. H. ter Horst, Crystal Nucleation Rates from Probability Distributions of Induction Times, Cryst. Growth Des., 2011, 11, 256−–261 CrossRef CAS.
- R. J. Davey, K. R. Back and R. A. Sullivan, Crystal nucleation from solutions – transition states, rate determining steps and complexity, Faraday Discuss., 2015, 179, 9–26 RSC.
- S. Parveen, R. J. Davey, G. Dent and R. G. Pritchard, Linking solution chemistry to crystal nucleation: the case of tetrolic acid, Chem. Commun., 2005, 1531–1533 RSC.
- R. A. Sullivan, R. J. Davey, G. Sadiq, G. Dent, K. R. Back, J. H. ter Horst, D. Toroz and R. B. Hammond, Revealing the Roles of Desolvation and Molecular Self-Assembly in Crystal Nucleation from Solution: Benzoic and p-Aminobenzoic Acids, Cryst. Growth Des., 2014, 14, 2689–2696 CrossRef CAS.
- R. C. Burton, E. S. Ferrari, R. J. Davey, J. L. Finney and D. T. Bowron, The Relationship between Solution Structure and Crystal Nucleation: A Neutron Scattering Study of Supersaturated Methanolic Solutions of Benzoic Acid, J. Phys. Chem. B, 2010, 114, 8807–8816 CrossRef CAS.
- A. J. Cruz-Cabeza, R. J. Davey, S. S. Sachithananthan, R. Smith, S. K. Tang, T. Vetter and Y. Xiao, Aromatic stacking – a key step in nucleation, Chem. Commun., 2017, 53, 7905–7908 RSC.
- Y. Liu, S. Xu, X. Zhang, W. Tang and J. Gong, Unveiling the Critical Roles of Aromatic Interactions in the Crystal Nucleation Pathway of Flufenamic Acid, Cryst. Growth Des., 2019, 19, 7175–7184 CrossRef CAS.
- For pPENTYLBA CCDC/Deposition number is 2003448..
- Avogadro: an open-source molecular builder and visualization tool. Version 1.2.0, http://avogadro.cc/, see also ESI S1†.
- I. J. Bruno, J. C. Cole, M. Kessler, J. Luo, W. D. S. Motherwell, L. H. Purkis, B. R. Smith, R. Taylor, R. I. Cooper, S. E. Harris and A. G. Orpen, Retrieval of Crystallographically-Derived Molecular Geometry Information, J. Chem. Inf. Comput. Sci., 2004, 44, 2133–2144 CrossRef CAS.
- Y. Xiao, S. K. Tang, H. Hao, R. J. Davey and T. Vetter, Quantifying the Inherent Uncertainty Associated with Nucleation Rates Estimated from Induction Time Data Measured in Small Volumes, Cryst. Growth Des., 2017, 17, 2852–2863 CrossRef CAS.
- Y. Sun, C. J. Tilbury, S. M. Reutzel-Edens, R. M. Bhardwaj, J. Li and M. F. Doherty, Modeling Olanzapine Solution Growth Morphologies, Cryst. Growth Des., 2018, 18, 905–911 CrossRef CAS.
- R. Tobias, A. G. Csaszar, L. Gyevi-Nagy and G. Tasi, Definitive Thermochemistry and Kinetics of the Interconversions among Conformers of n-Butane and n-Pentane, J. Comput. Chem., 2018, 39, 424–437 CrossRef CAS.
- V. Marinova, G. P. F. Wood, I. Marziano and M. Salvalaglio, Dynamics and Thermodynamics of Ibuprofen Conformational Isomerism at the Crystal/Solution Interface, J. Chem. Theory Comput., 2018, 14, 6484–6494 CrossRef CAS.
- S. K. Tang, The Directed Assembly of Materials – Crystal Growth and Nucleation of Substituted Benzoic Acids', PhD thesis submitted to The University of Manchester, 2019.
- J. F. B. Black, P. T. Cardew, A. J. Cruz-Cabeza, R. J. Davey, S. E. Gilks and R. A. Sullivan, Crystal nucleation and growth in a polymorphic system: Ostwald's rule, p-aminobenzoic acid and nucleation transition states, CrystEngComm, 2018, 20, 768–776 RSC.
- D. Chakraborty, N. Sengupta and D. J. Wales, Conformational Energy Landscape of the Ritonavir Molecule, J. Phys. Chem. B, 2016, 120, 4331–4340 CrossRef CAS.
- R. Montis, R. J. Davey, S. E. Wright, G. R. Woollam and A. J. Cruz-Cabeza, Transforming Computed Energy Landscapes into Experimental Realities – the Role of Structural Rugosity, Angew. Chem., Int. Ed., 2020, 59, 20357–20360 CrossRef CAS.
Footnote |
| † Electronic supplementary information (ESI) available. See DOI: 10.1039/d0sc05424k |
| This journal is © The Royal Society of Chemistry 2021 |

