 Open Access Article
In situ generation of exfoliated graphene layers on recycled graphite rods for enhanced capacitive performance of Ni–Co binary hydroxide
Ahmed M. Abdelrahim†
 ,
Muhammad G. Abd El-Moghny†
 * and
Mohamed S. El-Deab
 *
*
Department of Chemistry, Faculty of Science, Cairo University, Cairo, Egypt. E-mail: gmohamd@sci.cu.edu.eg; msaada68@yahoo.com
First published on 1st August 2021
Abstract
A functionalized exfoliated graphite rod (FEGR), with a high surface area, is produced for use as a promising substrate for supercapacitors, via controlled oxidative treatment of a recycled graphite rod of exhausted zinc–carbon batteries. SEM, EDX, XPS, FT-IR, Raman, and contact angle measurements are carried out to disclose the surface characteristics of the FEGR. The surface of the FEGR is characterized by in situ generated grooves, together with graphene layers which are directly attached to the underlying graphite base. The FEGR electrodes enhance the capacitive performance of Ni(OH)2 and binary Ni–Co(OH)2. The Ni–Co(OH)2/FEGR electrode displays a superb specific capacity value (2552.6 C g−1) at a current density of 5 A g−1 and this value is retained to 70.8% at a high current density of 50 A g−1 indicating the outstanding rate performance of this electrode material. This enhanced behavior is attributed to the facile interaction of electrolyte species, even at high current density, with the active sites of the redox catalyst layer (distributed over a larger fraction of the underlying substrate with enhanced hydrophilicity). Moreover, the excellent electrical conductivity of the in situ surface generated graphene layers is another promoting factor.
1. Introduction
Nowadays, energy storage technology has attracted great attention in research due to the increase of various renewable energy sources in the world to cover the rapid decrease in fossil fuels. Also, increasing the development in many applications e.g., mobile phones, energy recovery systems, electric vehicles and electric tramcar, energy harvesting, and uninterruptible power supply requires efficient energy storage devices.1–5Supercapacitors (SCs) are among the most efficient energy storage devices. Recently, SCs have received considerable attention for storing energy due to their unique advantages such as high-power density, fast charge–discharge rate, long–life cycles, and being eco-friendly.6,7
SCs storage mechanisms can be classified into two main types according to the main nature of the electrode material; non-faradic and faradic electrodes. Also, they can be categorized into four types (electrochemical double-layer capacitors (EDLCs), pseudocapacitive, battery, and recently intercalation pseudocapacitive electrodes) according to the main nature of the electrode material, potential evaluation profile during charge and discharge, and the reversibility of the electrode material.8–10 The EDLCs store energy through the accumulation of the electrolyte ions on the accessible surface area of electrode materials via electrostatic attraction. Unfortunately, this type of electrode material has a low energy density which is used only in the low energy applications.8 So, the research is directed to investigate the battery type electrode in SCs devices which stores energy chemically via faradaic reactions that take place at the electrode material at characteristic potentials giving higher energy density than EDLCs electrode materials.8,10,11
Interestingly, Ni(OH)2 is one of the most investigated battery-type materials in the SCs devices due to their inspired properties; high theoretical specific capacity (C) (1728 C g−1), being environmentally friendly, natural abundance, and low cost which make it available for commercialization.12–14 It is worth noting that Ni(OH)2 has two polymorphic crystal structures, α-Ni(OH)2 phase with hydrotalcite-like structure and β-Ni(OH)2 with brucite-like structure (see Scheme 1). The former has a higher capacitive performance than the latter because of α-Ni(OH)2 has a higher d-spacing value with the turbostratically crystallized structure which facilitates the diffusion of electrolyte inside the hydroxide layers and utilize almost active materials with a higher rate than β-Ni(OH)2. So, α-Ni(OH)2 has a higher C value, rate capability, and power density.15,16 Besides, the energy resulting from the conversion of α-Ni(OH)2 to γ-NiOOH during the charging process is greater than that resulting from the conversion of β-Ni(OH)2 to β-NiOOH. This is due to the difference between the average oxidation state between γ-NiOOH (+3.67) and α-Ni(OH)2 (+2.25) compared with the difference from β-NiOOH (+2.9) to β-Ni(OH)2 (+2.25).15,17 Despite the high theoretical C and high capacitive properties of Ni(OH)2, these properties cannot be achieved practically due to its low electrical conductivity (∼10−17 S cm−1) and low ionic conductivity.14,18,19 Also, Ni(OH)2 has low structure stability in alkaline media due to mechanical stresses during cycling.17,18 So, researchers directed their efforts to discover strategies to overcome these obstacles. One of these strategies is to develop a bimetallic structure by substituting Ni with some metals such as Al, Zn, Mn, and Co.15,20 Importantly, Ni–Co bimetallic hydroxides are among the well-known binary hydroxides in SCs field. Ni and Co atoms have a very close ionic size which enables their easy substitution during the synthesizing process of the binary hydroxide.21–25
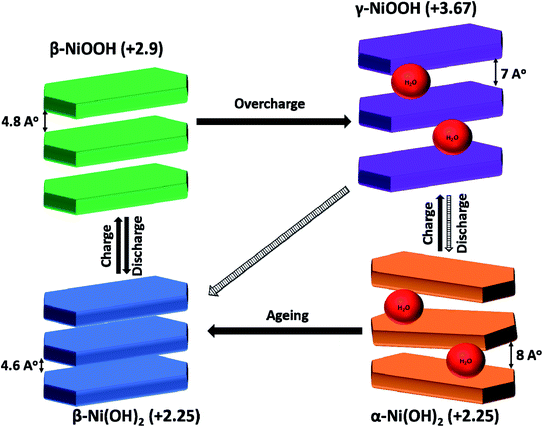 | ||
| Scheme 1 Schematic illustration of Ni(OH)2/NiOOH phase transformation (Bode diagram).42 | ||
The coexistence of cobalt in the crystal lattice of Ni(OH)2 displayed many advantages. Firstly, the total electronic conductivity of Ni–Co binary hydroxide is increased which in turn increases the C and rate capability.8,26,27 Jian Wu et al.28 demonstrated that the incorporation of Co into Ni lattice decreases the band gap between valence and conduction band by quantum calculations using density functional theory. The four prepared samples Ni(OH)2, Co0.33Ni0.77(OH)2, Co0.5Ni0.5(OH)2, and Co0.77Ni0.33(OH)2 displayed band gap 3.43 eV, 3.13 eV, 3.06 eV, and 3.01 eV, respectively.28
Secondly, the binary hydroxides had higher structural stability than individual hydroxides due to Co metal preventing mechanical failure of Ni(OH)2 during cycling by two approaches. The first approach is enhancing the stability of β-Ni(OH)2 by arresting the formation of γ-NiOOH from β-NiOOH by lowering the oxidation potential which prevents the overcharging of β-NiOOH to γ-NiOOH.20,29 The second approach is improving the stability of α-Ni(OH)2 by inhibiting the transformation of γ-NiOOH to β-Ni(OH)2 during the discharge process.15,23
On the other hand, the co-existence of Co into Ni(OH)2 crystal lattice changes the morphology of electrode material that results in reinforcing the kinetics of the electrode. Firstly, by increasing the rate of diffusion of electrolyte ions inside the active materials due to the unique nano-porous structure that results by mixing two metals during the preparation process such as nanosheets,30 nanoarrays,31 flower-like morphology.32 Secondly, by decreasing the charge transfer resistance of Ni(OH)2.33 But, the kinetics of the binary hydroxide is still far enough than EDLCs electrode materials. So, the research efforts are directed to investigate the substrate materials which are characterized by high electrical conductivity to overcome this problem.34
Among various substrate materials, graphene is considered as the pioneer support for the redox-active materials due to its ultra-high electrical conductivity, very high charge carrier mobility (∼200![[thin space (1/6-em)]](https://www.rsc.org/images/entities/char_2009.gif) 000 cm2 V−1 s−1), and huge gravimetric surface area (∼2600 m2 g−1).35,36 So by incorporation of the active materials (e.g. metal hydroxide or oxide) on the graphene layers, the kinetics and the capacitive performance of the electrode is boosted largely due to: (i) the active materials become accessible to interact with the electrolyte ions because of the uniform distributions of the active materials on the huge surface area of graphene, (i.e. decreasing of ionic diffusion pathways), and (ii) decreasing the electronic pathways.37 Also, graphene can be produced via many synthetic methods, e.g. micromechanical exfoliation, thermal decomposition of SiC, chemical vapor deposition (CVD), chemical exfoliation, and electrochemical exfoliation.35 Electrochemical partial exfoliation is considered the best method due to the following characteristics: (a) it is an available method that carried out in one simple step without using harsh materials,38,39 (b) it is a controllable method because the degree of oxidation can be controlled by oxidation potential or current, time of oxidation, and type and concentration of the electrolyte,40 (c) it is a low cost and eco-friendly method,39 (d) it is a binder-free method due to the partially exfoliated graphite is consisting of two layers. While the bottom layer is composed of the electrically conductive graphite which serves as a current collector, the upper layer is formed of the functionalized graphene sheets as active material,37 (e) the resulting three dimensional (3D) highly conductive material with a very high surface-functionalized area possesses a high specific capacitance (Cs) due to ease interaction between the electrolyte and active material,41 and (f) the highly electrical 3D conductive network can be used as a support to accommodate the redox-active materials to enhance the electrical conductivity of redox materials.37
000 cm2 V−1 s−1), and huge gravimetric surface area (∼2600 m2 g−1).35,36 So by incorporation of the active materials (e.g. metal hydroxide or oxide) on the graphene layers, the kinetics and the capacitive performance of the electrode is boosted largely due to: (i) the active materials become accessible to interact with the electrolyte ions because of the uniform distributions of the active materials on the huge surface area of graphene, (i.e. decreasing of ionic diffusion pathways), and (ii) decreasing the electronic pathways.37 Also, graphene can be produced via many synthetic methods, e.g. micromechanical exfoliation, thermal decomposition of SiC, chemical vapor deposition (CVD), chemical exfoliation, and electrochemical exfoliation.35 Electrochemical partial exfoliation is considered the best method due to the following characteristics: (a) it is an available method that carried out in one simple step without using harsh materials,38,39 (b) it is a controllable method because the degree of oxidation can be controlled by oxidation potential or current, time of oxidation, and type and concentration of the electrolyte,40 (c) it is a low cost and eco-friendly method,39 (d) it is a binder-free method due to the partially exfoliated graphite is consisting of two layers. While the bottom layer is composed of the electrically conductive graphite which serves as a current collector, the upper layer is formed of the functionalized graphene sheets as active material,37 (e) the resulting three dimensional (3D) highly conductive material with a very high surface-functionalized area possesses a high specific capacitance (Cs) due to ease interaction between the electrolyte and active material,41 and (f) the highly electrical 3D conductive network can be used as a support to accommodate the redox-active materials to enhance the electrical conductivity of redox materials.37
The objective of this study is to synthesize the graphene layers as a support material for the Ni–Co(OH)2 from the low-cost carbon source (exhausted zinc–carbon battery rods) with simple, controllable, and eco-friendly methods. Graphene layers are successfully produced from the recycled graphite rod obtained from the exhausted zinc–carbon batteries with a nominal voltage of 1.5 V using a simple oxidation step. The developed binary Ni–Co(OH)2 supported on the functionalized exfoliated graphite rods (FEGR) displays a higher capacitive performance with an ultra-high C reaches to 2552.6 C g−1 at 5 A g−1 that retained to 70.8% at 50 A g−1.
2. Experimental
2.1. Chemicals and electrodes preparation
Recycled graphite rod (RGR) with 4 mm diameter is obtained from the exhausted zinc–carbon batteries with nominal voltage 1.5 V. RGR is cleaned by the following procedure: removing the large residual particles on the surface via mechanical polishing using very smooth emery paper and then is immersed in the boiling distilled water for 3 min with continuous stirring to remove any fine residual particles on its surface.
The functionalized exfoliated graphite rod (FEGR) is prepared in the three-electrode configuration cell [RGR served as a working electrode (immersed length 1 cm), graphite rod and saturated silver electrode (Ag/AgCl/KCl sat.) are used as the counter and reference electrodes, respectively] by a simple electrochemical anodic oxidation step via applying an oxidation potential equal to +2 V and for 10 min in a solution containing 1 M H2SO4.
(ii) Preparation of modified RGR and FEGR electrodes
Two Ni(OH)2 films are prepared, i.e., RGR/Ni(OH)2, and FEGR/Ni(OH)2 by cathodic reduction at deposition potential of −1 V with a controlled amount of charge equal to 200 mC to pass in 20 mM NiSO4 deposition bath using RGR or FEGR, respectively, as a working electrode for the two films. While graphite rod and (Ag/AgCl/KCl sat.) are used as the counter and reference electrodes, respectively. FEGR/Ni–Co(OH)2 film is prepared by using sequential deposition of 100 mC of Co(OH)2 from deposition bath containing [20 mM CoSO4 + 20 mM KIO3] then depositing 100 mC of Ni(OH)2 from 20 mM NiSO4 solution with the same three-electrode configuration cell of the FEGR/Ni(OH)2 film.43
2.2. Material characterization
Surface morphology and chemical composition of the various modified electrodes are examined by field emission scanning electron microscope (FE-SEM, QUANTA FEG 250) coupled with an energy dispersive X-ray spectrometer (EDX) unit. X-ray photoelectron spectroscopy (XPS), using monochromatic X-ray Al K-alpha radiation, Thermo Fisher Scientific. Additionally, the crystalline structures are characterized using X-ray diffraction (XRD) with Cu Kα radiation, STOE STADI. Moreover, surface wettability is probed by contact angle measurements via Attention Biolin Scientific (Version 2.7). While Raman spectra are recorded by LabRAM HR Evolution and are used to follow the degree of the crystallinity of the graphite material before and after the electrochemical exfoliation process. Besides, the Fourier transform infrared (FT-IR) spectra are recorded with an FT-IR spectrometer (Nicolet series 670-FTIR) to investigate the surface functional groups.2.3. Electrochemical measurements
The electrochemical measurements were investigated under a three-electrode cell configuration at room temperature (25 °C ± 1) in 1 M H2SO4 for RGR and FEGR electrodes and 0.5 M NaOH for modified RGR and FEGR electrodes. The cyclic voltammetry (CV), galvanostatic charge–discharge (GCD), and electrochemical impedance spectroscopy (EIS) (at open circuit potential (OCP) from 100 kHz to 10 mHz) measurements are performed using Biologic potentiostat (model VSP-300).The Cs was calculated from the CV and GCD curves using eqn (1) and (2), respectively and C was calculated using eqn (3):
 | (1) |
 | (2) |
 | (3) |
3. Results and discussion
3.1. Modification of the substrate
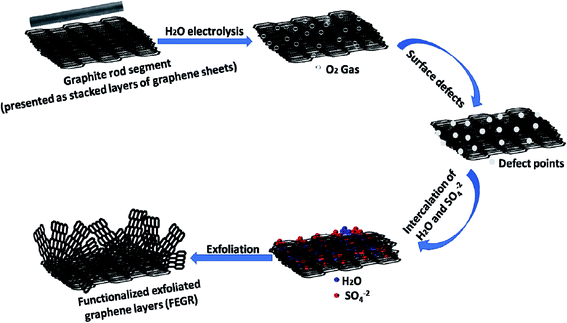
![[double bond, length as m-dash]](https://www.rsc.org/images/entities/char_e001.gif) O), and carboxylic (*COOH) groups as shown in eqn (5)–(7).44,47
O), and carboxylic (*COOH) groups as shown in eqn (5)–(7).44,47| H2O → 2H+ + 2e− + 1/2O2↑ | (4) |
| *C + H2O → *C–OH + H+ + e− | (5) |
*C–OH → *C![[double bond, length as m-dash]](https://www.rsc.org/images/entities/char_e001.gif) O + H+ + e− O + H+ + e−
| (6) |
*C![[double bond, length as m-dash]](https://www.rsc.org/images/entities/char_e001.gif) O + H2O → *COOH + H+ + e− O + H2O → *COOH + H+ + e−
| (7) |
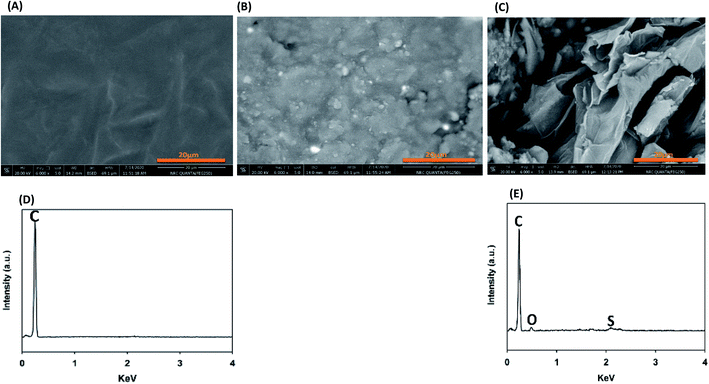 | ||
| Fig. 1 (A–C) SEM images of (A) RGR′ smooth region, (B) RGR′ rough region, and (C) FEGR electrodes. (D and E) EDX analysis of RGR′ smooth region (D) and FEGR (E) electrodes, respectively. | ||
The EDX analysis was performed (see Fig. 1(D and E)) to show the chemical composition of the prepared FEGR and to display the change of oxygen content between RGR and FEGR electrodes due to the inserted functional groups during the electrooxidation. As displayed in Fig. 1D, the chemical composition of RGR is composed mainly of pure graphitic carbon. EDX analysis of FEGR displays a presence of small oxygen peaks (mass percent 14.5%) which indicate the successful insertion of oxygen functional groups on its surface. Also, the presence of the small sulfur peak in the EDX analysis of FEGR is evidence of the intercalation of SO42− anions during the exfoliation of graphene layers.44
Also, XPS was done to investigate the accurate oxygen content and the type of inserted functional groups after the modification. From the XPS survey spectra, as shown in Fig. 2A, there are two main peaks centered around 285 and 532 eV corresponding to carbon and oxygen elements which indicate that the two electrodes are composed only of carbon and oxygen.46,48 By comparing the enlarged view of C 1s peaks of RGR and FEGR that depicted in Fig. 2B, the presence of the broad peak in the FRGR of C 1s is evidence for the successful oxidation and the insertion of more functional groups on the graphite surface which is obviously clear from the deconvolution of FEGR C 1s peak into four peaks which are corresponding to C![[double bond, length as m-dash]](https://www.rsc.org/images/entities/char_e001.gif) C, *C–OH, *C
C, *C–OH, *C![[double bond, length as m-dash]](https://www.rsc.org/images/entities/char_e001.gif) O and *COOH.46–48 Also, the enlarged view of O 1s of both electrodes shown in Fig. 2C displays that the FEGR peak has a higher intensity compared to that of RGR indicating the higher oxygen content on the FEGR electrode surface (7.48%) compared to the RGR surface (4.94%). Also, the deconvolution of O 1s of FEGR indicates the formation of surface functional groups which is consistent with the deconvolution of its C 1s.48–50
O and *COOH.46–48 Also, the enlarged view of O 1s of both electrodes shown in Fig. 2C displays that the FEGR peak has a higher intensity compared to that of RGR indicating the higher oxygen content on the FEGR electrode surface (7.48%) compared to the RGR surface (4.94%). Also, the deconvolution of O 1s of FEGR indicates the formation of surface functional groups which is consistent with the deconvolution of its C 1s.48–50
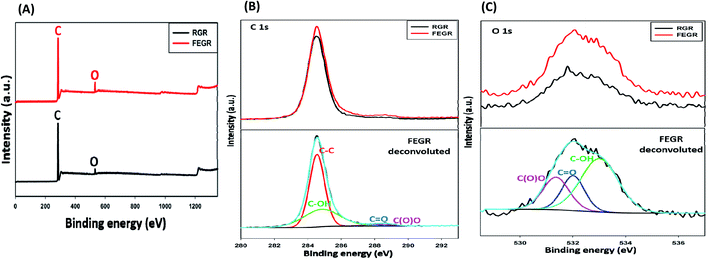 | ||
| Fig. 2 XPS analysis of RGR (black line), and FEGR (red line) electrodes: (A) survey, (B) enlarged view of C 1s, and (C) enlarged view of O 1s. | ||
Further investigation was done to confirm the presence of the functional groups and defects that are introduced to the surface of the FEGR during the electrochemical partial exfoliation using the FT-IR spectra, Raman spectroscopy, and contact angle measurements. Fig. 3A displays the FTIR spectra of the FEGR electrode to further ensure the presence of the functional groups on the surface as depicted from the XPS analysis. While the presence of the peak around 1700 cm−1 indicates the presence of carbonyl group (–C![[double bond, length as m-dash]](https://www.rsc.org/images/entities/char_e001.gif) O), the presence of an unsmooth broad peak started from ∼3370 to 3750 cm−1 refers to the presence of both hydroxyl group (–OH) and carboxylic group (–COOH). Also, (–C
O), the presence of an unsmooth broad peak started from ∼3370 to 3750 cm−1 refers to the presence of both hydroxyl group (–OH) and carboxylic group (–COOH). Also, (–C![[double bond, length as m-dash]](https://www.rsc.org/images/entities/char_e001.gif) C) group stretching was observed at wave number around 1600 cm−1.51 It is clear that FT-IR spectra agree with the deconvoluted peaks in the XPS analysis.
C) group stretching was observed at wave number around 1600 cm−1.51 It is clear that FT-IR spectra agree with the deconvoluted peaks in the XPS analysis.
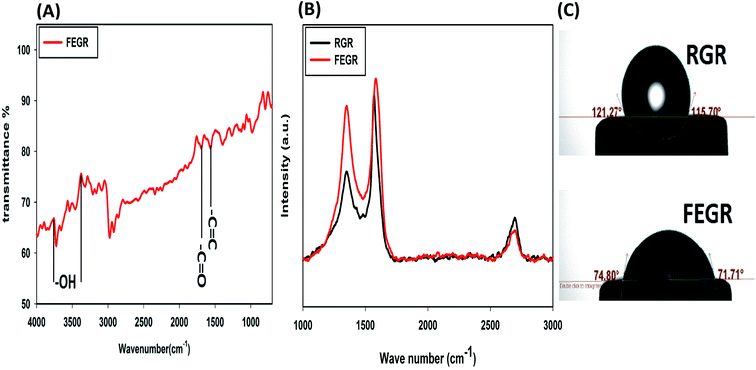 | ||
| Fig. 3 (A) FT-IR spectrum of FEGR electrode. (B) Raman spectra of RGR (black line) and FEGR electrode (red line). (C) Contact angle test for RGR and FEGR electrode. | ||
Moreover, Raman spectra are presented in Fig. 3B for RGR and FEGR electrodes to investigate the change in the crystallinity that happened during the electrochemical exfoliation by comparing the characteristic vibrational mode of carbon materials before and after the oxidation step. Generally, there are three characteristic bands G, 2D, and D bands are observed in Raman spectra at wavenumbers 1586 cm−1, 2696 cm−1, and 1348 cm−1 respectively which are corresponding to the carbonaceous materials. While the G and 2D band are arising due to E2g vibrational mode of the sp2 hybrid graphitic carbon and the double resonance scattering within the crystal lattice of carbon materials, respectively, the D band is related to the presence of the oxygenated, defective, and edged carbon atoms of carbon materials.44,46,50,52,53 Also, the degree of disorder of carbon materials can be noticed from three important factors; band intensity, band shape, and band position. By increasing the intensity ratio ID/IG and decreasing the intensity ratio I2D/IG, the degree of crystallinity is decreased, and the degree of disorder is increased. While the calculated ID/IG value is increased from 0.5454 to 0.8535 corresponding to RGR and FGER electrodes, respectively, the I2D/IG value is decreased from 0.2713 (RGR) to 0.1797 (FEGR). It is clearly obvious from these results that there is an increase in the degree of disorder (roughness) of FEGR electrode due to the inserted functional groups and defects that are generated during the production of graphene on the surface of bulk graphite by electrochemical exfoliation.41,44,46,49,53–55 Also, the more broadening and increase in the wavenumber of G band in FEGR electrode compared to the RGR electrode confirms the more defects formed at the surface of FEGR electrode.52 The decrease of full width at half a maximum of the 2D band of FEGR electrode compared to RGR is a good indication of the successful exfoliation of graphite into graphene layers as obtained from the SEM analysis, see Fig. 1(A–C).55
Finally, the water droplet method was used to investigate the contact and accessibility of electrolyte ions into the surface of FEGR and RGR electrodes. It is clear that FEGR electrode displays good wetting properties than RGR electrode as a consequence of the electrochemical exfoliation step which increases: (i) the roughness of the electrode surface, (ii) the functional groups on the electrode' surface, (iii) the number of graphene layers, and also (iv) the porosity of the electrode material as evidenced from the previous analysis. So, all these factors enhance the contact between electrolyte and the surface of the electrode and also increase the diffusion behavior of electrolyte.37,45 The contact angle of FEGR electrode is smaller than that of RGR electrode as shown in Fig. 3C which indicates the higher hydrophilicity nature of FEGR electrode compared to RGR electrode.
Remarkably, the ideal capacitor is characterized by very fast adsorption–desorption at the electrode surface and this can be demonstrated electrochemically by using eqn (8) which describes the relationship between current (I) at a characteristic potential with potential scan rate (ν).
| I = aνb | (8) |
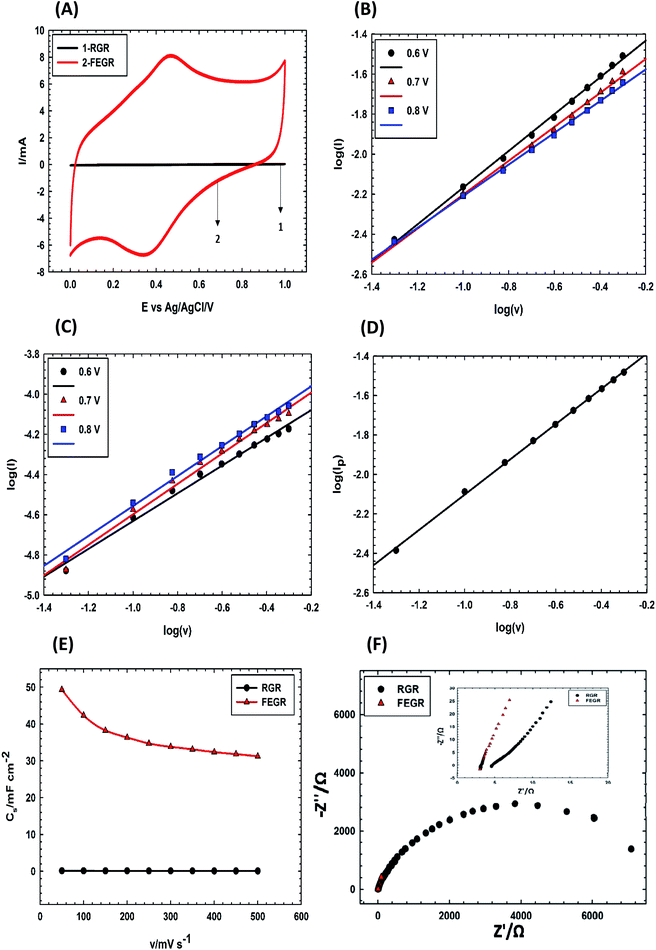
Fig. 4(B and C) describes the electrode kinetics of RGR, and FEGR RGR electrodes, respectively, at three characteristic potentials 0.6, 0.7, and 0.8 V. The b-values of FEGR electrode as observed from Table 1 is higher than that of RGR electrode at any potential which indicates that FEGR electrode has higher kinetics behavior than RGR electrode. This can be attributed to the following reasons: (i) the fast diffusion of the electrolyte ions inside the holes which provide a good channel for insertion and desertion without any hindrance,53,60 (ii) the presence of the functional groups which facilitates the adsorption–desorption by making the contact between electrode and electrolyte be very fast as revealed by contact angle measurements,37,59 and (iii) the presence of a large number of the graphene sheets which has a very high electrical conductivity due to the low HOMO–LUMO gap, and also the graphene sheets are away from each other which make the diffusion of the electrolyte within the sheets is very fast.53–55
| Potential (V) | b-Value | |
|---|---|---|
| FEGR electrode | RGR electrode | |
| 0.6 | 0.92 | 0.69 |
| 0.7 | 0.85 | 0.76 |
| 0.8 | 0.79 | 0.74 |
Moreover, the b-value of the redox reaction due to the presence of the functional groups can be obtained using the same equation (eqn (8)) by plotting (log![[thin space (1/6-em)]](https://www.rsc.org/images/entities/char_2009.gif) Ipa) vs. (log
Ipa) vs. (log![[thin space (1/6-em)]](https://www.rsc.org/images/entities/char_2009.gif) ν) as displayed in Fig. 4D. The b-value of the redox reaction equals 0.89 which indicates the fast redox surface reactions. As a result, the kinetics of FEGR is faster than that over RGR electrode due to the enhancement of the ionic and electronic pathways.
ν) as displayed in Fig. 4D. The b-value of the redox reaction equals 0.89 which indicates the fast redox surface reactions. As a result, the kinetics of FEGR is faster than that over RGR electrode due to the enhancement of the ionic and electronic pathways.
Also, FEGR electrode exhibited a higher rate performance than RGR electrode as shown in Fig. 4E. Obviously, the calculated Cs of FEGR electrode at 50 mV s−1 using eqn (1) is equal to 49.33 mF cm−2 and this value can be retained to 63.27% at a very high scan rate of 500 mV s−1. On the other hand, the RGR electrode displayed a retention value equal to 57.59% at scan rate from 50 to 500 mV s−1 and this is due to the poor kinetics of this electrode compared to FEGR electrode.
To further ensure the favorable kinetics and capacitive behavior of FEGR electrode over RGR electrode, EIS measurements were carried out at OCP on both electrodes. According to the ideal theoretical capacitive behavior, the electrode must possess a vertical line that makes an angle equal to 90° with the real impedance axis in the Nyquist impedance plot.61 As observed from the Nyquist impedance plot of the two electrodes shown in Fig. 4F and its inset, the FEGR electrode exhibited the steepest line which indicates that it has a higher capacitive behavior than RGR electrode due to the facilitation of the ions transportation on the surface of the electrode which is in agreement with the kinetic study.37,45,60 Also, the electronic conductivity of the electrode is enhanced, and this is obvious from the value of ESR that can be determined by the intersection of the impedance curve with x-axis at a higher frequency region from the Nyquist plot as clear in the inset of Fig. 4F. FEGR electrode has a lower ESR value and this is reflecting the successful exfoliation of the graphite rod to the graphene sheets.46,55,60
As a result of the higher electrochemical performance of FEGR electrode due to its 3D porous structure with the presence of the graphene sheets in the external surface and the presence of more functional groups, this electrode can be used as a promising substrate to enhance redox activity of the redox-active materials as will be discussed in the next Section 3.2.
3.2. Effect of modified substrate on electrochemical performance of Ni(OH)2 and Ni–Co(OH)2
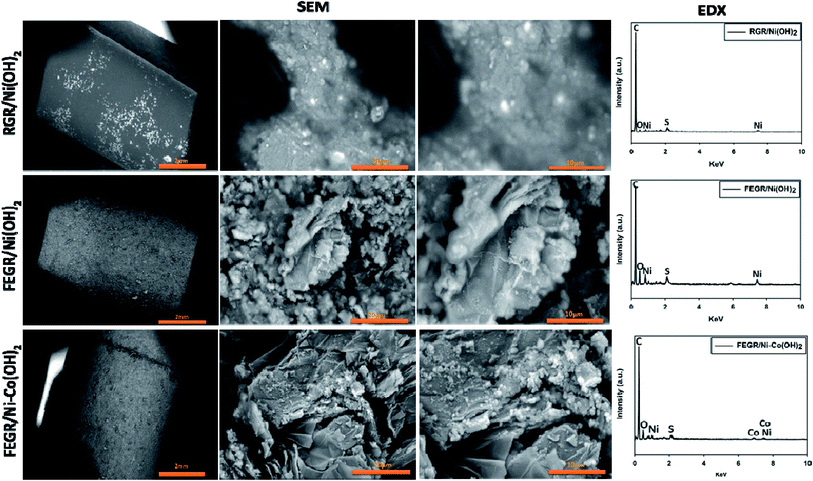 | ||
| Fig. 5 SEM images with different magnifications and EDX analysis of RGR/Ni(OH)2, FEGR/Ni(OH)2, and FEGR/Ni–Co(OH)2 film electrodes. | ||
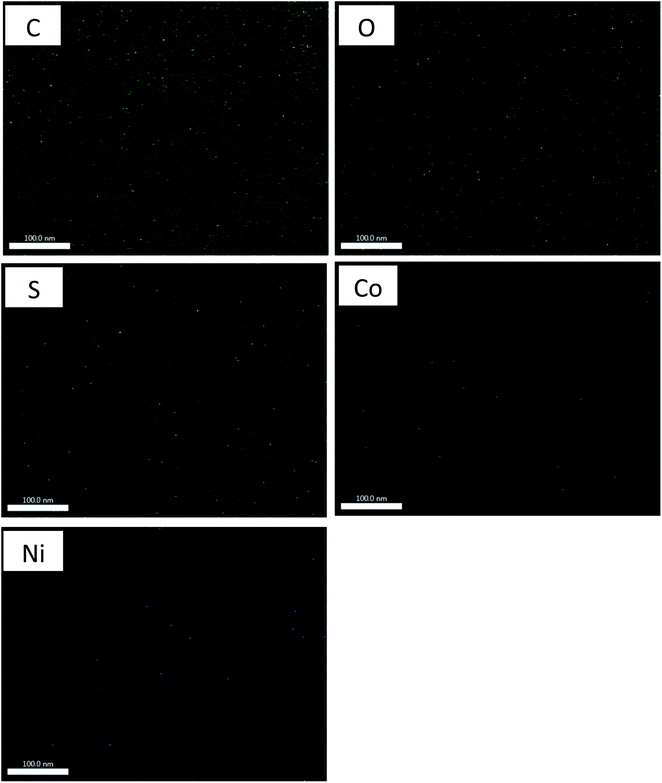
On the other hand, the distribution of the electrodeposited Ni(OH)2, and Ni–Co(OH)2 binary hydroxide, see Fig. 5, on the FEGR is very well which is distributed uniformly inside the pores and within the graphene layers of the external surface of FEGR electrode that makes almost the active material acts as outer active surface and is available to interact with the electrolyte ions very easily resulting in higher energy produced during the charging and discharging process. Additionally, the enhanced distribution behavior of the FEGR/Ni–Co(OH)2 film as results of synthesis graphene layers, high surface area, and inserted O functions groups is observed by the successful distribution of elemental O, Ni, and Co over FEGR substrate from mapping EDX analysis (cf. Fig. 6).
Also, EDX analysis was performed to investigate the surface chemical composition of the as-prepared three films. From Fig. 5, recognized peaks of Ni and O appear in all three prepared films which confirm the successful electrodeposition of Ni in all films. Additionally, Fig. 5 has an extra peak for the presence of Co which confirms the successful formation of Co in the binary hydroxide film (FEGR/Ni–Co(OH)2). Generally, the presence of sulfur peak in all prepared films is due to the incorporation of SO42− from the deposition bath between the layers' structure of the metal hydroxide which suggests the appearance of some facets corresponding to the alpha metal hydroxide phase in the XRD patterns of all films as will be shown in Fig. 7. Specifically for the FEGR/Ni(OH)2 and FEGR/Ni–Co(OH)2 films, there is another contribution of the appearance of the sulfur peak in their EDX analysis that comes from the incorporation of SO42− between the graphite layers during the expansion to produce the expanded graphene layers during the electrochemical exfoliation of the RGR to produce the FEGR electrode.44 Interestingly, the mass percent of the oxygen atoms in all films is 7.61%, 23.29%, and 21.67% for the RGR/Ni(OH)2, FEGR/Ni(OH)2, and FEGR/Ni–Co(OH)2 films, respectively. The higher oxygen content in the FEGR/Ni(OH)2 and FEGR/Ni–Co(OH)2 films is due to the insertion of more oxygen functional groups during the preparation of the FEGR substrate.
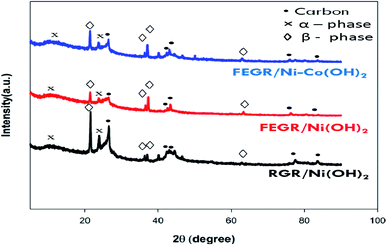 | ||
| Fig. 7 XRD patterns for RGR/Ni(OH)2 (black line), FEGR/Ni(OH)2 (red line), and FEGR/Ni–Co(OH)2 (blue line) films. | ||
XRD patterns of the as-prepared films, i.e., RGR/Ni(OH)2, FEGR/Ni(OH)2, and FEGR/Ni–Co(OH)2 are depicted in Fig. 7. As described elsewhere,62–66 the similarity of the crystalline structure of Ni(OH)2 and Co(OH)2 make the diffraction peaks very close to each other and one can't distinguish between them as seen from the XRD patterns of the proposed films. While the four peaks observed in XRD patterns around 21°, 36°, 37°, and 63° indicate the formation of β-Ni(OH)2 and β-Co(OH)2, then the two peaks around 12° and 23° are corresponding to α-Ni(OH)2 and α-Co(OH)2 due to the incorporation of SO42− inside the crystalline structure as predicted from the EDX analysis.67 Also, the presence of peaks around 25°, 42°, 43°, 77°, and 83° are due to the hexagonal graphitic structure of RGR and FEGR substrate.6,68 So, one can conclude from the similarity of the patterns of all films that the enhancement of capacitive behavior of the active materials on the FEGR substrate over the RGR substrate (cf. Fig. 8, and 9) is attributed to a better distribution of active materials on the surface of the substrate as evident from SEM images of all films which means that the phase difference has no role in this regard because all films have the same crystalline structure (i.e. same phases and facets).
| Co(OH)2 + OH− ⇔ Co(OOH) + H2O + e− | (9) |
| Ni(OH)2 + OH− ⇔ Ni(OOH) + H2O + e− | (10) |
![[thin space (1/6-em)]](https://www.rsc.org/images/entities/char_2009.gif) Ipa and log
Ipa and log![[thin space (1/6-em)]](https://www.rsc.org/images/entities/char_2009.gif) Ipc with log
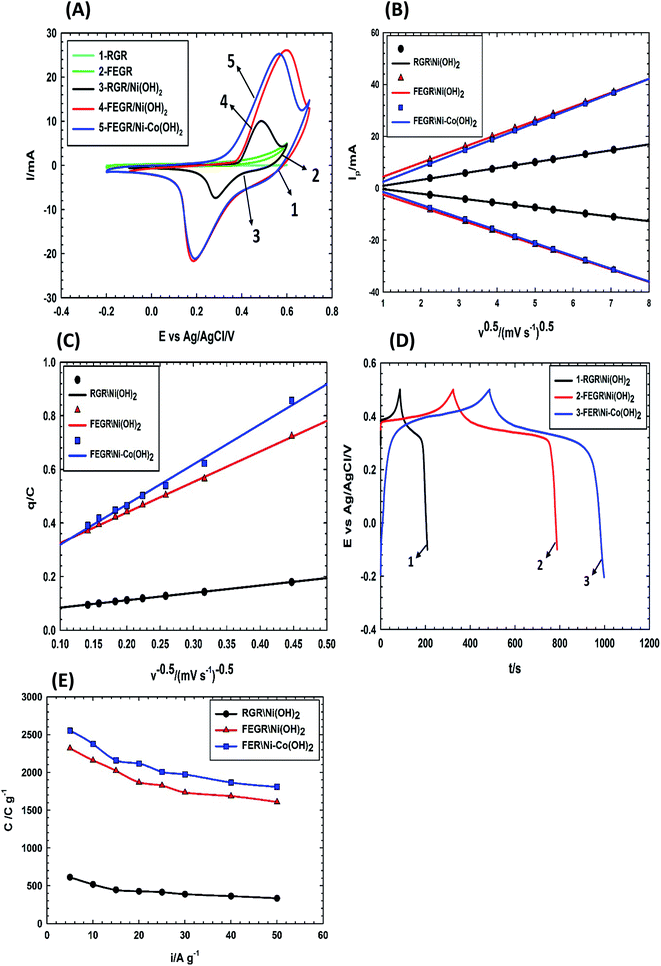
Ipc with log![[thin space (1/6-em)]](https://www.rsc.org/images/entities/char_2009.gif) ν according to eqn (8) where the b-value is equal to 0.5.59 As observed from Fig. 8B, log(Ipa) and log(Ipc) for all as-prepared films have a linear relation with log
ν according to eqn (8) where the b-value is equal to 0.5.59 As observed from Fig. 8B, log(Ipa) and log(Ipc) for all as-prepared films have a linear relation with log![[thin space (1/6-em)]](https://www.rsc.org/images/entities/char_2009.gif) ν where b-value equal 0.5 with R2 value equal 0.999 which confirms the kinetics of the battery type like-electrode for all films.
ν where b-value equal 0.5 with R2 value equal 0.999 which confirms the kinetics of the battery type like-electrode for all films.As the indication of the large integrated surface area of the charging or discharging branch of the FEGR/Ni(OH)2 and FEGR/Ni–Co(OH)2 compared with RGR/Ni(OH)2, the C value of the active materials on modified FEGR electrode is greatly enhanced. This firstly is due to FEGR electrode provides homogeneous and uniform distribution of the active materials on its surface due to its high surface area. Secondly, the more inserted and distributed functional groups on FEGR surface makes almost the active materials act as outer active surface, more accessible area, and this can be demonstrated easily by determining the amount of the outer active site which can be estimated from the intercept value of the following simple empirical relation of eqn (11).59,69–71
| q = q∞ + av−0.5 | (11) |
Fig. 8D shows the GCD curves of all as-prepared films at current density equal to 5 A g−1. The maximum C of each film can be calculated from the discharge time at current density of 5 A g−1 using eqn (3) and it is estimated to be 612.5, 2318.4, and 2552.6 C g−1 corresponding to RGR/Ni(OH)2, FEGR/Ni(OH)2, and FEGR/Ni–Co(OH)2 films, respectively. Note that the values of C for the FEGR-based electrodes is much improved compared to the similar RGR-based electrodes. Moreover, these values exceed the theoretically-calculated C values (ca. 1730 C g−1) based on the redox phenomenon of the metal hydroxide (C = nF/Mw).12–14 This could be possibly attributed to (i) the enhanced redox behavior of the metal hydroxide to higher oxidation states with average number of electron transfer (n) approaching 1.7,42 (ii) better distribution of the metal hydroxide in the case of FEGR-substrate (see SEM images in Fig. 5 and the corresponding mapping EDAX in Fig. 6), thus leading to a higher electrochemical active surface area, and (iii) a considerable contribution of the double layer of the underlying FEGR substrate. The active materials on FEGR electrodes' surface exhibit ultra-high C compared to RGR substrate and it is also one of the highest reported C for Ni(OH)2 and binary Ni–Co(OH)2 active materials as reported in Table 2. Interestingly, this value is higher than other active materials loaded on the exfoliated carbon materials such as FEG/MnO2 (1061 F g−1),37 WO3/Ex-GF (495.8 F g−1),72 and PANI-WOx/Ex-GF (408 F g−1).73
| Method | Electrolyte | C (C g−1) | Rate performance | Cyclic performance | Ref. |
|---|---|---|---|---|---|
| Precipitation | 1 M KOH | 309.6 | ∼55.6% (0.5 to 5 A g−1) | 75% (500 cycle at 1 A g−1) | 75 |
| Precipitation | 6 M KOH | 1307 | 85.9% (1 to 10 A g−1) | 86.4% (1000 cycle at 5 A g−1) | 76 |
| Hydrothermal | 3 M KOH | 1194.7 | 48% (1 to 10 A g−1) | 77% (1500 cycle at 10 A g−1) | 77 |
| Hydrothermal | 6 M KOH | 794.8 | 59.5% (2 to 40 A g−1) | 40% (3000 cycle at 30 A g−1) | 78 |
| Solvothermal | 3 M KOH | 860 | 76.9% (1 to 20 A g−1) | 74% (1000 cycle at 20 A g−1) | 79 |
| Solvothermal | 1 M KOH | 1084.1 | ∼22% (9.1 to 31.8 A g−1) | 67.8% (2000 cycle at 31.8 A g−1) | 80 |
| Microwave | 6 M KOH | 849.4 | 62.9% (1 to 10 A g−1) | 99.7% (3000 cycle at 8 A g−1) | 81 |
| CBD | 2 M KOH | 923.5 | 47% (5 to 80 A g−1) | 64% (1000 cycle at 80 A g−1) | 82 |
| Reflux | 6 M KOH | 693 | 88% (1 to 10 A g−1) | 80% (1000 cycle at 10 A g−1) | 83 |
| Electrodeposition | 1 M KOH | 1052.5 | 56.6% (2 to 20 A g−1) | 89.5% (2000 cycle at 10 A g−1) | 84 |
| Electrodeposition | 6 M KOH | 541.8 | 91.8% (1 to 10 A g−1) | 80.1% (1000 cycle at 10 A g−1) | 22 |
| Electrodeposition | 3 M NaOH | 959.9 | 37.7% (4 to 24 A g−1) | 91% (1000 cycle at 12 A g−1) | 33 |
| Electrodeposition | 1 M KOH | 1665.4 | 73.5% (2 to 50 A g−1) | 94% (2000 cycle at 20 A g−1) | 34 |
| Electrodeposition | 0.5 M NaOH | 2552.6 | 70.8% (5 to 50 A g−1) | 70.3% (1000 cycle at 50 A g−1) | This work |
Fig. 8E illustrates the variation of C with different discharge current densities for the investigated films from 5 to 50 A g−1. Capacitive retention for each film at the current density of 50 A g−1 is 44.6%, 64.9%, and 70.8% which is corresponding to RGR/Ni(OH)2, FEGR/Ni(OH)2, and FEGR/Ni–Co(OH)2 films, respectively. Generally, the active materials loaded on the FEGR electrode have better rate performance than that loaded on RGR, and this is due to the enhancement of the electronic and ionic diffusion pathways and the homogeneous distribution of active materials as mentioned above.
More specifically the binary hydroxide FEGR/Ni–Co(OH)2 film has a higher retention value than single hydroxide FEGR/Ni(OH)2 film. This can be explained by the increment of the total electronic conductivity of Ni(OH)2 in the presence of Co(OH)2 because the charging and discharging of Co(OH)2 leads to the formation of highly conductive Co(OOH) which speeds up the transportation of the electrons which make the utilization of the active materials at high scan speed is more efficient. Also, the energy gap between the valence and conduction bands of Ni(OH)2 can be decreased by the presence of the Co ions inside its crystal structure.8,30,74
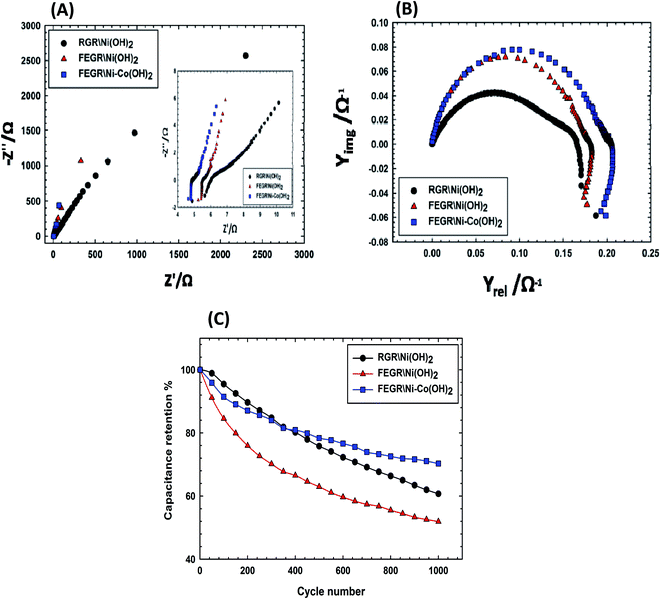
For furthermore confirmation of the above-mentioned conclusion, EIS measurements were carried out on the proposed films. Fig. 9A displayed the impedance spectra of the films showing firstly both films FEGR/Ni–Co(OH)2 and FEGR/Ni(OH)2 exhibited the excellent capacitive behavior more than RGR/Ni(OH)2 due to they have the steep line in the high-frequency region compared to the inclined line of RGR/Ni(OH)2.37,61 Secondly, from the low-frequency region, see inset of Fig. 9A, the loaded active materials on FEGR film has a lower ESR value than that loaded on RGR film and this can be attributed to the improved conductivity due to the synthesized graphene layers.37,55 Interestingly, the ESR value of FEGR/Ni–Co(OH)2 film is smaller than that of RGR/Ni(OH)2 film and this demonstrates the role of the Co(OH)2 in increasing the total electronic conductivity of the electrode. Also, the admittance plot, see Fig. 9B, displayed the similar behavior of ESR value that is in the order that RGR/Ni(OH)2 > FEGR/Ni(OH)2 > FEGR/Ni–Co(OH)2 film accompanied with the increment of the conductivity value in the order of RGR/Ni(OH)2 < FEGR/Ni(OH)2 < FEGR/Ni–Co(OH)2 because the admittance, as known, is the inverse of the impedance.
Moreover, the stability test of the assigned films was also examined by GCD test for 1000 cycles at 50 A g−1 current density, see Fig. 9C. Capacitive retention for each film is 60.7%, 52%, and 70.3% for RGR/Ni(OH)2, FEGR/Ni(OH)2, and FEGR/Ni–Co(OH)2 films, respectively. It is clearly obvious from the capacitive retention values that the stability of binary metallic hydroxide film is better than that of the individual Ni hydroxide film. This is due to the incorporation of Co ions into Ni hydroxide layers preventing the mechanical failure that can be happen during the charging process due to the transformation of β-NiOOH to γ-NiOOH.20,29
4. Conclusion
In summary, the electrochemical partial exfoliation was done on the RGR that obtained from exhausted zinc–carbon batteries to produce FEGR electrode that is characterized by high functionalized surface area with the presence of holes and exfoliated graphene layers. The inserted functional groups on the defected surface of the FEGR electrode are confirmed by the EDX, XPS, FT-IR, and contact angle measurements. Also, the presence of the graphene layers on the top surface is observed from the SEM images. This leads to providing a higher degree of distribution (homogeneous deposition) of the Ni(OH)2, and Ni/Co binary hydroxide and also shortening the diffusion pathway for electrolyte ions to efficiently contact more electroactive sites for faradaic energy storage, even at high current densities, leading to enhanced electrochemical properties. Also, the observed decrease in the equivalent series resistance of the active materials on the FEGR substrate is due to the presence of the graphene layers that can transport the electrons very fast due to its excellent electronic conductivity which is considered another enhancement of the electrochemical performance of the modified FEGR over the modified RGR electrode. Interestingly, FEGR\Ni–Co(OH)2 film displayed an ultra-high specific capacity (more than 2500 C g−1 at 5 A g−1) which is considered one of the highest reported values based on the binary Ni/Co hydroxide and the value is retained to 70.8% at a high current density of 50 A g−1 indicating the superb rate performance of this electrode material.Conflicts of interest
There are no conflicts to declare.References
- K. D. Fong, T. Wang and S. K. Smoukov, Sustainable Energy Fuels, 2017, 1, 1857–1874 RSC.
- M. R. Rizk, M. G. Abd El-Moghny, A. Mazhar, M. S. El-Deab and B. E. El-Anadouli, Sustainable Energy Fuels, 2021, 5, 986–994 RSC.
- G. H. El-Nowihy and M. S. El-Deab, Renewable Energy, 2021, 167, 830–840 CrossRef CAS.
- L. Zhang, X. Hu, Z. Wang, F. Sun and D. G. Dorrell, Renewable Sustainable Energy Rev., 2018, 81, 1868–1878 CrossRef.
- I. O. Baibars, M. G. Abd El-Moghny, A. S. Mogoda and M. S. El-Deab, J. Electrochem. Soc., 2021, 168, 54509 CrossRef CAS.
- J. Zhang, J. Chen, H. Yang, J. Fan, F. Zhou, Y. Wang, G. Wang and R. Wang, J. Solid State Electrochem., 2017, 21, 2975–2984 CrossRef CAS.
- Y. Yang, Y. Tu, P. Zhu, L. Zhang, T. Li, H. Zheng, R. Sun and C. Wong, Sustainable Energy Fuels, 2018, 2, 2345–2357 RSC.
- M. Li, K. Y. Ma, J. P. Cheng, D. Lv and X. B. Zhang, J. Power Sources, 2015, 286, 438–444 CrossRef CAS.
- Y. Wang, Y. Song and Y. Xia, Chem. Soc. Rev., 2016, 45, 5925–5950 RSC.
- T. Wang, H. C. Chen, F. Yu, X. S. Zhao and H. Wang, Energy Storage Mater., 2019, 16, 545–573 CrossRef.
- Y. Jiang, C. Zhou and J. Liu, Energy Storage Mater., 2018, 11, 75–82 CrossRef.
- Y. Fu, Y. Zhou, Q. Peng, C. Yu, Z. Wu, J. Sun, J. Zhu and X. Wang, J. Power Sources, 2018, 402, 43–52 CrossRef CAS.
- K. N. Kang, I. H. Kim, A. Ramadoss, S. I. Kim, J. C. Yoon and J. H. Jang, Phys. Chem. Chem. Phys., 2018, 20, 719–727 RSC.
- S. W. I. Kim, I. H. Kim, S. W. I. Kim and J. H. Jang, Chem.–Asian J., 2017, 12, 1291–1296 CrossRef CAS PubMed.
- L. Liu, Y. Hou, Y. Gao, N. Yang, J. Liu and X. Wang, Electrochim. Acta, 2019, 295, 340–346 CrossRef CAS.
- J. W. Lee, T. Ahn, D. Soundararajan, J. M. Ko and J. D. Kim, Chem. Commun., 2011, 47, 6305–6307 RSC.
- Y. X. Wang, Z. A. Hu and H. Y. Wu, Mater. Chem. Phys., 2011, 126, 580–583 CrossRef CAS.
- H. Huang, Y. Guo and Y. Cheng, Appl. Surf. Sci., 2018, 435, 635–640 CrossRef CAS.
- P. Sirisinudomkit, P. Iamprasertkun, A. Krittayavathananon, T. Pettong, P. Dittanet, P. Kidkhunthod and M. Sawangphruk, Sustainable Energy Fuels, 2017, 1, 275–279 RSC.
- J. Liu, S. Y. Chiam, J. Pan, L. M. Wong, S. F. Y. Li and Y. Ren, Sol. Energy Mater. Sol. Cells, 2018, 185, 318–324 CrossRef CAS.
- T. Nguyen, M. Boudard, M. João Carmezim and M. Fátima Montemor, Energy, 2017, 126, 208–216 CrossRef CAS.
- Z. Wei, J. Yuan, S. Tang, D. Wu and L. Wu, J. Colloid Interface Sci., 2019, 542, 15–22 CrossRef CAS PubMed.
- J. Li, M. Wei, W. Chu and N. Wang, Chem. Eng. J., 2017, 316, 277–287 CrossRef CAS.
- Y. Feng, Y. Li, W. Yang and H. Huang, J. Nanosci. Nanotechnol., 2019, 20, 1260–1268 CrossRef PubMed.
- M. Wei, Q. Huang, Y. Zhou, Z. Peng and W. Chu, J. Energy Chem., 2018, 27, 591–599 CrossRef.
- Y. Tang, Y. Liu, S. Yu, W. Guo, S. Mu, H. Wang, Y. Zhao, L. Hou, Y. Fan and F. Gao, Electrochim. Acta, 2015, 161, 279–289 CrossRef CAS.
- W. Zhu, Z. Lu, G. Zhang, X. Lei, Z. Chang, J. Liu and X. Sun, J. Mater. Chem. A, 2013, 1, 8327–8331 RSC.
- J. Wu, W. W. Liu, Y. X. Wu, T. C. Wei, D. Geng, J. Mei, H. Liu, W. M. Lau and L. M. Liu, Electrochim. Acta, 2016, 203, 21–29 CrossRef CAS.
- B. Liu, X. Liu, X. Fan, J. Ding, W. Hu and C. Zhong, J. Alloys Compd., 2020, 834, 155185 CrossRef CAS.
- H. Chen, L. Hu, M. Chen, Y. Yan and L. Wu, Adv. Funct. Mater., 2014, 24, 934–942 CrossRef CAS.
- Y. L. Li, J. J. Zhou, M. K. Wu, C. Chen, K. Tao, F. Y. Yi and L. Han, Inorg. Chem., 2018, 57, 6202–6205 CrossRef CAS PubMed.
- T. Li, G. H. Li, L. H. Li, L. Liu, Y. Xu, H. Y. Ding and T. Zhang, ACS Appl. ACS Appl. Mater. Interfaces, 2016, 8, 2562–2572 CrossRef CAS PubMed.
- S. Shahrokhian, S. Rahimi and R. Mohammadi, Int. J. Hydrogen Energy, 2018, 43, 2256–2267 CrossRef CAS.
- J. Xing, S. Wu and K. Y. S. Ng, RSC Adv., 2015, 5, 88780–88786 RSC.
- D. Wei, L. Grande, V. Chundi, R. White, C. Bower, P. Andrew and T. Ryhänen, Chem. Commun., 2012, 48, 1239–1241 RSC.
- X. Wang, S. X. Zhao, L. Dong, Q. L. Lu, J. Zhu and C. W. Nan, Energy Storage Mater., 2017, 6, 180–187 CrossRef.
- Y. Song, D. Y. Feng, T. Y. Liu, Y. Li and X. X. Liu, Nanoscale, 2015, 7, 3581–3587 RSC.
- Z. Dou, Z. Qin, Y. Shen, S. Hu, N. Liu and Y. Zhang, Carbon, 2019, 153, 617–624 CrossRef CAS.
- S. Yang, M. R. Lohe, K. Müllen and X. Feng, Adv. Funct. Mater., 2016, 28, 6213–6221 CrossRef CAS PubMed.
- H. Lv, Q. Pan, Y. Song, X. X. Liu and T. Liu, Nano-Micro Lett., 2020, 12, 118 CrossRef CAS PubMed.
- Y. Song, T. Liu, F. Qian, C. Zhu, B. Yao, E. Duoss, C. Spadaccini, M. Worsley and Y. Li, J. Colloid Interface Sci., 2018, 509, 529–545 CrossRef CAS PubMed.
- D. S. Hall, D. J. Lockwood, C. Bock and B. R. MacDougall, Proc. R. Soc. A, 2015, 471, 20140792 CrossRef PubMed.
- A. M. Abdelrahim, M. G. Abd El-Moghny, M. E. El-Shakre and M. S. El-Deab, Electrochim. Acta, 2021, 378, 137991 CrossRef CAS.
- C. J. Raj, R. Manikandan, W. G. Lee, W. J. Cho, K. H. Yu and B. C. Kim, Electrochim. Acta, 2018, 283, 1543–1550 CrossRef CAS.
- D. Y. Feng, Y. Song, Z. H. Huang, X. X. Xu and X. X. Liu, J. Power Sources, 2016, 324, 788–797 CrossRef CAS.
- H. Y. Li, Y. Yu, L. L. Liu, L. L. Liu and Y. Wu, Electrochim. Acta, 2017, 228, 553–561 CrossRef CAS.
- Z. Wang, Y. Han, Y. Zeng, Y. Qie, Y. Wang, D. Zheng, X. Lu and Y. Tong, J. Mater. Chem. A, 2016, 4, 5828–5833 RSC.
- G. Wang, H. Wang, X. Lu, Y. Ling, M. Yu, T. Zhai, Y. Tong and Y. Li, Adv. Mater., 2014, 26, 2676–2682 CrossRef CAS PubMed.
- Y. Song, S. Duan, D. Yang, R. Dong, D. Guo, X. Sun and X. Liu, Energy Technol., 2019, 7, 1–8 CrossRef.
- D. Mandal, P. Routh, A. K. Mahato and A. K. Nandi, J. Mater. Chem. A, 2019, 7, 17547–17560 RSC.
- A. Fetoh, K. A. Asla, A. A. El-Sherif, H. El-Didamony and G. M. Abu El-Reash, J. Mol. Struct., 2019, 1178, 524–537 CrossRef CAS.
- T. Liu, C. Zhu, T. Kou, M. A. Worsley, F. Qian and C. Condes, ChemNanoMat, 2016, 2, 635–641 CrossRef CAS.
- A. Raghunandanan, M. Yeddala, P. Padikassu and R. Pitchai, ChemistrySelect, 2018, 3, 5032–5039 CrossRef CAS.
- Y. Song, J. L. Xu and X. X. Liu, J. Power Sources, 2014, 249, 48–58 CrossRef CAS.
- Y. Xie and Y. Zhou, J. Mater. Res., 2019, 34, 2472–2481 CrossRef CAS.
- L. Miao, H. Duan, D. Zhu, Y. Lv, L. Gan, L. Li and M. Liu, J. Mater. Chem. A, 2021, 9, 2714–2724 RSC.
- Z. Song, L. Miao, L. Li, D. Zhu, L. Gan and M. Liu, Carbon, 2021, 180, 135–145 CrossRef CAS.
- L. Miao, Z. Song, D. Zhu, L. Li, L. Gan and M. Liu, Energy Fuels, 2021, 35, 8443–8455 CrossRef CAS.
- Z. Sun, X. Cai, D. Y. Feng, Z. H. Huang, Y. Song and X. X. Liu, ChemElectroChem, 2018, 5, 1501–1508 CrossRef CAS.
- Y. Song, T. Liu, G. Xu, D. Feng, B. Yao, T. Kou, X. Liu and Y. Li, J. Mater. Chem. A, 2016, 4, 7683–7688 RSC.
- B. E. Conway, Electrochemical supercapacitors scientific fundamentals and technological applications, Springer US, 1999, p. 366 Search PubMed.
- X. Zheng, Z. Gu, Q. Hu, B. Geng and X. Zhang, RSC Adv., 2015, 5, 17007–17013 RSC.
- S. B. Kulkarni, A. D. Jagadale, V. S. Kumbhar, R. N. Bulakhe, S. S. Joshi and C. D. Lokhande, Int. J. Hydrogen Energy, 2013, 38, 4046–4053 CrossRef CAS.
- S. R. Ede, S. Anantharaj, K. T. Kumaran, S. Mishra and S. Kundu, RSC Adv., 2017, 7, 5898–5911 RSC.
- Z. A. Hu, Y. L. Xie, Y. X. Wang, H. Y. Wu, Y. Y. Yang and Z. Y. Zhang, Electrochim. Acta, 2009, 54, 2737–2741 CrossRef CAS.
- L. Jiang, Y. Sui, J. Qi, Y. Chang, Y. He, F. Wei, Q. Meng and Z. Sun, Micro Nano Lett., 2016, 11, 837–839 CrossRef CAS.
- J. P. Cheng, L. Liu, J. Zhang, F. Liu and X. B. Zhang, J. Electroanal. Chem., 2014, 722–723, 23–31 CrossRef CAS.
- M. Kazazi, A. R. Sedighi and M. A. Mokhtari, Appl. Surf. Sci., 2018, 441, 251–257 CrossRef CAS.
- G. Fregonara and S. Trasatti, Electrochim. Acta, 1990, 35, 263–267 CrossRef.
- T. Nguyen, M. Boudard, M. J. Carmezim and M. F. Montemor, Sci. Rep., 2017, 7, 1–10 CrossRef PubMed.
- Y. Song, X. Cai, X. Xu and X. X. Liu, J. Mater. Chem. A, 2015, 3, 14712–14720 RSC.
- G. Yang and X. X. Liu, J. Power Sources, 2018, 383, 17–23 CrossRef CAS.
- J. W. Geng, Y. J. Ye, D. Guo and X. X. Liu, J. Power Sources, 2017, 342, 980–989 CrossRef CAS.
- Y. Cheng, H. Zhang, C. V. Varanasi and J. Liu, Energy Environ. Sci., 2013, 6, 3314–3321 RSC.
- C. Wang, X. Zhang, X. Sun and Y. Ma, Electrochim. Acta, 2016, 191, 329–336 CrossRef CAS.
- L. Xie, Z. Hu, C. Lv, G. Sun, J. Wang, Y. Li, H. He, J. Weng and K. Li, Electrochim. Acta, 2012, 78, 205–211 CrossRef CAS.
- L. Ye, L. Zhao, H. Zhang, B. Zhang and H. Wang, J. Mater. Chem. A, 2016, 4, 9160–9168 RSC.
- C. Xing, F. Musharavati, H. Li, E. Zalezhad, O. K. S. Hui, S. Bae and B. Y. Cho, RSC Adv., 2017, 7, 38945–38950 RSC.
- X. Cai, X. Shen, L. Ma, Z. Ji, C. Xu and A. Yuan, Chem. Eng. J., 2015, 268, 251–259 CrossRef CAS.
- R. Patel, A. I. Inamdar, B. Hou, S. N. Cha, A. T. Ansari, J. L. Gunjakar, H. Im and H. Kim, Curr. Appl. Phys., 2017, 17, 501–506 CrossRef.
- Y. Tao, H. Zhu, R. Li, Z. Li, J. Liu, G. Wang and Z. Gu, Electrochim. Acta, 2013, 111, 71–79 CrossRef CAS.
- U. M. Patil, J. S. Sohn, S. B. Kulkarni, S. C. Lee, H. G. Park, K. V. Gurav, J. H. Kim and S. C. Jun, ACS Appl. Mater. Interfaces, 2014, 6, 2450–2458 CrossRef CAS PubMed.
- S. Chen, L. Zhao, W. Wei, Y. Li and L. Mi, J. Alloys Compd., 2020, 831, 154794 CrossRef CAS.
- G. Nagaraju, G. S. R. Raju, Y. H. Ko and J. S. Yu, Nanoscale, 2016, 8, 812–825 RSC.
Footnote |
| † Those authors contribute equally to this work. |
| This journal is © The Royal Society of Chemistry 2021 |

