
 Open Access Article
 This Open Access Article is licensed under a
 Creative Commons Attribution 3.0 Unported Licence
Organic–inorganic interactions revealed by Raman spectroscopy during reversible phase transitions in semiconducting [(C2H5)4N]FeCl4†
Khaoula Ben Brahim *a,
Malika Ben gzaiela,
Abderrazek Oueslatia,
Kamel Khirounib,
Mohamed. Gargouria,
Gwenaël Corbelc and
Jean-François Bardeauc
*a,
Malika Ben gzaiela,
Abderrazek Oueslatia,
Kamel Khirounib,
Mohamed. Gargouria,
Gwenaël Corbelc and
Jean-François Bardeauc
aLaboratoire de Caractérisation Spectroscopique et Optique des Matériaux, Faculté des Sciences, Université de Sfax, B.P. 1171, 3000 Sfax, Tunisia. E-mail: benbrahimkhawla75@gmail.com
bLaboratoire de Physique des Matériaux et des Nanomatériaux appliquée à l'Environnement, Faculté des Sciences de Gabes, Université de Gabes, cite Erriadh, 6079, Gabes, Tunisia
cInstitut des Molécules et Matériaux du Mans (IMMM), UMR-6283 CNRS, Le Mans Université, Avenue Olivier Messiaen, F-72085 Le Mans Cedex 9, France
First published on 24th May 2021
Abstract
The alkylammonium halogenoferrate families are subjected to diverse studies according to their wide field application. However, these compounds show various transitions depending on the preparation process. In this paper, the [(C2H5)4N]FeCl4 compound was successfully synthesized using a slow evaporation solution growth method at room temperature. An optical absorption measurement confirms the semiconductor nature with a band gap around 2.95 eV. The X-ray powder diffraction (XRPD) data confirmed the formation of a single-phase with hexagonal-type structure. The differential scanning calorimetry (DSC) indicated that the [(C2H5)4N]FeCl4 compound undergoes eight reversible phase transitions between 193 and 443 K. At high temperature (T > 423 K) the plastic nature of the crystals was confirmed. Temperature-controlled X-ray diffraction reveals that the thermal expansion of the crystal structure is non homothetic in the (a,b) plane and along the c axis. The temperature dependence of the Raman spectra up to 443 K revealed specific reorientations and molecular displacements of the organic and inorganic components associated with the phase transitions. We aim to thermally stabilize the [(C2H5)4N]FeCl4 compound which has a band gap suitable for photocatalytic processes.
Introduction
An organic–inorganic hybrid material is a multi-component compound having at least an organic or inorganic group with a characteristic length on the nanometer scale.1 Benefiting from the combination of organic cations and inorganic anions, hybrid materials may demonstrate better properties compared to their individual counterparts. Indeed, by adjusting the chemical composition, it is possible to modify the interactions at the molecular level and generate materials with improved performance or create multifunctional materials with interesting physicochemical properties.2,3Plastic crystals, described in the 1960's,4 represent an emerging family of hybrid materials, due to very specific multifunctional properties such as higher ionic conductivity and reversible changes in their dielectric, conducting and magnetic behavior.5–9
The plastic phase is typically reached by one or more solid–solid phase transitions on warming the fully ordered crystalline phase. It can be considered as a mesophase between a crystalline and a liquid like state which acquires some rotational degree of freedom above a certain temperature. This state is characterized by a long-range order but short-range disorder, which typically originates from rotational motions of the molecules while their center of gravity remains fixed in the crystal lattice.10–12 So, the plastic phase transition is between a high-symmetric (usually cubic) and a low symmetric crystal phase which usually accompanies with much larger enthalpy change.6 Recently, typical examples which combine organic cations and inorganic chloro-ferrate anions have been reported. High ionic conductivity in plastic choline [FeCl4] at room temperature makes it of interest as solid state ionic conductors.10 The [(CH3)3S][FeCl4] is a very interesting plastic hybrid compound with coexistence of multifunctional properties that can be useful for both solar thermal and electric energy storage.11
Perovskite hybrid crystalline materials have rich optoelectronic applications such as in solar cell light absorbers, light emitting diodes, light detectors due to their tunable bandgaps and high carrier mobility.13 Compared to conventional organic–inorganic materials, phase transition hybrid compounds have gained increasing attention due to their potential applications in communication, data storage, sensing, switchable dielectric devices.14 In general, organic cations provide structural flexibility and dynamic behavior (disordered at high temperature and order at low temperature) while inorganic anions, as frameworks, provide stability. A number of complexes with a tetrahedral tetrachloroferrate(III) anion [FeCl4]− mixed with organic cation have been reported for their interesting catalytic properties.15–18 For instance, the tetraethylammonium tetrachloroferrate ([(C2H5)4N]FeCl4) compound has already been used as photocatalyst for the oxidation of the cyclohexane19 and the toluene20 under visible light. This is a notable advantage over TiO2 compound which requires ultraviolet (UV) irradiation to induce a photocatalytic oxidation of toluene.21 Nevertheless, despite the importance of tetraethylammonium tetrachloroferrate, the phase transitions at high temperature (T > 273 K) remain misunderstood. Recent technological applications require a higher operating temperature, such as the battery of an auto-switching cell phone. So, it is therefore crucial to better explore the physical properties of switchable materials and investigate, with accuracy, their reversible phase transitions at high temperatures (T > 273 K).22
For the quaternary amine cations [(CnH2n+1)4N]+ bound to an iron(III) chloride, the increase in the number of carbon atoms in the alkyl chain makes it possible to decline the structural stability of the anion (FeCl4).23 The transition temperatures are dependent on the thermal history of the samples24 and contrary results are reported in literature23,25–27 for the [(C2H5)4N]FeCl4 (n = 2) compound. Indeed, the Differential Thermal Analysis (DTA) measurements performed by D. Wyrzykowski et al. (2008)23 show only one structural phase transition at 427 K related to a change in the spatial arrangement of the hydrocarbon chain of [(C2H5)4N]+ cations. A Differential Scanning Calorimetry (DSC) and vibrational studies performed by Ben Brahim et al.25 as a function of temperature reveal the presence of two phase transitions at 413 and 430 K, respectively. Below the ambient temperature, the changes in the molar heat capacity Cpm, of [(C2H5)4N]FeCl4, attest of the presence of three structural phase transitions at ≈235, ≈227 and ≈217 K, respectively.26 Although the phase transition at ≈217 K was not detected by X-ray diffraction on single crystal,27 the three phase transitions are likely due to the reorientations of ethyl groups.
In the present study, experimental UV-vis spectrum absorption was performed in order to discuss the electronic transitions within the [(C2H5)4N]FeCl4 compound. A combination of differential scanning calorimetry (DSC), X-ray powder diffraction (XRPD) and Raman spectroscopy were used to investigate the structural phase transitions of [(C2H5)4N]FeCl4 above room temperature.
Experimental details
The [(C2H5)4N]FeCl4 crystals were grown by a slow evaporation at room temperature of a mixed aqueous solution of FeCl3 (Purity 98%; FLUKA) and [(C2H5)4N]Cl (Purity 97%; FLUKA). Details of the crystal growth procedure were described elsewhere.25The phase purity of the as-prepared powder was first checked by recording X-ray powder diffraction (XRPD) pattern at room temperature on a PANalytical θ/θ Bragg–Brentano Empyrean diffractometer (Cu Kα1+2 radiations) equipped with the PIXcel1D detector. XRPD pattern was collected at room temperature in the [5°–100°] scattering angle range, with a 0.0131° step size, for a total acquisition time of 10 h.
The absorption and reflectance spectroscopy were performed on powder at room temperature using a Shimadzu UV-3101PC scanning spectrophotometer with a wavelength radiation varying from 200 to 800 nm. The device allows the measure of the absorbance and the reflectance by the external mode using an integrating sphere and a xenon lamp. The barium sulfate powder (BaSO4) is used to record the reference signal.
Thermal stability in air of the as-prepared powder was studied by temperature-controlled X-ray powder diffraction. Prior to data collection, a dehydration of the sample was carried out at 373 K for 110 min in the reactor chamber. Then, temperature-controlled XRPD patterns were recorded on the same diffractometer between 298 and 383 K (heating rate of 10 K min−1, temperature stabilisation for 20 min, cooling rate of 60 K min−1, air flow of 40 mL min−1) by using an XRK 900 Anton Paar reactor chamber. The sample was deposited on the sieve (pore size Φ 0.2 mm) of the open sample holder cup, both made of glass ceramic Macor®, thus allowing air to flow through the sample. For each temperature, the XRPD pattern was collected in the [10°–50°] scattering angle range, with a 0.0131° step size, for a total acquisition time of 90 min. The refinements of the XRPD pattern were carried out by the Le Bail method28 of the FullProf program.29
Differential scanning calorimetry (DSC) measurements were performed using a Perkin Elmer DSC-7 instrument at heating/cooling rate of 5 K min−1. Two successive heating and cooling runs were carried out in the temperature range from 193 K to 443 K in order to determine the exact phase transitions temperatures. A second series of DSC analysis was carried out between 193 and 406 K to avoid passing through plastic state which allows to disturb the system. The enthalpy changes, (ΔH), due to the observed endothermic event were calculated by numerical integration of a surface area under the curve of the heat flow as a function of time.
The Raman spectra were collected between 70 and 3100 cm−1 over the temperature range 294–443 K using a T-64000 (Jobin-Yvon, Horiba group, Kyoto, Japan) spectrometer. Prior to data collection, the sample was heated up to 373 K for 10 min then cooled to room temperature. We used a BX41 Olympus microscope equipped with a MSPlan 50x (N.A. 0.55) objective to focus the incident wavelength radiation at 647.1 nm, provided by an argon–krypton ion laser (Innova, Coherent, France). During the experiment, the laser power was less than 2 mW on the sample and the Raman spectra were systematically recorded twice with an integration time of 60 s. The scattered light was then analyzed by a spectrometer with a single monochromator (600 gratings per mm), coupled to a nitrogen cooled front-illuminated charge-coupled device (CCD) detector. Acquisition and basic treatments of spectra (determination of peak positions and full width at half maximum (FWHM) of the Raman bands) have been performed using the LabSpec V5.25 (Jobin-Yvon, Horiba Group, Kyoto, Japan) software.
Results and discussion
X-ray powder diffraction analysis (XRPD)
A refinement of the XRPD pattern collected at room temperature was carried out by the Le Bail method using the cell parameters and the P63mc (n = 186) space group reported in the literature as a starting point.25 Fig. 1 shows the observed, calculated, and difference diffraction patterns for [(C2H5)4N]FeCl4. All Bragg peaks were successfully indexed and satisfactorily modelled, thus confirming the high purity of the sample. The conventional reliability factors of the refinement are Rp = 11.2%, Rωp = 8.20%, Rexp = 3.08% and χ2 = 7.07. The hexagonal cell parameters, a = 8.2248(5) Å and c = 13.2159(8) Å, are in good agreement with those determined from XRD data collected on a single crystal of ([(C2H5)4N]FeCl4.30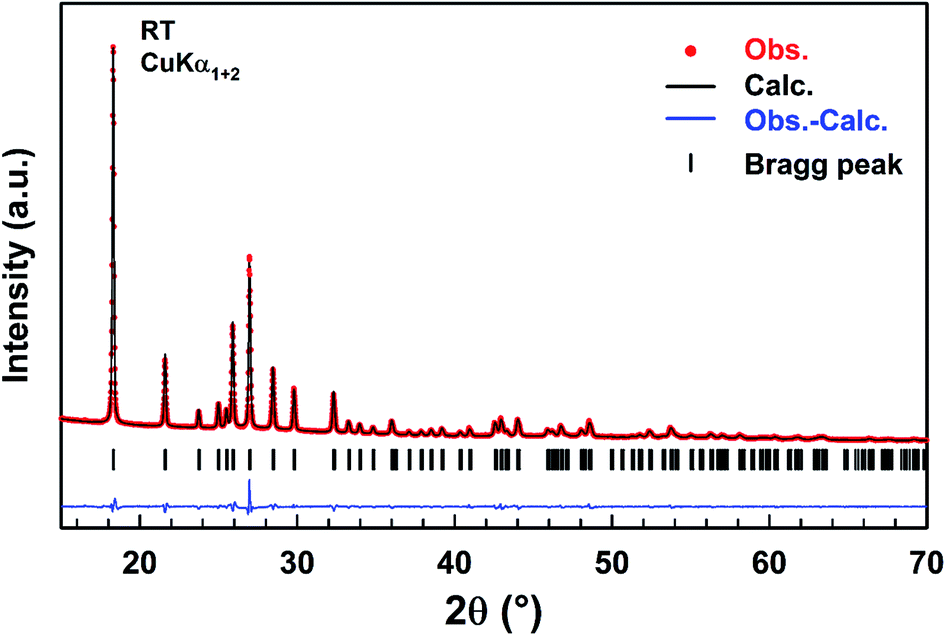 | ||
| Fig. 1 Observed (red dots), calculated (black line), and difference (blue line) diffraction patterns of [(C2H5)4N]FeCl4 compound. Vertical markers give Bragg peak positions. | ||
UV/vis spectroscopy
To explore the semiconducting properties of [(C2H5)4N]FeCl4 compound, a solid-state UV-vis spectroscopy analysis was performed. The experimental absorption spectrum of the [(C2H5)4N]FeCl4 complex is plotted in Fig. 2. Strong absorption is observed in the spectral region roughly between 200 and 400 nm then it decreases sharply from 400 to 500 nm, thus indicating the presence of the band gap.31 The absorption bands are characteristic of the electronic transitions within the inorganic part ([FeCl4]− anion), rather than the cation group, since the organic molecules are transparent in the visible spectral range.32 The five characteristic bands located at 232, 300, 349, 398 and 449 nm are commonly assigned to [FeCl4]− anion.33,34 The other bands observed at 535, 610, 690 and at 737 nm, assigned to 6A1 → 2T1(a), 4E(b) (6A1 → 4T2(b)), 6A1 → 4A2, 6A1 → 4T2(a) and 6A1 → 4T1(a) transitions respectively, are characteristic of the [FeCl4]− anion in a tetrahedral geometry.35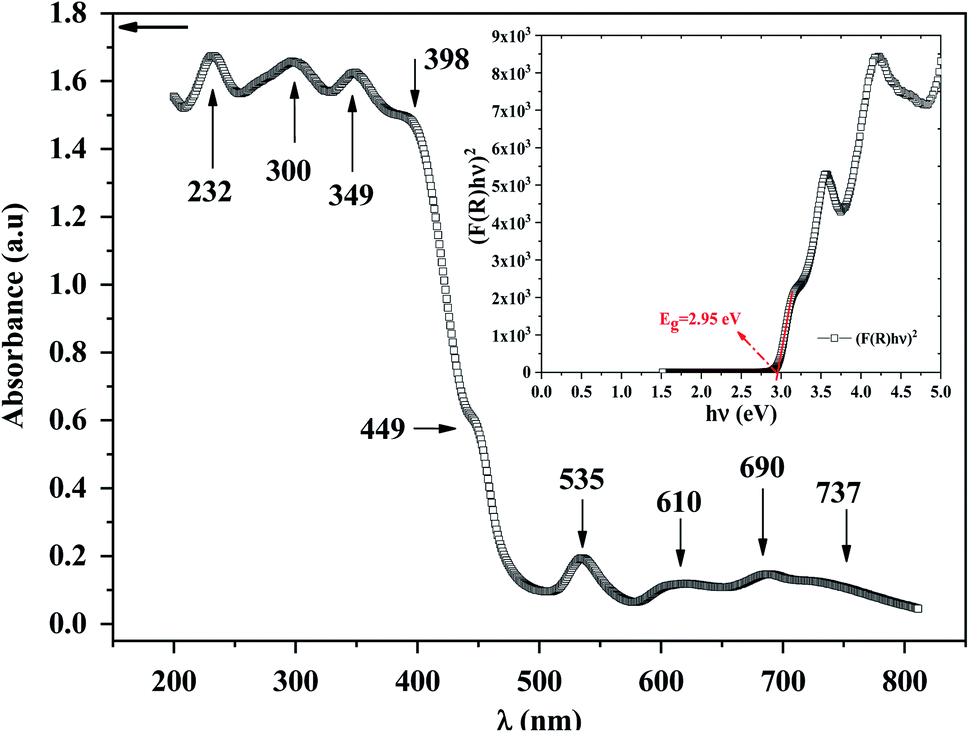 | ||
| Fig. 2 UV-vis absorption of [(C2H5)4N]FeCl4 compound. Insert: the Tauc plot. | ||
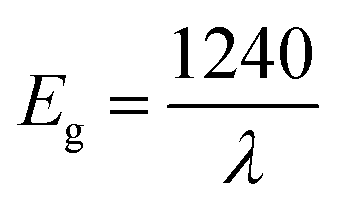
According to R. E. Marotti et al.36 and R. Henríquez et al.,37 the shoulders which appear in the reflectance spectrum R occur at wavelengths corresponding to the optical gap. The shoulders can be highlighted by calculating the first derivative (1/R)(dR/dλ). This magnitude variation as a function of the wavelength is presented in Fig. S1.† The presence of a strong peak centered at 421 nm allows to estimate the energy of the optical gap at 2.95 eV according to the relationship between Eg and λ:
 | (1) |
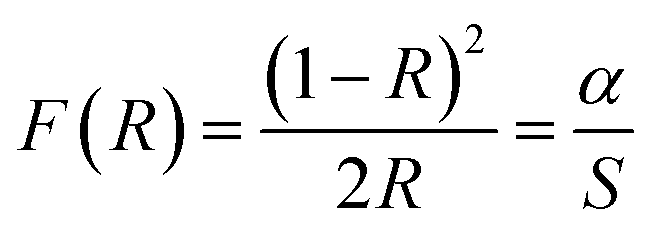
The gap energy Eg of materials is also linked to the absorption coefficient (α) by the following Tauc relation:38
| αhν = A(hν − Eg)n | (2) |
 | (3) |
Using both the K–M function and the Tauc equation, we get:
 | (4) |
In inset Fig. 2, the x-intercept of the linear region of the curve (F(R)hν)2 occurs at 2.95 eV. This value is very close to the one obtained by Marotti method. Such energy gap value, significant light absorption in the visible range and indicates that of this semi-conducting [(C2H5)4N]FeCl4 compound is more appropriate for photocatalysis process using blue radiation. Inlike TiO2, which is widely used as heterogeneous catalysis with band gap energy of 3.2 eV (ref. 40) and requiring UV radiation, [(C2H5)4N]FeCl4 has a considerable advantage in the field of photocatalysis since visible light can be used. [(C2H5)4N]FeCl4 which is insoluble in toluene functions as a photocatalyst by dissociating chlorine atoms, which abstracts hydrogen from toluene, and photooxidation only occurs to the extent that benzyl alcohol and benzaldehyde.20 This low cost compound has a potential to lead the photooxidation of other hydrocarbons and therefore it can be an important material in the synthesis of pharmaceuticals (alcohols).
Thermal analysis and temperature-controlled X-ray powder diffraction
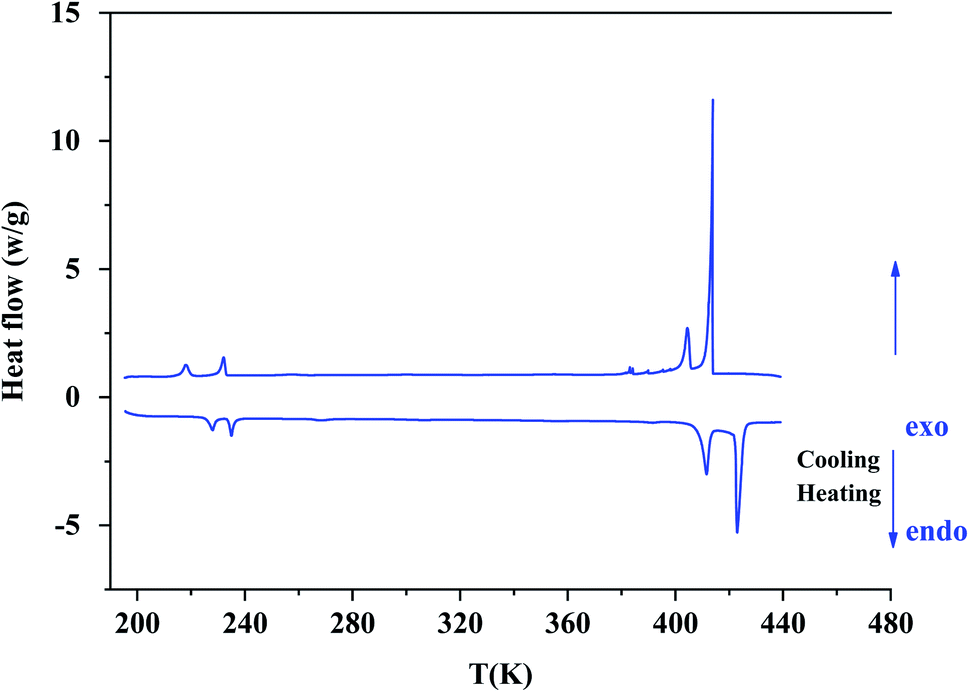
According to Differential Scanning Calorimetry (DSC) data shown in Fig. S2,† it appears on the first heating/cooling run a large endothermic peak around 373 K which is no longer observed in the second run. Because chlorides are sensitive to moisture, water molecules can be easily adsorbed onto the surface of crystals. This large endothermic peak is thereby ascribed to a dehydration of [(C2H5)4N]FeCl4 sample. XRPD patterns collected at room temperature before and after a dehydration of the sample at 373 K (Fig. S3†) show that the crystal structure is preserved since no trace of secondary phase is detected. So, all DSC thermograms, Raman spectra and XRPD patterns analyzed hereafter were recorded after first dehydrating the sample at 373 K (i.e. during a second heating).On DSC thermograms displayed in Fig. 3, the sample exhibits upon the second heating run eight endothermic anomalies at 228, 235, 268, 306, 355, 392, 412 and 423 K. Only four of these anomalies were previously reported in literature (i.e. 228, 235, 412 and 423 K).23,25–27 The sharp and intense endothermic peak at 423 K is associated with a high entropy value (ΔS = 22.16 J K−1 mol−1) which is comparable to entropy values measured during solid-plastic transition of crystals such as [(CH3)4N]FeCl4 (ΔS = 13.5 J K−1 mol−1),24, [(CH3)4N]FeBrCl3 (ΔS = 15.6 J K−1 mol−1),21, [(C2H5)4N]BF4 (ΔS = 22.0 J K−1 mol−1)41 and (C2H4N3)(C4F9SO3) (ΔS = 26.0 J K−1 mol−1).42 The endothermic peak at Tt = 412 K, slightly less intense than the peak at 423 K, was only observed upon the second heating run, that is to say after dehydrating the sample. Upon the second cooling down, two exothermic peaks are observed at 414 and 404 K revealing that these two high-temperature phase transitions are reversible in nature. A second series of DSC analysis was carried out in the temperature range 193–406 K (below the solid-plastic transition). The corresponding DSC thermograms are displayed in Fig. 4. By discarding the first heating–cooling run used to dehydrate the sample (as previously mentioned), the same six peaks are still detected upon second heating run and the same number at the next cooling (Table 1). These six phase transitions are therefore reversible in nature. A total of eight phase transitions is evidenced by DSC analysis (Table 2) which implies the existence of nine crystal phases. The phase transition nature are identifying using the Boltzmann equation ΔS = R ln(N), where R is the gas constant and N represents ratio of the number of respective geometrically distinguishable orientations.43 An order–disorder transition can be interpreted if the N value is greater than two (N > 2).
 | ||
| Fig. 3 The second heating/cooling run for [(C2H5)4N][FeCl4] compound in the temperature range from 193 K to 443 K. | ||
 | ||
| Fig. 4 The DSC plot for [(C2H5)4N][FeCl4] compound in the temperature range from 193 K to 406 K. | ||
| Run 2 | Run 3 | ||
|---|---|---|---|
| Heating (K) | Cooling (K) | Heating (K) | Cooling (K) |
| 230 | 216 | 230 | 216 |
| 236 | 230 | 236 | 230 |
| 278 | 262 | 278 | 262 |
| 309 | 289 | 309 | 288 |
| 318 | 304 | 317 | 304 |
| 396 | 385 | 396 | 385 |
| Heating | Cooling | ||||||
|---|---|---|---|---|---|---|---|
| T (K) | ΔH (J mol−1) | ΔS (J mol−1 K−1) | N | Transition nature | T (K) | ΔH (J mol−1) | ΔS (J mol−1 K−1) |
| a *: not purely order disorder transition, +: order disorder transition. | |||||||
| Fig. 2(a) [193 K–443 K] (Run 2) | |||||||
| 228.02 | 1241.55 | 5.44 | 1.92 | * | 218 | 1250.68 | 5.74 |
| 235 | 1193.36 | 5.08 | 1.84 | * | 232.12 | 1408.49 | 6.07 |
| 268.36 | 366.26 | 1.36 | 1.18 | * | 257.6 | 199.77 | 0.77 |
| 306.42 | 189.69 | 0.62 | 1.08 | * | 300.68 | 119.10 | 0.40 |
| 355 | 107.33 | 0.30 | 355 | 221.01 | 0.62 | ||
| 391.6 | 177.24 | 0.45 | 1.06 | * | |||
| 411.57 | 5302.84 | 12.88 | 4.70 | + | 404.49 | 3370.26 | 8.33 |
| 422.94 | 9370.72 | 22.16 | 14.37 | + | 413.88 | 12![[thin space (1/6-em)]](https://www.rsc.org/images/entities/char_2009.gif) 925.25 925.25 |
31.23 |
|
|||||||
| Fig. 2(b) [193 K–406 K] (Run 2) | |||||||
| 229.59 | 1853.13 | 8.07 | 2.64 | + | 215.64 | 1950.20 | 9.04 |
| 235.88 | 1618.96 | 6.86 | 2.28 | + | 230.39 | 2050.75 | 8.89 |
| 278.04 | 56.60 | 0.20 | 1.02 | * | 262.17 | 81.80 | 0.31 |
| 309.22 | 22.93 | 0.07 | 1.00 | * | 304.1 | 48.71 | 0.16 |
| 318.45 | 35.40 | 0.11 | 1.01 | * | |||
| 396.35 | 96.68 | 0.18 | 1.02 | * | 385.3 | 66.33 | 0.17 |
|
|||||||
| Fig. 2(b) [193 K–406 K] (Run 3) | |||||||
| 229.59 | 1839.45 | 8.01 | 2.62 | + | 215.64 | 1962.99 | 9.10 |
| 235.88 | 1679.95 | 7.12 | 2.36 | + | 230.39 | 2041.77 | 8.86 |
| 278.04 | 59.34 | 0.21 | 1.03 | * | 262.17 | 74.12 | 0.28 |
| 309.04 | 21.78 | 0.07 | 1.00 | * | 304.25 | 50.54 | 0.17 |
| 317.3 | 47.53 | 0.15 | 1.02 | * | |||
| 396.35 | 76.82 | 0.19 | 1.02 | * | 385.3 | 55.41 | 0.14 |
Temperature-controlled X-ray diffraction patterns were collected in the temperature range 298–383 K in order to detect any change in the crystal structure caused by the transitions detected below 383 K by DSC. No measurements were carried out above 383 K in order to avoid any reaction of the sample with the glass ceramic holder cup. The refinement of each XRPD pattern was carried out by the Le Bail method. Successively, the hexagonal cell parameters determined from the refinement of a lower temperature XRPD pattern was used as starting values for the refinement of the next higher temperature one. The thermal evolutions of the XRPD patterns together with those of the cell parameters a and c are displayed in Fig. 5. No change in the shape of peaks or appearance of new ones is noted in the collected XRPD patterns as function of temperature. This suggests that the transitions at 309, 318 are likely due to weak displacements/reorientations of the organic [(C2H5)4N]+ cation in the crystal structure of [(C2H5)4N]FeCl4. Both cell parameters exhibit a linear expansion with a slight departure from linearity above 379 K. The thermal expansion coefficients along the a and c crystallographic axes are 8.41 × 10⁻⁴ K−1 and 1.83 × 10⁻³ K−1 in the range 298–378 K, respectively. The thermal expansion along the [001] direction is much larger in magnitude than the one in the basal (a,b) plane.
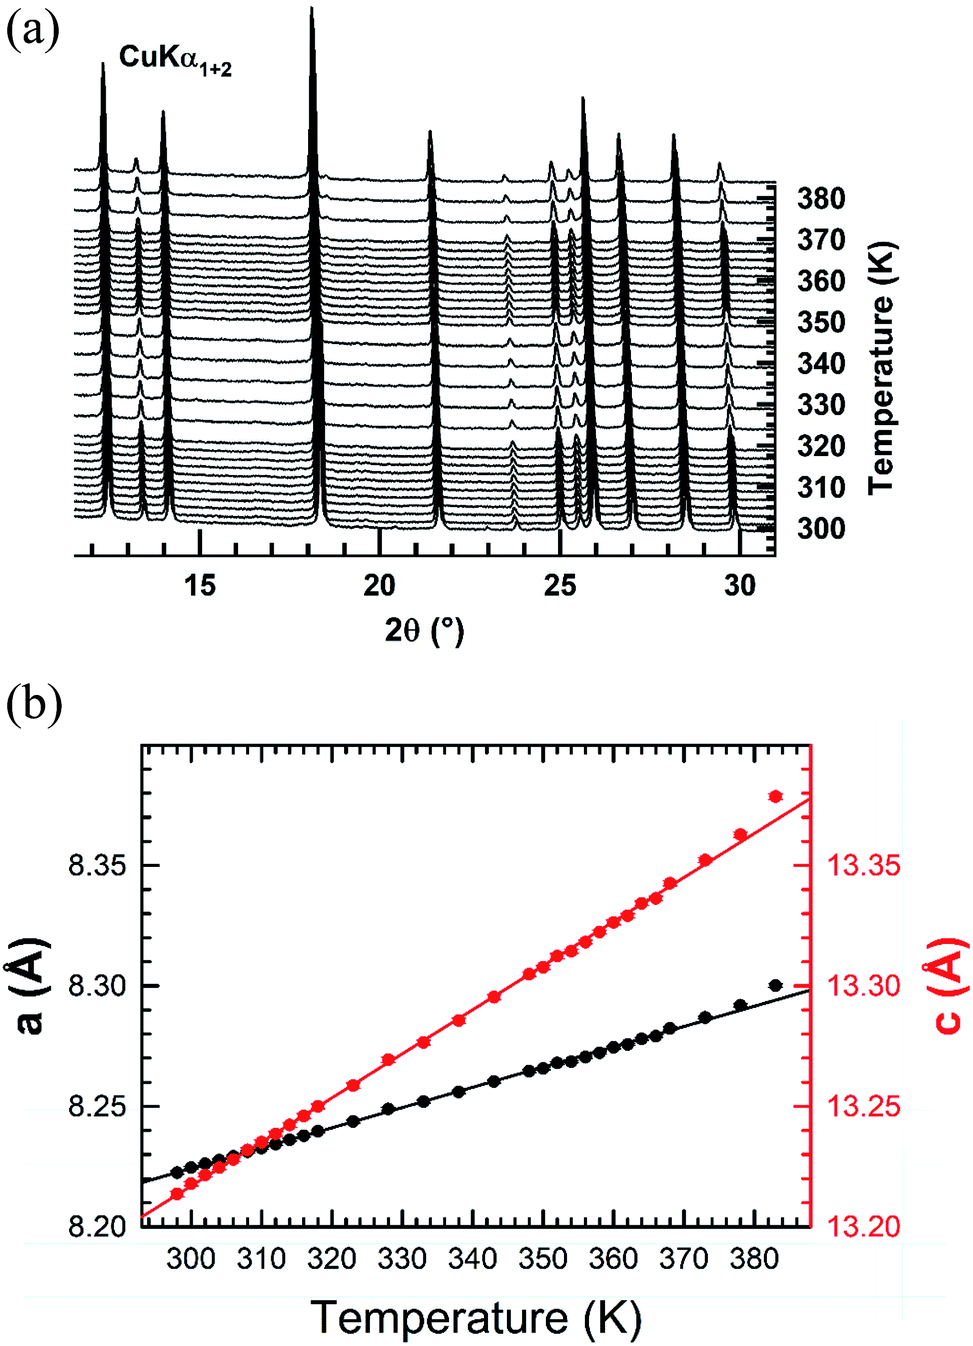 | ||
| Fig. 5 (a) XRPD patterns collected upon heating in air from RT to 383 K after in situ dehydrating the [(C2H5)4N]FeCl4 compound at 373 K. (b) Thermal evolutions of the hexagonal cell parameters a and c of the [(C2H5)4N]FeCl4 compound determined from the refinement of the XRPD patterns by the Le Bail method. | ||
Temperature evolution of the Raman spectra
At room temperature, vibrational band assignments (Table 3) were performed based on previous reported data.44–46 The vibrational modes of [FeCl4]− anion appear in the 70–400 cm−1 wavenumber range and the bands located above 400 cm−1 can be attributed to the vibrational modes of the cationic part ([(C2H5)4N]+).| Raman position (cm−1) | Vibration assignment | Intensity |
|---|---|---|
| a νs: symmetric stretching; νs: asymmetric stretching; δs: symmetric bending; δs: asymmetric bending; t: twisting; ρr: rocking, τ: torsion, β: bending. | ||
| [FeCl4]− | ||
| 120 | δs(FeCl4) | Strong |
| 140 | δas(FeCl4) | Medium |
| 331 | νs(FeCl4) | Very strong |
| 380 | νas(FeCl4) | Weak |
| 392 | νas(FeCl4) | Medium |
|
||
| [(C2H5)4N]+ | ||
| 470 | δ(C–C–N) | Weak |
| 517 | — | Very weak |
| 552 | δs(C–C–N) | Very weak |
| 664 | νs(NC4) | Medium |
| 792 | νa(NC4) | Very weak |
| 892 | ν(C–C) | Medium |
| 1008 | νs(C–C–N) | Weak |
| 1032 | νs(C–C–N) | Weak |
| 1069 | νa(C–C–N) | Medium |
| 1079 | νa(C–C–N) | Weak |
| 1121 | β(C–C–H) | Weak |
| 1148 | β(C–C–H) | Very weak |
| 1187 | ρ(CH3) | Very weak |
| 1303 | τ(CH2) + ω(CH2) | Weak |
| 1354 | δs(CH3) | Weak |
| 1400 | δa(CH3) | Weak |
| 1441 | δ(CH2) | Weak |
| 1461 | δ(CH2) | Medium |
| 2890 | — | Weak |
| 2939 | — | Very weak |
| 2951 | νs(CH2) | Medium |
| 2980 | νa(CH2) | Medium |
| 2988 | νs(CH3) | Medium |
| 2998 | — | Medium |
| 3020 | νa(CH3) | Weak |
| 3112 | — | Very weak |
| 3129 | — | Weak |
Based on DSC results and the XRPD patterns, the crystals are heated beforehand to 373 K then cooled down to room temperature before studying the phase transitions by Raman spectroscopy. No change was observed in the Raman spectra after sample dehydration (Fig. S5†).
In order to highlight the reorientations of organic cations involved during the different phase transitions, a large number of spectra (50 spectra) were recorded in the temperature range 294–443 K. For more clarity, Fig. 6 presents only selected spectra recorded on the three wavenumber ranges ([2700–3100 cm−1], [500–1700 cm−1] and [70–450 cm−1]). The temperature dependence of the peak positions and the full width at half maximum of the main Raman bands are illustrated in Fig. 7 and 8.
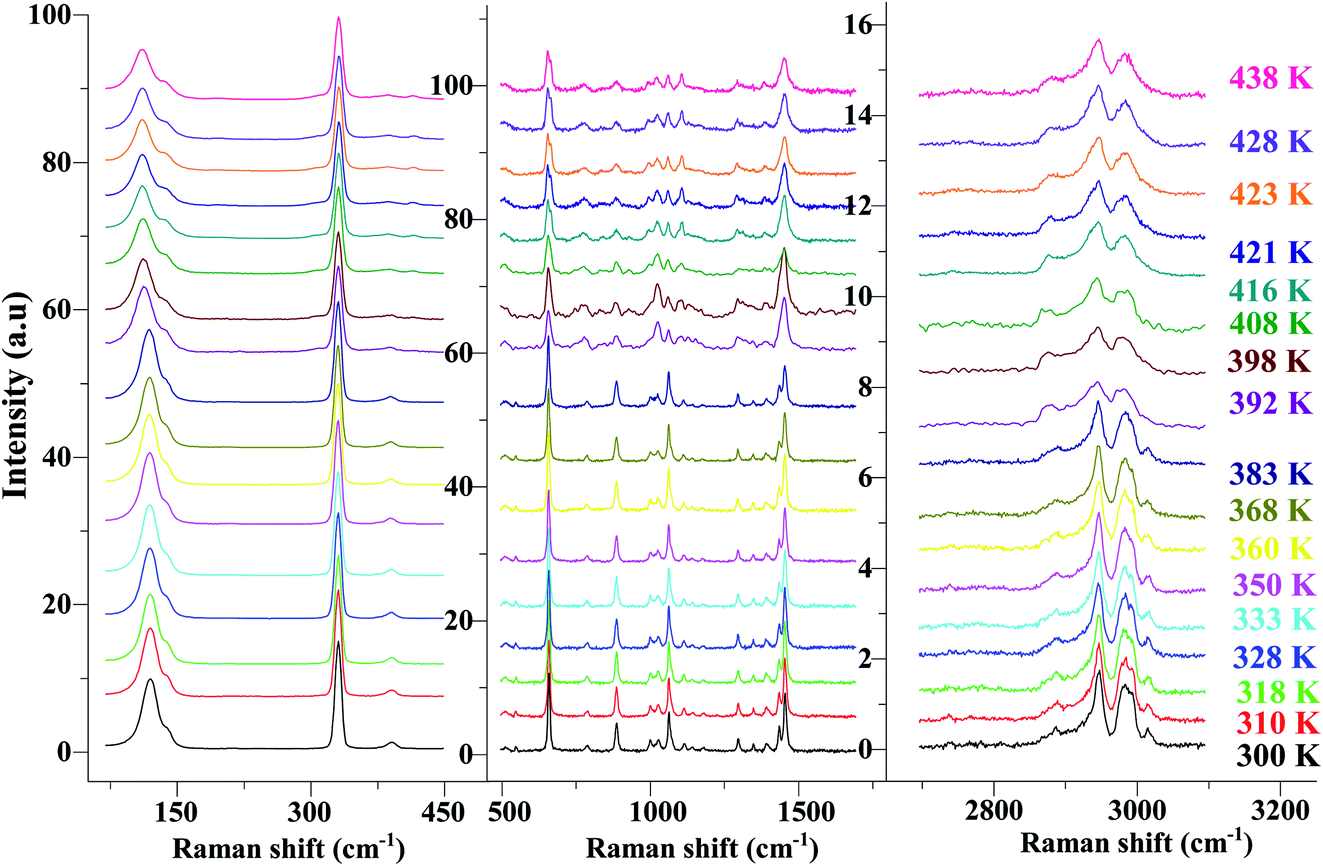 | ||
| Fig. 6 Temperature evolution of the Raman spectra for selected spectral ranges [70–450 cm−1], [500–1700 cm−1] and [2700–3200 cm−1]. | ||
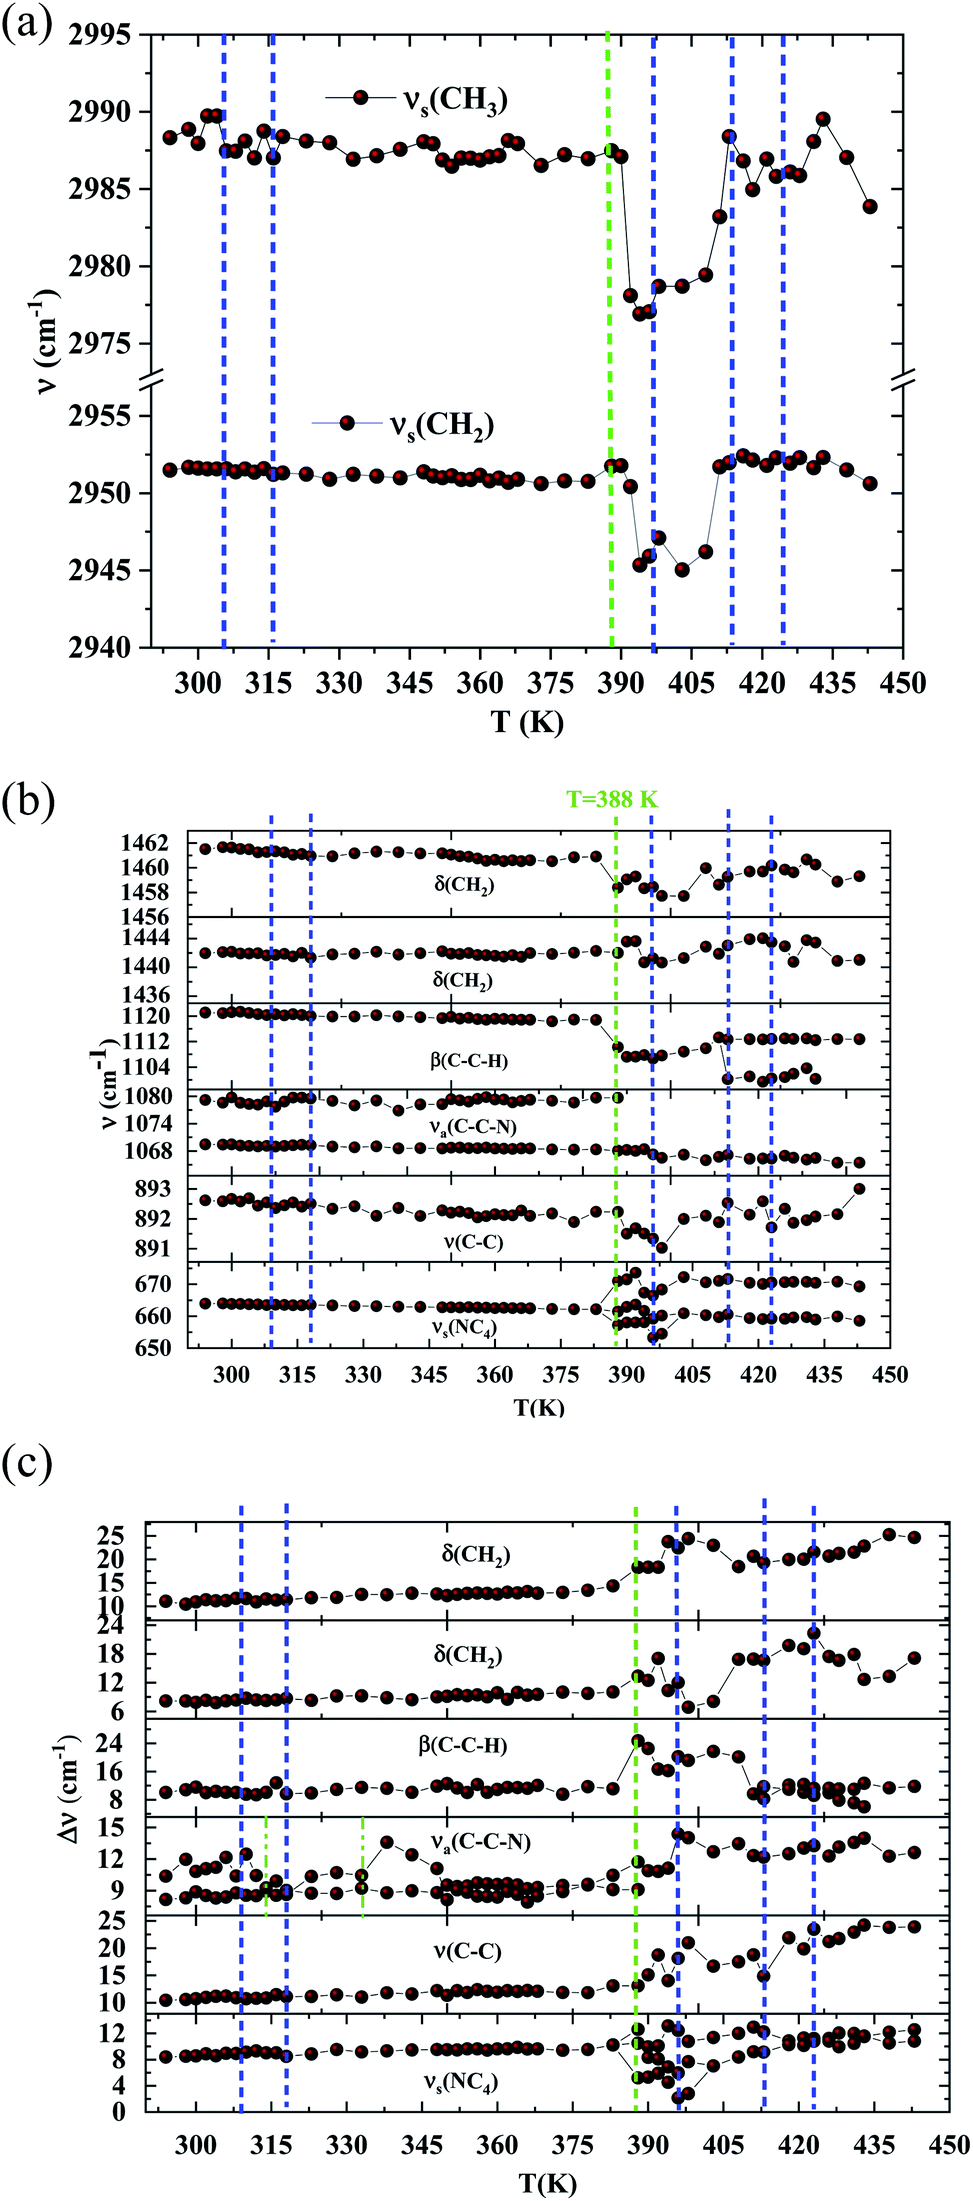 | ||
| Fig. 7 (a) Raman wavenumbers of the CH2 and CH3 asymmetric stretching versus temperature. (DSC transitions in blue vertical lines. The green line shows a Raman transition which is not detected by the DSC). (b) Raman wavenumbers of the organic part versus temperature. (DSC transitions in blue vertical lines. The green line shows a Raman transition which is not detected by the DSC). (c) Half widths of the Raman bands associated with [(C2H5)4N]+ versus temperature. (DSC transitions in blue vertical lines. The green line shows a Raman transition which is not detected by the DSC). | ||
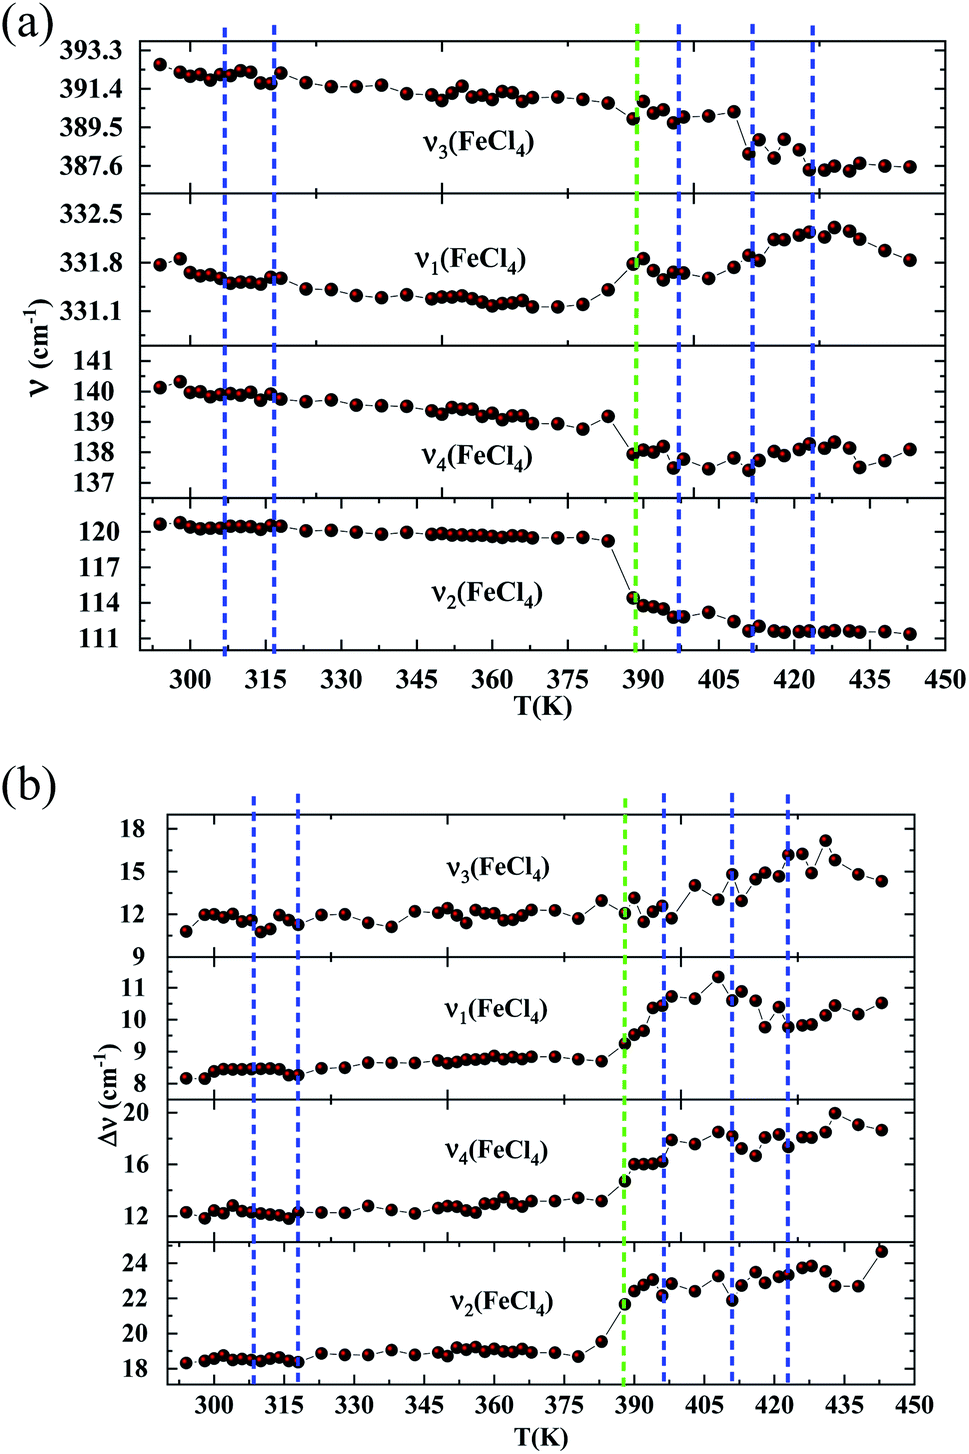 | ||
| Fig. 8 (a) Raman wavenumbers of the inorganic part versus temperature. (DSC transitions in blue vertical lines. The green line shows a Raman transition which is not detected by the DSC). (b) Half widths of the Raman bands associated with [FeCl4]− versus temperature. (DSC transitions in blue vertical lines. The green line shows a Raman transition which is not detected by the DSC). | ||
The bands observed between 2800 and 3200 cm−1 are commonly assigned to the symmetric and antisymmetric vibration of CH2 and CH3 groups. The two strongest bands, located at 2951 and 2988 cm−1 show changes in position with temperature since a shift of about 5 cm−1 has been observed between 388 and 413 K (Fig. 7(a)).
The Raman bands assigned either to the stretching or the deformation vibrations of the alkyl chains of the tetraethyl-ammonium cation [(C2H5)4N]+ are also sensitive indicators to phase transitions. The band at 665 cm−1, assigned to νs(NC4), is first divided into three bands at 388 K and merged into two lines at 396 K. The vibrational modes at 892 cm−1 (ν(C–C)), 1441 and 1461 cm−1 (δ(CH2)) show, respectively, a jump towards the high and low frequencies at the transition temperatures, associated with a variation of the full width at half maximum (Table 4). Another important spectral modification was observed at 388 K in the wavenumber range 1050–1100 cm−1 where two vibrational bands merged into a single one. The band at 1121 cm−1 assigned to β(C–C–H) show a shift of 9 cm−1 at 383 K before splitting into two bands around 413 K and a broadening of about 12 cm−1 between these two temperatures. Such results suggest a reorientation of the organic [(C2H5)4N]+ cation at 388 K and a more pronounced disordering of the alkyl chains above 416 K as confirmed by the broadening of the bandwidth of the C–C and C–C–N stretching modes.
| Tt (K) | T1 = 313 | T2 = 388 |
|
T3 = 413 | T4 = 423 | ||||||
|---|---|---|---|---|---|---|---|---|---|---|---|
| Wavenumber (cm−1) | Assignment | ν (cm−1) | Δν (cm−1) | ν (cm−1) | Δν (cm−1) | ν (cm−1) | Δν (cm−1) | ν (cm−1) | Δν (cm−1) | ν (cm−1) | Δν (cm−1) |
| a Tt: transition temperature; −: decreases; +: increases. | |||||||||||
| Inorganic part | |||||||||||
| 120 | ν2(FeCl4) | −5 | +3 | ||||||||
| 140 | ν4(FeCl4) | −2 | +2 | ||||||||
| 331 | ν1(FeCl4) | +0.7 | +0.5 | −0.7 | |||||||
| 392 | ν3(FeCl4) | −1 | −0.8 | +2 | −2 | −1 | |||||
|
|||||||||||
| Organic part | |||||||||||
| 664 | νs(NC4) | +9 | +3 | −1 | −1 | −1 | −1 | ||||
| −1 | −2 | +1 | |||||||||
| −5 | −5 | −5 | +5 | −1 | +1 | +1 | |||||
| 892 | ν(C–C) | −1 | +2 | +1 | +4 | +0.7 | +7 | −1 | +3 | ||
| −0.5 | +0.5 | ||||||||||
| 1069 | νa(C–C–N) | ||||||||||
| 1079 | νa(C–C–N) | −1 | −11 | +1 | −1 | +3 | −1 | +1 | −1 | ||
| 1121 | β(C–C–H) | +2 | −9 | +14 | +2 | +4 | −1 | +2 | −1 | ||
| −13 | −2 | −1 | |||||||||
| 1441 | δ(CH3) | +1 | +2 | +3 | −2 | −5 | +3 | −5 | |||
| 1461 | δ(CH2) | −3 | +4 | −1 | +6 | −2 | −2 | ||||
| 2951 | νs(CH2) | −5 | +5 | ||||||||
| 2988 | νs(CH3) | −2 | −5 | +5 | |||||||
The vibration modes of [FeCl4]− anions are other indicators sensitive to phase transitions. For instance, at 383 K the bands at 120 and 140 cm−1, attributed respectively to ν2(Fe–Cl and ν4(Fe–Cl), are shifted toward lower frequencies by 5 and 2 cm−1 (associated with a broadening of 3 and 2 cm−1), respectively. The band at 392 cm−1, assigned to ν3(Fe–Cl) shows a broadening of 2 cm−1 after the phase transition at 396 K and a shift of 2 cm−1 to lower wavenumber after the phase transition at 416 K. According to reported results on [(CH3)4N]FeCl4 compound,24 the series of modifications observed for [(C2H5)4N]FeCl4 around 383 K can be explained by a thermal activation of the rotation of [FeCl4]− anions. This may explain the slight deviation from linearity above 379 K for the two crystallographic parameters a and b.
From all these results, we demonstrated that the most significant vibrational modifications are observed by Raman spectroscopy between 383 and 416 K. The Raman shifts and the broadening of the vibrational modes are more pronounced in this temperature range due to the interactions between the [(C2H5)4N]+ cations and the internal vibrations of the [FeCl4]− anion. Above 416 K, our vibrational analysis confirms a disordered molecular structure of the hydrocarbon chains, characteristic of a plastic crystalline structure.
In order to study the reversibility of the different phase transitions, Raman spectra were recorded before and after heating to 373, 426 and 443 K. The increase in baseline intensity observed at 443 K (Fig. 9 and S4†) may be associated with a change in color of the material. Let us notice this increase was not observed after heating to 373 or 426 K and then cooling down to 298 K. What is certainly the most interesting result is that the different temperature cycles do not change the position of the vibration bands, nor the intensity ratio of the vibrational bands characteristic of organic (at 3000 cm−1) and inorganic (330 cm−1) components (inset of Fig. 9) once the sample is returned to 298 K.
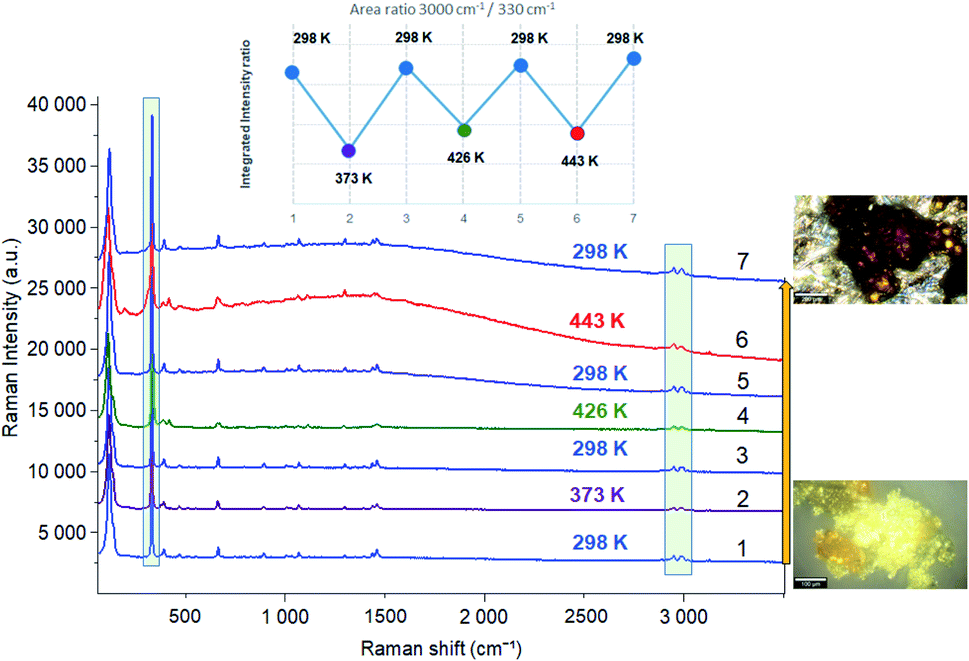 | ||
| Fig. 9 Raman spectra before and after heating to 373, 426 and 443 K. | ||
The solid–solid phase transition are likely to displacements/reorientations of the organic [(C2H5)4N]+ cation in the crystal structure of [(C2H5)4N]FeCl4. These molecular displacements are coherent with the electrical changes reported in our previous study.25 These switchable physical and/or chemical properties between two different states in response to temperature fluctuation could have potential applications in switches, sensors, memory devices, signal processing and so on.47,48
However, these switchable phase suffer small latent enthalpy changes limiting their applications as thermal energy storage material. In comparison, the plastic phase is accompanied by a much larger enthalpy change because the plastic phase transition often involves reorientational order–disorder and molecular displacements of the organic and inorganic components. It was shown that the hydrogen interactions between [FeCl4]− anions and [(C2H5)4N]+ cations induce a locally disordered molecular structure after 423 K characteristic of the plastic state. Such a result suggests that the [(C2H5)4NFeCl4] as a plastic crystal was superior than other usual molecular phase transition materials as thermal energy storage materials. Therefore, combining the new function thermal energy storage with the multiple switching and photo-calytic application in [(C2H5)4NFeCl4] plastic crystal is a novel approach to develop multifunctional molecular materials.
Conclusions
In summary, the [(C2H5)4N]FeCl4 compound was successfully prepared by slow evaporation solution growth method at room temperature. The significant light absorption in the visible range of this semi-conducting compound and a low gap energy of the order of 2.95 eV makes this material interesting in photocalytic domain with sunlight only.We report a plastic crystal which presents solid–solid transitions and a plastic transition at 120 K above the ambient temperature. The suitable phase transition temperature (423 K), large thermal energy storage capacity (9.37 kJ mol−1 for the latent heat storage, and totally ∼18 kJ mol−1 from 293 to 443 K), the high thermal stability, good thermal conductivity,25 easy preparation and processability suggest that the [(C2H4)4N]FeCl4 is an excellent candidate as thermal energy storage materials. The multi-switchable phases have been reported for the first time in the [(C2H4)4N]FeCl4 single-phase plastic crystal. These switchable physical states could have potential applications in switches, sensors, memory devices, and so on. This work not only exhibits the advantage of the molecular plastic phase transition materials as thermal energy storage materials but also provides a new design principle for multifunctional molecular material. Nevertheless, the magnetic and optical properties depending as a function of temperature in [(C2H5)4N]FeCl4 are perspectives in order to complete this work.
Conflicts of interest
All authors have no conflicts of interest.References
- J. M. García-Martínez and E. P. Collar, Polymers, 2021, 13, 86 CrossRef PubMed.
- S. H. Mir, L. A. Nagahara, T. Thundat, P. Mokarian-Tabari, H. Furukawa and A. Khosla, J. Electrochem. Soc., 2018, 265(8), B3137–B3156 CrossRef.
- M. Li, G. C. Xu, Y. Q. Zhang and W. B. Xin, Solid State Chem., 2020, 287, 121329–121333 CrossRef CAS.
- J. Timmermans, Phys. Chem. Solids, 1961, 18(1), 1–8 CrossRef CAS.
- J. Salgado-Beceiro, S. Castro-García, M. Sánchez-Andújar and F. Rivadulla, J. Phys. Chem. C, 2018, 122(48), 27769–27774 CrossRef CAS.
- J. Harada, T. Shimojo, H. Oyamaguchi, H. Hasegawa, Y. Takahashi, K. Satomi and T. Inabe, Nat. Chem., 2016, 8(10), 946–952 CrossRef CAS PubMed.
- E. Coronado and P. Day, Chem. Rev., 2004, 104(11), 5419–5448 CrossRef CAS PubMed.
- P. C. Howlett, Y. Shekibi, D. R. MacFarlane and M. Forsyth, Adv. Eng. Mater., 2009, 11(12), 1044–1048 CrossRef CAS.
- D. R. MacFarlane, J. Huang and M. Forsyth, Nature, 1999, 402(6763), 792–794 CrossRef CAS.
- I. De Pedro, A. García-Saiz, J. González, I. R. De Larramendi, T. Rojo, C. A. Afonso and J. R. Fernández, Phys. Chem. Chem. Phys., 2013, 15(30), 12724–12733 RSC.
- J. Salgado-Beceiro, J. M. Bermúdez-García, A. L. Llamas-Saiz, S. Castro-García, M. A. Señarís-Rodríguez, F. Rivadulla and M. Sánchez-Andújar, J. Mater. Chem. C, 2020, 8(39), 13686–13694 RSC.
- J. F. Silva, M. T. Rosado, M. J. Delaporte, M. R. Silva, M. F. M. Piedade, E. Dryzek and M. E. S. Eusébio, Cryst. Growth Des., 2019, 19(11), 6127–6135 CrossRef CAS.
- X. Liu, W. Xu, S. Xu, X. Yu, Y. Deng, X. Wu and Q. Wu, Inorg. Chem., 2020, 59(8), 5721–5727 CrossRef CAS PubMed.
- M. Li, G. C. Xu, W. B. Xin and Y. Q. Zhang, Eur. J. Inorg. Chem., 2020, 2020(7), 626–630 CrossRef CAS.
- W. Jiang, W. Zhu, H. Li, S. Xun, Z. Zhao and Q. Wang, RSC Adv., 2013, 3(7), 2355–2361 RSC.
- H. H. Andevary, A. Akbari and M. Omidkhah, Fuel Process. Technol., 2019, 185, 8–17 CrossRef CAS.
- A. Taubert, R. Löbbicke, K. Behrens, D. Steinbrück, L. Kind, T. Zhao and C. Janiak, Matters, 2018, 4(3), 1–6 Search PubMed.
- J. Zhang, W. Zhu, H. Li, W. Jiang, Y. Jiang, W. Huang and Y. Yan, Green Chem., 2009, 11(11), 1801–1807 RSC.
- K. M. Fahy, A. C. Liu, K. R. Barnard, V. R. Bright, R. J. Enright and P. E. Hoggard, Catalysts, 2018, 8(9), 403 CrossRef.
- K. R. Barnard, V. R. Bright, R. J. Enright, K. M. Fahy, A. C. Liu and P. E. Hoggard, Catalysts, 2018, 8(2), 79 CrossRef.
- S. Ouidri and H. Khalaf, J. Photochem. Photobiol., A, 2009, 207(2–3), 268–273 CrossRef CAS.
- C. F. Wang, X. W. Fan, Y. H. Tan, W. J. Wei and Y. Z. Tang, Eur. J. Inorg. Chem., 2019, 2019(24), 2907–2911 CrossRef CAS.
- D. Wyrzykowski, A. Pattek-Janczyk, T. Maniecki, K. Zaremba and Z. Warnke, J. Therm. Anal. Calorim., 2008, 91(1), 279–284 CrossRef CAS.
- J. Harada, N. Yoneyama, S. Yokokura, Y. Takahashi, A. Miura, N. Kitamura and T. Inabe, J. Am. Chem. Soc., 2018, 140(1), 346–354 CrossRef CAS PubMed.
- K. B. Brahim, M. Ben Gzaiel, A. Oueslati and M. Gargouri, RSC Adv., 2018, 8(71), 40676–40686 RSC.
- R. Navarro, J. A. Puertolas, F. Palacio and D. Gonzalez, Chem. Thermodyn., 1988, 20(3), 373–384 CrossRef CAS.
- M. Lutz, Y. Huang, M. E. Moret and R. J. Klein Gebbink, Acta Crystallogr., Sect. C: Struct. Chem., 2014, 70(5), 470–476 CrossRef CAS PubMed.
- A. Le Bail, H. Duroy and J. L. Fourquet, Mater. Res. Bull., 1988, 23(3), 447–452 CrossRef CAS.
- J. Rodríguez-Carvajal, Phys. B, 1993, 192(1–2), 55–69 CrossRef.
- Z. Warnke, E. Styczeń, D. Wyrzykowski, A. Sikorski, J. Kłak and J. Mroziński, Struct. Chem., 2010, 21(2), 285–289 CrossRef CAS.
- J. Yin, S. Shi, J. Wei, G. He, L. Fan, J. Guo and H. Zhou, RSC Adv., 2018, 8(36), 19958–19963 RSC.
- K. Y. Shi, L. L. Guo, H. X. Liu, L. Zou and S. F. Ying, Solid State Phenom., 2006, 111, 119–122 CAS.
- C. Zhou, X. Yu, H. Ma, X. Huang, H. Zhang and J. Jin, Carbohydr. Polym., 2014, 105, 300–307 CrossRef CAS PubMed.
- H. L. Friedman, J. Am. Chem. Soc., 1952, 74(1), 5–10 CrossRef CAS.
- T. Bäcker, O. Breunig, M. Valldor, K. Merz, V. Vasylyeva and A. V. Mudring, Cryst. Growth Des., 2011, 11(6), 2564–2571 CrossRef.
- R. E. Marotti, D. N. Guerra, C. Bello, G. Machado and E. A. Dalchiele, Sol. Energy Mater. Sol. Cells, 2004, 82(1–2), 85–103 CrossRef CAS.
- R. Henríquez, P. Grez, E. Munoz, H. Gómez, J. A. Badán, R. E. Marotti and E. A. Dalchiele, Thin Solid Films, 2010, 518(7), 1774–1778 CrossRef.
- (a) J. Tauc and A. Menth, J. Non-Cryst. Solids, 1972, 8, 569–585 CrossRef; (b) P. Madhu Kumar, S. Badrinarayanan and M. Sastry, Thin Solid Films, 2000, 358(1–2), 122–130 CrossRef.
- P. Kubelka and F. Munk, Z. Phys, 1931, 12, 593–601 Search PubMed.
- N. Rahimi, R. A. Pax, A. Mac and E. Gray, Solid State Chem., 2016, 44(3), 86–105 CrossRef CAS.
- K. Matsumoto, R. Nonaka, Y. Wang, G. Veryasov and R. Hagiwara, Phys. Chem. Chem. Phys., 2017, 19(3), 2053–2059 RSC.
- J. Luo, A. H. Jensen, N. R. Brooks, J. Sniekers, M. Knipper, D. Aili and J. Fransaer, Energy Environ. Sci., 2015, 8(4), 1276–1291 RSC.
- G. Q. Mei, H. Y. Zhang and W. Q. Liao, Chem. Commun., 2016, 52(74), 11135–11138 RSC.
- M. Mączka, A. Ciżman, R. Poprawski and J. Hanuza, Raman Spectrosc., 2007, 38(12), 1622–1627 CrossRef.
- M. A. Kandhaswamy and V. Srinivasan, Bull. Mater. Sci., 2002, 25(1), 41–45 CrossRef CAS.
- M. C. Smith, Y. Xiao, H. Wang, S. J. George, D. Coucouvanis, M. Koutmos and S. P. Cramer, Inorg. Chem., 2005, 44(16), 5562–5570 CrossRef CAS PubMed.
- M. A. Asghar, S. Zhang, T. Khan, Z. Sun, A. Zeb, C. Ji and J. Luo, J. Mater. Chem. C, 2016, 4(32), 7537–7540 RSC.
- Y. Liu, H. T. Zhou, S. P. Chen, Y. H. Tan, C. F. Wang, C. S. Yang and Y. Z. Tang, Dalton Trans., 2018, 47(11), 3851–3856 RSC.
Footnote |
| † Electronic supplementary information (ESI) available. See DOI: 10.1039/d1ra02475b |
| This journal is © The Royal Society of Chemistry 2021 |