
 Open Access Article
 This Open Access Article is licensed under a
 Creative Commons Attribution 3.0 Unported Licence
Flotation using sodium dodecyl sulphate and sodium lauroyl isethionate for rapid dewatering of Mg(OH)2 radwaste suspensions†
Alexander P. G. Lockwood *a,
Philip Kok Shuna,
Jeffrey Peakallb,
Nicholas J. Warrena,
Thomas Barbera,
Nabil Basharata,
Geoff Randallc,
Martyn Barnesc,
David Harbottlea and
Timothy N. Hunter*a
*a,
Philip Kok Shuna,
Jeffrey Peakallb,
Nicholas J. Warrena,
Thomas Barbera,
Nabil Basharata,
Geoff Randallc,
Martyn Barnesc,
David Harbottlea and
Timothy N. Hunter*a
aSchool of Chemical and Process Engineering, University of Leeds, Leeds, LS2 9JT, UK. E-mail: T.N.Hunter@leeds.ac.uk
bSchool of Earth and Environment, University of Leeds, Leeds, LS2 9JT, UK
cSellafield Ltd, Hinton House, Birchwood Park Ave, Birchwood, Warrington, WA3 6G, UK
First published on 24th May 2021
Abstract
Mg(OH)2 suspensions were floated utilising sodium dodecyl sulphate (SDS) and sodium lauroyl isethionate (SLI) collectors, for rapid dewatering of radwaste suspensions. Freundlich adsorption isotherms were first used to compare the adsorption densities of SDS and SLI on Mg(OH)2 surfaces, to determine the maximum monolayer coverage capacity, and were found to be 0.11 μmol m−2 at a dosed concentration of 172 μM for SDS and 0.05 μmol m−2 at a dosed concentration of 188 μM for SLI. The natural and salt induced coagulation kinetics of Mg(OH)2 were examined using static light scattering, where the influence of collector adsorption on particle size distributions was also investigated, to probe potential hydrodynamic limitations of flotation. Particle stabilised foam formation was then characterised using a Bikerman column test, where the dynamic foamability indices (DFIs) of SDS and SLI were determined to be 49 × 103 s L mol−1 and 321 × 103 s L mol−1 respectively. Flotation performance was measured, and a collection efficiency factor used to compare the solid–liquid separation ability of mixed 2.5 vol% suspensions with SDS or SLI, as well as MIBC frother. Optimal performance aligned with collector concentrations relating to predicted maximum monolayer coverage, and whilst both surfactants were effective, SDS systems performed better than SLI in all metrics. Recoveries of >80% of the Mg(OH)2 wastes were achieved, whilst only transferring 35% of the water mass at the optimum SDS dosed concentration of 82 μM, likely due to its denser surface adsorption and minimised lamella water entrainment.
Introduction
There is a critical need for new flexible and efficient dewatering systems to aid in the decommissioning of legacy nuclear processing facilities worldwide, where the transfer and treatment of multiphase sludge wastes, as part of risk and hazard reduction operations, are a significant area of concern.1–3 Challenges from particulate suspensions are ubiquitous in radioactive waste (radwaste) management, in particular as they often contain broad particle size distributions (PSDs) ranging from fine colloidal material to coarse particles and even fuel fragments,4–7 along with complex surface chemistries. It is extremely difficult to optimise dewatering processes for the separation of radwaste suspensions, due to their heterogeneity, especially when operations are subject to additional regulatory requirements, such as no moving parts and reduction of secondary waste generation.8A common regulatory driven approach for radwaste dewatering is gravitational thickening, where suspensions are subject to sedimentation, with the less turbid supernatant liquor being pumped back into storage ponds and the separated thickened sludges stored and finally encapsulated.4,9 Whist sedimentation is safe and straightforward, it is also slow, with considerable residence times being required in the thickening zones to remove finer particles.10 Given the strict timelines that most governments have for the processing and storage of legacy nuclear wastes, optimisation of these dewatering operations is thus a priority for the nuclear industry. To accelerate dewatering, there is current research into the application of polymeric flocculants to enhance suspension zonal settling rates, which have been shown to significantly decrease residence times in thickening operations.11–15 However, these processes have a number of drawbacks, in terms of their modification to waste structure and related downstream issues.1 In particular, the resultant fractal nature of these polymeric flocs can increase settled bed volumes, which may reduce the solid waste capacity of intermediate level waste containers for final geological disposal.16,17
As an alternative to gravitational separation, flotation has received increasing interest from researchers for radwaste separation, as it has been shown to be an extremely rapid dewatering technique, and is already commonly utilised in the minerals, water treatment and paper industries.18–26 Previous investigators have studied a range of variables that affect flotation performance, including particle contact angles,27–29 bubble size distribution,25,30 foam stability,18,31–34 suspension/collector concentration,29,35,36 collector adsorption density,23,35,37,38 collector hydrophobicity,39–41 particle coagulation and hydrodynamic consequences of variable PSDs.15,28,42,43 Research into flotation of Mg(OH)2, a corrosion product of the fuel cladding alloy at Sellafield,2,6 has received little interest, but similar mineral particulates have been shown to be effectively separated using flotation facilitated with anionic surfactant collectors, such as alkyl sulphates including sodium dodecyl sulphate (SDS).19,37,44
It is thus critical that before the deployment of flotation as a dewatering strategy to separate magnesium hydroxide based radwastes, research is undertaken to establish efficient collectors that are effective at hydrophobising Mg(OH)2 particles to allow adsorption onto foam interfaces. Additionally, the objective of flotation for dewatering purposes is not only to successfully remove particles through hydrophobic interactions, but to avoid excess water carry over, which would require secondary waste treatments. Therefore, flotation must be optimised for both particle removal and high dewatering ratios. Additionally, the adsorption dynamics of surfactant collectors onto Mg(OH)2 surfaces must be further understood to adapt for varying solid feed concentrations, as it would be expected that monolayer surfactant coverage conditions facilitate optimum recovery of Mg(OH)2. Given the impact of collectors and frothers on the foam stability and flotation performance in many mineral systems,31,33,45 a wide range of collector agents have been previously investigated. However, sodium lauroyl isethionate (SLI), which is an anionic surfactant consisting of an acid-ester sulphonate head group compared to the SDS sulphate head group,46 has not previously been used as a collector in flotation. Thus, it is proposed that an understanding of the differences in collector adsorption, particle coagulation and foamability between two anionic surfactants (SDS and SLI) is key in tailoring a flotation process for effective Mg(OH)2 radwaste dewatering.
Here, fine magnesium hydroxide (Mg(OH)2) suspensions were used as a radwaste analogue to UK legacy wastes composed of corroded magnesium alloy fuel cladding.4 The adsorption of SDS and SLI surfactants onto particle surfaces were characterised using total organic carbon analysis and fitted to heterogeneous Freundlich isotherms, as used in previous studies investigating the adsorption of surfactants onto mineral surfaces.38,47–49 The coagulation kinetics of sonicated Mg(OH)2 suspensions were also investigated using static light scattering and compared to their surfactant driven aggregation with increasing SDS and SLI concentrations, to determine the collector's effect on particle size distributions. The foamability of particle stabilised suspensions was investigated using the well-established Bikerman column test,33,41,50 to calculate the gas retention time and dynamic foamability indices (DFIs) of the particle-surfactant systems, in comparison to non-ionic methyl isobutyl carbinol (MIBC) frother. Finally, the flotation performance of the two surfactant systems was analysed using particle and water mass recovery metrics to calculate residual cell concentrations post-flotation, using a collection efficiency factor incorporating dewatering ratios. The flotation was then holistically analysed by comparing the monolayer surface coverage and resultant hydrophobicity to particle coagulation, foamability and the dewatering efficiency through flotation.
Experimental
Materials
Versamag Mg(OH)2 (Martin Marietta, US) was used for all experiments. Versamag is a fine, white precipitated powder with a solubility of 6.9 mg L−1 at pH 10.1 in water,51 and has been previously characterised by Lockwood et al.12 It is noted that suspensions self-buffer at pH 10–11, due to its increased solubility at lower pHs. Versamag was shown by Lockwood et al.12 via electrophoresis to have a surface potential of ∼12 mV and a specific surface area of 8 m2 g−1 at the self-buffering pH of ∼10.5. Anionic surfactants were selected as collectors as they have been shown to have an affinity to electrostatically adsorb to the surface of positively charged particles.22,25,44,52 Solid sodium dodecyl sulphate (SDS) (TOKU-E, ≥99% pure), with a reported critical micelle concentration (CMC) of 8.2 mM,46 was dissolved in 0.5 L of Milli-Q™ water to make up a stock solution of 16.4 mM. This solution was stored in cleaned polypropylene containers and diluted with further Milli-Q™ water accordingly for experiments, as used in various previous flotation studies.19,22,37,38 Sodium lauroyl isethionate (SLI) (>98% purity), with a recorded CMC of 5.4 mM,46 was synthesised and crystallised via the methodology outlined by Jeraal et al.46 It was then dissolved in Milli-Q™ water to make a stock solution of 10 mM, which was stored and sampled for various experiments similarly to the SDS. A stock solution of 100 ppm 4-methyl-2-pentanol (MIBC) (Sigma-Aldrich, 98%, density: 0.802 g mL−1) was also utilised in experiments. MIBC is commonly used as a frothing agent for foamability and dispersed air flotation tests.34,53 SDS, SLI and MIBC chemical formulas and structures can be found in Table 1.| Chemical | Formula | Purpose | Structure |
|---|---|---|---|
| Methyl isobutyl carbinol (MIBC) | C6H14O | Frother |  |
| Sodium dodecyl sulphate (SDS) | NaC12H25SO4 | Collector |  |
| Sodium lauroyl isethionate (SLI) | NaC14H27SO5 | Collector |  |
Particle size analysis
20 mL suspensions were prepared using 2.5 vol% Mg(OH)2 suspensions, and were dispersed using an ultrasonic bath (Clifton Sonic) for 20 minutes to breakup any preformed aggregates. The suspensions were then added to a Mastersizer 2000E (Malvern Panalytical Ltd) static light scattering instrument, using a Hydro 2000SM aqueous dispersion cell (external dimensions of 140 × 175 × 390 mm and sample volumes between 50–120 mL). The suspension PSDs were then monitored as a function of time at 900 rpm with KNO3 (Sigma Aldrich) background electrolyte at doses of 0, 1 × 10⁻³ and 1 × 10⁻² M KNO3, to observe the effect of salt concentration on Mg(OH)2 aggregation formation. KNO3 was selected as a simple surrogate for a range of electrolyte ions that are naturally present in the pond wasters, which are unlikely to specifically adsorb onto Mg(OH)2 surfaces. The investigation time was intrinsically limited as the Malvern Mastersizer 2000E instrument has an obscuration envelope in which particle size measurements are validly taken. As particles aggregate, the overall number of particles and thus concentration decreases, which reduces obscuration eventually to numbers below the instrument lower limit. To observe the effect of adsorbed collectors on particle aggregation, varying concentrations of collector between 0 and 1000 μM were then added to 2.5 vol% Mg(OH)2 suspensions and agitated using a magnetic stirrer for 20 minutes. The Mg(OH)2-collector suspensions were then added to the dispersion unit at 900 rpm, to ensure constant shear rates on the aggregated particulates, which could then be compared to the initial aggregation data without collector.FBRM measurement
As per the current authors previous methodology for performing FBRM analysis,12 in situ aggregate size determination was conducted using a Lasentec® Focused Beam Reflectance Measurement (FBRM) model PI-14/206 instrument (Mettler-Toledo) in macro mode. The reactor was set-up with the FBRM probe mounted at a 45° angle to the impeller shaft and 10 cm from the reactor vessel base within the mixing zone, to ensure representative flow of suspended particles past the measurement window.54 The chord length distribution (CLD) of the system was monitored after allowing a 1 L suspension of 2.5 vol% Mg(OH)2 to equilibrate under agitation at 300 rpm for 5 minutes. Chord length number distributions were then computationally translated to volume percentage spherical equivalent diameters, assuming floc sphericity, as outlined by Rhodes55 and used in the current authors previous work.12Collector adsorption onto Mg(OH)2
Suspensions of 2.5 vol% Mg(OH)2 and varying concentrations of collector ranging from 0.82 μM to 1000 μM, were prepared in centrifuge tubes of 15 mL with the required collector concentration of SDS or SLI diluted from the stock solutions. The suspensions were then agitated using a carousel mixer (Compact Star CS4) for 24 hours, to ensure equilibrium adsorption of the anionic collectors on the Mg(OH)2, before being centrifuged at 500 rpm for 4 hours to separate the particulates from the supernatant liquor. The supernatant liquor was then sampled using a needle and syringe through a 0.45 μm syringe filter to ensure no fine suspended material remained in the liquid. Remaining organic carbon concentration was determined using an IL550 Total Organic Carbon (TOC) analyser (Hach-Lange) and was translated to SDS and SLI concentrations using the stoichiometric ratios (see Table 1). Concentrations were quantified by comparing to pure collector solutions as benchmarks, where the difference in collector concentration was used to determine the amount of collector adsorbed onto the Mg(OH)2.Surfactant adsorption was analysed using the Freundlich adsorption isotherm, which is commonly used to measure the adsorption of collectors onto the surface of particles.47–49 The linear form is shown in eqn (1), where qe is the adsorption density of the collectors onto the Mg(OH)2 surface, and in this study was calculated in units of both mg g−1 and μmol m−2 (by dividing through by the relative molecular mass of the collector (Mr) and the specific surface area (As) of the particles, with As = 8 m2 g−1).12 Ce is the equilibrium concentration of collector in the aqueous medium, 1/n is the Freundlich constant, and is related to the adsorption energy, while kd is the adsorption affinity and essentially relates to the adsorption limit at infinitely small surfactant concentrations.
 | (1) |
Foamability tests
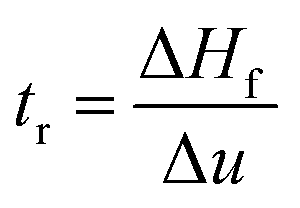
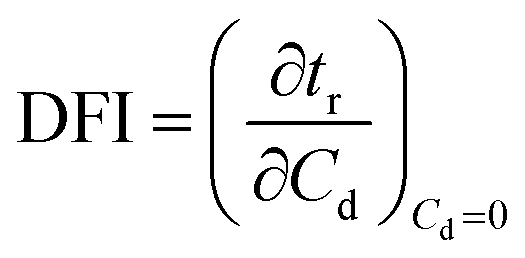
Dynamic foam stabilities of Mg(OH)2 collector mixtures and MIBC frother were investigated using a fritted glass burette with 19 mm internal diameter and 400 mm height, analogous to the Bikerman column experimental designs implemented by Gupta et al.,34 Laskowski and Cho30,33 and Hunter et al.,18 MIBC foamability tests were conducted by preparing five 35 mL samples of MIBC at dosages of 2, 10, 25, 50 and 100 ppm with 2.5 vol% Mg(OH)2 suspensions without collectors initially to determine a baseline foamability of the MIBC in the electrolyte background provided by the Mg(OH)2 semi-solubility. Foamability analysis was performed by combining frother (at 1 ppm) with 2.5 vol% Mg(OH)2 suspensions, along with SDS or SLI at various concentrations and superficial gas flow rates from 0 μM−1 to 250 mL min−1 at fixed 50 mL min−1 intervals. The height of the foam layer was recorded after reaching equilibrium, and the airflow was then increased. After the system re-equilibrated, the foam height from the liquid–foam interface was again measured, and the process was repeated until the foam height began to grow non-linearly against flow rate.Experiments were undertaken with varying dosed concentrations of SDS from 0.82 μM to 9.84 μM and SLI from 1 μM to 40 μM (noting these represented initial added concentrations) and were completed in triplicate. The retention time (tr), which is often referred to as the Bikerman coefficient,56,57 is established from the slope of the linear part of the dependence of the total gas volume in solution and foam, plotted with respect to gas flow rate (for increasing frother or collector concentrations). As the diameter of the Bikerman column is constant, measurements can be reduced to changes in foam height (Hf) and superficial air velocity (u) as shown in eqn (2). The dynamic foamability index (DFI) can then be determined using the procedure used by previous authors.33,34 The DFI allows comparison of collector and frother foamabilities independent of concentration, for a more robust assessment of flotation performance than retention time alone. The DFI is obtained from the tr values as a function of the dosed concentration (Cd) limiting slope, as Cd approaches 0, shown in eqn (3).
 | (2) |
 | (3) |
Floatation experiments
A bespoke floatation cell (210 mL, 65 mm ID; Fig. 1) was manufactured with an air inlet and a fritted glass base similar to the designs used by Zhang et al.53 and Prajitno et al.35 Here, 12.31 g of Mg(OH)2 was added to a measuring cylinder and dosed with 98 μM of MIBC as per this previous work,35,53 along with the required dose of SDS, and then made up to 210 mL with Milli-Q™ water. The cell was stirred for 20 minutes at 250 rpm to facilitate adequate adsorption of SDS to Mg(OH)2 surfaces. Airflow into the bottom of the cell was set at 0.1 L min−1 and the agitator speed was reduced to 100 rpm to minimise turbulence in the cell, preventing bubble disengagement. Froth generated above the air–water interface was collected through the outlet at the top of the vessel, and into an oven for 24 hours to evaporate the water component of the foam, leaving behind the recovered particulates. The recovered solids were then weighed to determine a number of performance indicators.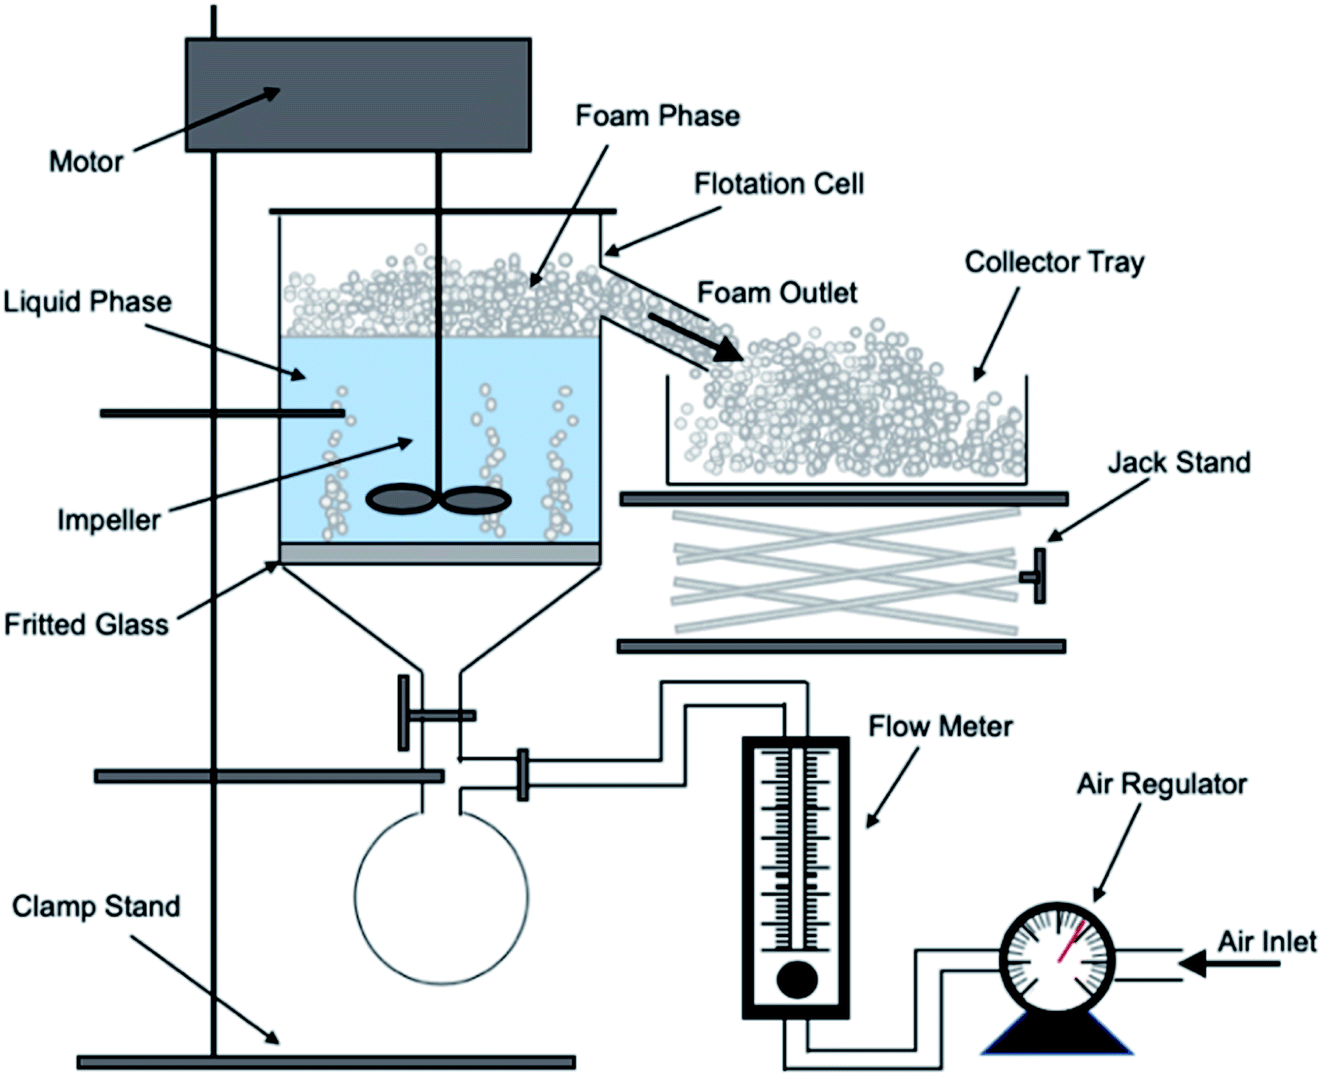 | ||
| Fig. 1 Schematic of batch flotation cell used for dispersed air flotation tests. | ||
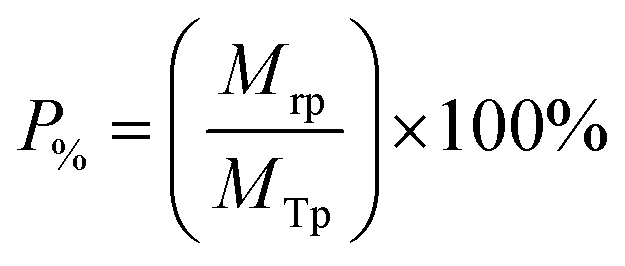
The Mg(OH)2 particle recovery percentage was measured, as shown in eqn (4), where the recovery percentage, P%, from Mg(OH)2 suspensions was calculated using a mass balance approach, as suggested by Zhang et al.53 It is the percentage of the mass of Mg(OH)2 recovered from the initial suspension in the foam phase, where Mrp is the recovered mass of Mg(OH)2 from the foam phase and MTp is the total initial mass of Mg(OH)2 in the suspension.
 | (4) |
The percentage of fluid remaining in the cell, W%, was also calculated from the measured mass of the water in the foam phase, Mrw, extracted from the flotation cell. It was obtained differentially from the mass of the aluminium collection container before and after evaporation, and divided by the total initial mass of water in the cell MTw, as given in eqn (5).
 | (5) |
The Mg(OH)2 particle concentration remaining in the flotation cell, C%, can then be determined from mass balance principles, as shown in eqn (6).
 | (6) |
The performance of the collectors were then compared using a collector efficiency factor, ξ, shown in eqn (7), which is a ratio of the percentage fraction of the particles-to-fluid recovered from the flotation cell. When ξ > 1, there are more Mg(OH)2 particles recovered than water by mass, when ξ = 1 there is equal particle-fluid extraction (entrainment) and when ξ < 1 there is more fluid being extracted than Mg(OH)2 particles (indicative of overly wet froths). The collection efficiency factor can then be used to determine the optimum dose of collector to maximise solid–liquid separation.
 | (7) |
Results and discussion
Scanning electron micrographs of Mg(OH)2 reveal a structure made up of aggregates of pseudo-hexagonal platelets as shown in Fig. 2A, similar to those reported by Johnson et al.9 and Maher et al.,7 and previous work by the current authors.12 This fused nanocrystallite platelet arrangement, gives rise to the large relative surface area in terms of that expected from spherical equivalent estimations,58 which is an important factor to consider when evaluating the adsorption density of collectors to the Mg(OH)2 surface.52 The Mg(OH)2 specific surface area was investigated previously12 using a Brunauer–Emmett–Teller (BET) approach, and was found to be ∼8 m2 g−1. Whilst this could be considered to be a high specific surface area, for particle agglomerates of micron size, Biggs et al.59 have observed similar Mg(OH)2 material as having a specific surface area of 15.43 m2 g−1, due to its fractal nature and high internal porosity.60 Similar mineral pseudo-hexagonal platelet material, such as aluminium hydroxide, have also been found to have correspondingly high BET surface areas, ranging from 1.5 m2 g−1, as observed by Adekola et al.,61 up to 91 m2 g−1 measured by Rosenqvist.62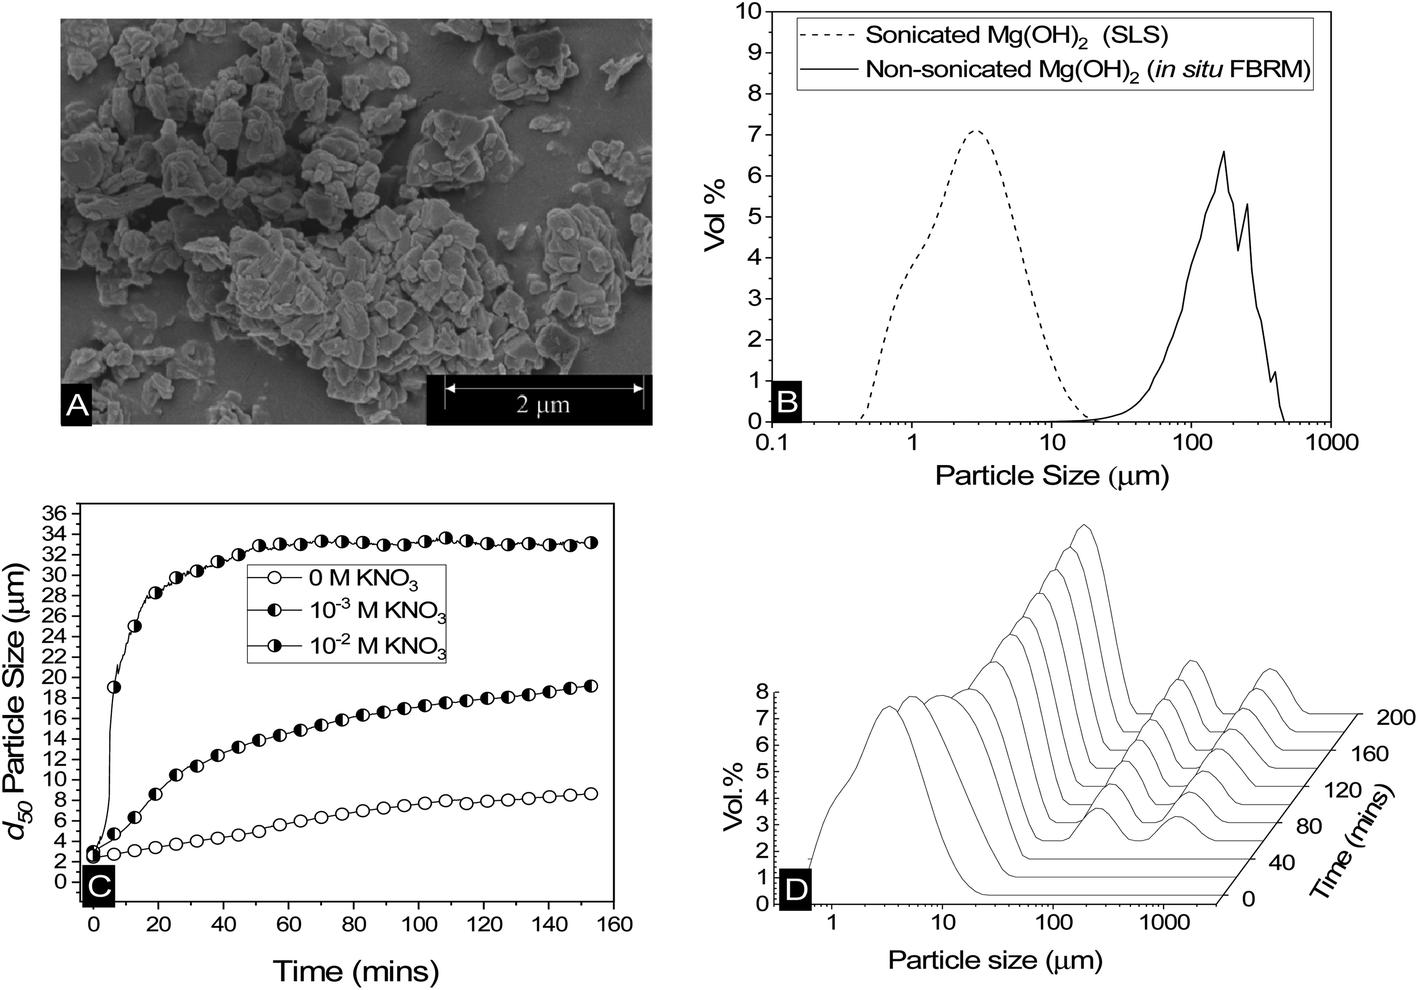 | ||
| Fig. 2 (A) Scanning electron micrograph of dry Mg(OH)2 powder. (B) Particle size distributions of sonicated Mg(OH)2 dispersions agitated at 900 rpm measured using static light scattering, and non-sonicated agitated at 300 rpm measured in situ using focused beam reflectance measurement. (C) Change in the 50th cumulative percentile (d50) particle size with time of Mg(OH)2 dispersions agitated at 900 rpm, along with the addition of 10−2 M and 10−3 M KNO3 at 900 rpm. (D) The change in the volume based (vol%) particle size distribution of Mg(OH)2 agitated at 900 rpm with time. | ||
The low surface potential of magnesium hydroxide (of ∼12 mV, as noted in the methodology12) has implications when considering colloidal stability of particulates, suggesting they may naturally aggregate.63 Aggregation may affect the accessible surface area in aqueous media, resulting in consequences for adsorption density.52 Additionally, increases in particle size distributions (PSDs) may potentially lead to hydrodynamic limitations in the flotation process.15,28 Therefore, a series of measurements were performed to understand particle size changes in dispersions. Fig. 2B shows the differences in PSDs of sonicated Mg(OH)2, using static light scattering, where the sample was dispersed in a small distribution cell at 900 rpm, with an approximate median particle size (d50) of 2–3 μm. Also shown in Fig. 2B is a non-sonicated dispersion, measured in situ, using the focused beam reflectance measurement (FBRM) technique, which presents a considerably larger range, with comparative d50 = 149 μm. Whilst these techniques are different (and noting the FBRM represents a volume based conversion from raw chord length distributions12) the significant disparities in PSDs indicate that Mg(OH)2 suspensions will naturally further aggregate under low shear conditions, due to their low zeta potential.63 Previous work by Johnson et al.9 on the same type of Mg(OH)2 also found naturally coagulated aggregates in the range of 150 μm, consistent with the FBRM data.
The change in the 50th cumulative percentile (d50) particle size with time of Mg(OH)2 suspensions is shown in Fig. 2C; these were also sonicated for 20 minutes to break up any preformed aggregates. The post-sonication re-aggregation of the sonicated sample can be observed by the change in d50 with time when added to the Mastersizer dispersion cell at 900 rpm, along with KNO3 electrolyte backgrounds of 10−3 M and 10−2 M. For all datasets, the d50 increased with time indicating different degrees of particle aggregation. The role of electrolytes in electric double layer compression, resulting in greater aggregation is well documented in previous literature,48,64–66 with the data in Fig. 2C following expected trends, where an increase in KNO3 concentration results in a greater degree and rate of aggregation.65,67
The impact of aggregation on polydispersity is shown in Fig. 2D in the form of PSDs of sonicated suspensions evolving over time. It is often difficult to completely understand the aggregation process when considering a single number to represent a whole particle size distribution, such as the d50. Therefore, an insight into the change in particle size dispersity and PSD transition to polymodality can provide important information on the aggregation mechanism. For times up to 40 minutes, there is a gradual shift in the PSD peaks to the right, indicating a gradual size increase (similar to that captured by Fig. 2C in increasing d50 values). At 40 minutes however, the emergence of two additional peaks in the region of ∼100–1000 μm is evident. The magnitudes of these additional peaks (vol%) increases with time, accompanied by a continuing shift to the right of the initial peak (∼0.1–20 μm). The emergence of the two additional peaks (∼100–1000 μm) does not visibly impact the trajectory of the d50 size increase with time (in Fig. 2C) as their relative magnitudes are much lower than that of the initial peak, and they also do not lead to significant skewing of d50 value (highlighting the limitations of using this single value). It is additionally noted that the relatively high shear rate in the instrument cell (900 rpm) may lead to continual aggregate breakage, reducing the development of these larger size peaks. It is also likely why large single macro-aggregate peaks are not observed, as evidenced with the in situ FRBM data (as these measurements were gained in a larger 300 rpm low-shear cell).
What is particularly important regarding the emergence of these additional peaks at ∼100–1000 μm at intermediate times, is the inference of the distinctive development of a new aggregation mechanism. The initial peaks (t < 40 min) indicate a particle-cluster aggregation mechanism, where the dispersed Mg(OH)2 gradually aggregates by a particle wise addition to developing Mg(OH)2 clusters. As time elapses and more of these clusters are formed, this results in more probabilistic cluster–cluster macro-aggregation,68,69 represented by the additional two peaks after 40 minutes. As time develops, these peaks overlap as can be observed in the 10−2 M KNO3 system in the ESI Fig. S1,† which displays more advanced aggregation within the time observed, due to the depletion of the electric double layer from the KNO3 elctrolytes.67 Finally, the PSD reaches an equilibrium, which is a function of the shear rate in the dispersion cell (i.e. greater shear reduces equilibrium particle size).12,17,70–73
Collector adsorption and effect on particle aggregation
The specific adsorption of SDS and SLI onto Mg(OH)2 as a function of concentration is shown in Fig. 3A(i) and (ii) presented as the logarithmic adsorption capacity, log(qe), plotted against the logarithmic collector equilibrium concentration, log(Ce), for SDS and SLI respectively. The linear form of the Freundlich adsorption isotherm (eqn (1)) was fitted to the data in two clear regions, which were assumed to represent monolayer and bilayer (ad micelle) regions respectively, commonly found with charged surfactant adsorption on solid surfaces.35,74 The associated Freundlich adsorption coefficients were extrapolated from the linear fittings and are displayed in Table 2. The intercept of the monolayer and bilayer Freundlich adsorption isotherms represents the collector equilibrium concentration, where the monolayer to bilayer transition is assumed to represent the maximum monolayer coverage adsorption density (denoted and
and  respectively). The corresponding initial collector dosage concentration representing this transition,
  , can be interpolated from the plot of initial dosed collector concentration, Cd, and the collector supernatant equilibrium concentration, Ce, (shown in Fig. 3B). The Freundlich adsorption isotherms have relatively good fits with R2 values ranging from 0.87 to >0.99, although the fits were notably better for the bilayer adsorption regimes, which is likely due to the lower experimental uncertainty of carbon concentration analysis at higher collector concentrations. A feature of the Freundlich adsorption model is that it is derived by assuming an exponentially decaying adsorption site energy distribution. As the Freundlich constant (1/n) that based on adsorption density increases, this represents a greater adsorption intensity on the Mg(OH)2 surface occurs with the bilayer.49
 | ||
Fig. 3 (A) Two region fitted Freundlich adsorption isotherm including both monolayer and bilayer adsorption profiles for (i) sodium dodecyl sulphate and (ii) sodium lauroyl isethionate collectors on Mg(OH)2. It is noted that  is the maximum monolayer collector adsorption density (monolayer to bilayer transition point). (B) Calculated equilibrium concentration, Ce, established from the dosed collector concentration (Cd) minus the amount of surfactant adsorbed. The monolayer–bilayer transition concentration is shown for both surfactants by interpolation. is the maximum monolayer collector adsorption density (monolayer to bilayer transition point). (B) Calculated equilibrium concentration, Ce, established from the dosed collector concentration (Cd) minus the amount of surfactant adsorbed. The monolayer–bilayer transition concentration is shown for both surfactants by interpolation. | ||
 is the maximum monolayer collector adsorption density (i.e. monolayer to bilayer transition point),
  and
and  are the collector supernatant equilibrium and initial dosed concentration respectively at the monolayer to bilayer transition point
| Isotherm value | Sodium dodecyl sulphate (SDS) | Sodium lauroyl isethionate (SLI) | ||
|---|---|---|---|---|
| Monolayer | Bilayer | Monolayer | Bilayer | |
| Freundlich R2 | 0.89 | 0.99 | 0.87 | 0.96 |
| Kd (mg g−1) | 3.21 × 10⁻² | 1.60 × 10⁻³ | 4.43 × 10⁻² | 1.21 × 10⁻⁴ |
| Kd (μmol m−2) | 1.39 × 10⁻² | 6.94 × 10⁻⁴ | 1.61 × 10⁻² | 4.39 × 10⁻⁵ |
| 1/n | 0.43 | 1.41 | 0.2 | 2.44 |
| n | 2.30 | 0.71 | 5.10 | 0.41 |
 (μmol m−2) (μmol m−2) |
∼0.11 | ∼0.05 | ||
 (mg g−1) (mg g−1) |
∼0.24 | ∼0.14 | ||
 (μM) (μM) |
∼111 | ∼95 | ||
 (mg g−1) (mg g−1) |
∼0.03 | ∼0.03 | ||
 (μM) (μM) |
∼172 | ∼188 | ||
 (mg g−1) (mg g−1) |
∼0.05 | ∼0.03 | ||
| Linear R2 | 0.98 | 0.99 | ||
By comparing the monolayer adsorption profiles for SDS and SLI, it is apparent that the adsorption intensity is greater for SDS than SLI, with corresponding 1/n values of 0.43 and 0.2 respectively. These 1/n values are similar to those observed by Yekeen et al.48 who investigated the adsorption of SDS onto kaolinite in the presence of Al2O3 and SiO2 nanoparticles. The maximum monolayer adsorption capacities  determined from the intercept of the monolayer and bilayer Freundlich adsorption isotherms of the SDS and SLI are ∼0.11 and ∼0.05 μmol m−2 respectively. These values are slightly higher than those observed by Yekeen et al.,48 who found maximum SDS adsorption onto Al2O3 nanoparticles to be ∼0.04–0.08 μmol m−2 (5.102 mg g−1, where As = 230–400 m2 g−1
![[thin space (1/6-em)]](https://www.rsc.org/images/entities/char_2009.gif) 48) where it is assumed the Al2O3 particles are similarly charged to the magnesium hydroxide (although specific chemical affinities may be different).
48) where it is assumed the Al2O3 particles are similarly charged to the magnesium hydroxide (although specific chemical affinities may be different).
When comparing SDS to SLI, it is noted that due to the acid-ester sulphonate head group, SLI has a lower hydrophilic head electron cloud density than SDS, which is due to the difference in chemical structure (see Table 1). The reduced electron density is due to SLI having an additional ethyl chain between the S and O (ergo isethionate functional group) unlike in the SDS (which has a sulphate head group). The increased hydrophilic head group size will act in conjunction with the longer hydrophobic chain length (which may induce steric hindrance) to overall reduce the maximum monolayer adsorption density compared to SDS, as observed in Fig. 3A(i) and (ii).
When considering the bilayer adsorption regimes, a critical characteristic is the adsorption intensity is greater than the monolayer regime, but contrary to the monolayer regime, the adsorption is noticeably greater for SLI than SDS in the bilayer region, likely due to its longer carbon chain leading to a greater degree of hydrophobicity. The sudden increase in adsorption intensity is caused from the formation of surface aggregates of the monolayer (hemimicelle) that are derived from the lateral interaction of hydrocarbon chains. This lateral attraction generates an additional driving force to superimpose the existing electrostatic attraction, causing a sharp increase in adsorption, due to the reduction in free energy that occurs by reducing the degree of H2O dipole orientation around exposed collector hydrophobic tails, thus forming a bilayer at a greater intensity than the initial monolayer.49,63,75–79
The effect of surfactants on the aggregation of sonicated Mg(OH)2 dispersions is presented as the volume based PSDs for Mg(OH)2 suspensions (initially sonicated to break up any preformed aggregates) dosed with collector concentrations ranging from 0–820 μM for SDS and 0–1000 μM for SLI (below both SDS and SLI CMCs) in Fig. 4. There are distinctive changes in the PSDs with varying doses, most noticeably at concentrations above the  max adsorption density values (determined in Fig. 3A for both systems, at ∼172 μM and ∼188 μM for SDS and SLI respectively).
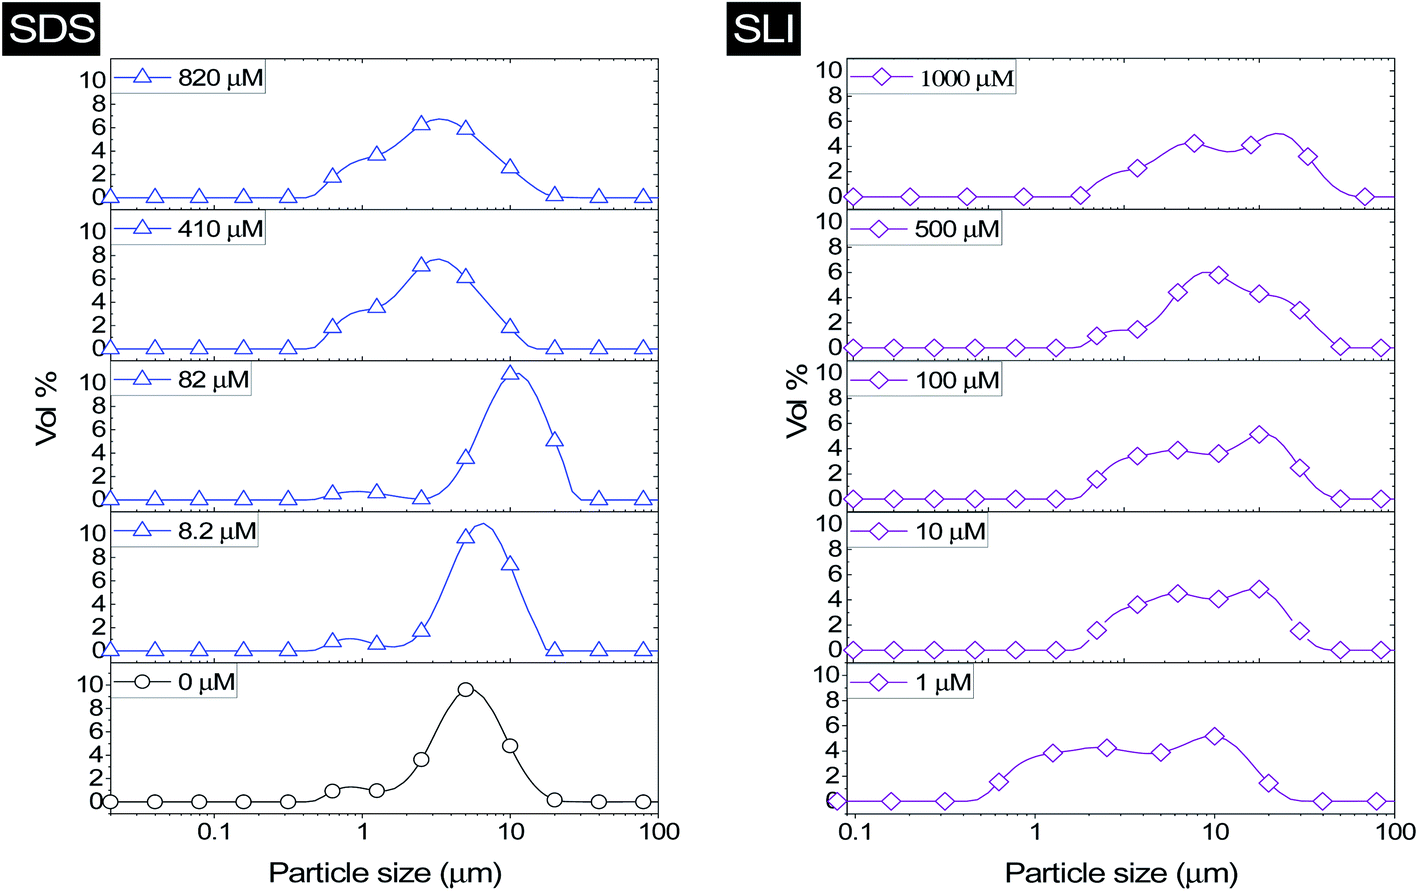 | ||
| Fig. 4 Particle size distributions for Mg(OH)2 suspensions sonicated for 20 minutes, dosed with varied concentrations of sodium dodecyl sulphate (SDS) and sodium lauroyl isethionate (SLI) between 0–820 μM and 0–1000 μM respectively and stirred for 20 minutes, before analysis with static light scattering using a 900 rpm flow cell. | ||
For 0 μM collector dose, the PSD may be considered as pseudo-bimodal, with a small peak at 0.3–2 μm of magnitude ∼2 vol% and a major peak at 2–20 μm of magnitude ∼8 vol%. The smaller peak is likely the size of the primary particles, which were determined by Lockwood et al.12 to be ∼0.3 μm via SLS, whereas the larger peak is likely the equilibrium particle size achieved by sonication (with some initial particle-cluster aggregation as discussed in Fig. 2C and D). When considering the SDS systems, when  , there is a visible shift of the larger peak to the left accompanied by gradual peak broadening, indicating an increase in particle size from enhanced aggregation conditions. When
  , the particle size distribution reduces again, back towards the 0 μM distribution (although, with a broader monomodal peak). Potentially, the high concentration of SDS may have resulted in some aggregation of the primary particles in the smaller peak size range (0.3–2 μm), but it should be noted that the span of the PSD does not explicitly show any increase, which may indicate that the particle size maxima are shear rate dependent. Alternatively, the greater surface coverage of SDS may stabilise smaller nucleation clusters similar to how surfactants stabilise nanoparticle systems,32,80,81 preventing the initial cluster–cluster aggregation processes from developing into those observed in Fig. 2D at 40 min. The SLI system shows similar trends to SDS, however, there is greater PSD dispersity at
  and the overlap of the primary particle size range (0.3–2 μm) and the main peak (2–20 μm) is visible as an emerging peak at ∼2–8 μm above 100 μM SLI doses (i.e.
  ). The SLI also displays a less clear trend of particle size reduction in the bilayer region, suggesting a reduced dispersant property for the SLI in comparison to the SDS at high concentrations.
Prajitno et al.35 investigated the effect of ethylhexadecyldimethylammonium bromide and cetylpyridinium chloride collectors adsorbed onto clinoptilolite, in terms of suspension dispersity using SLS. Whilst Prajitno et al.35 observed no significant shift in the clinoptilolite PSD d50 with collector adsorption, increased polydispersity was observed similar to the SDS and SLI systems in this work. Similar to the SDS and SLI, the hydrophilic head group (in this case cationic) of the surfactants investigated by Prajitno et al.35 adsorbed onto the anionic clinoptilolite particle surface, resulting in the clinoptilolite particles having greater hydrophobicity at monolayer coverage (similar to SDS and SLI in Fig. 3A). The greater hydrophobicity resulted in a greater surface energy in the water environment, reducing stability leading to aggregation, although not to a significant enough extent to facilitate considerable flocculation.35 Like this system, the adsorption of SDS and SLI should not present any significant issues regarding the suspension's dispersion stability,35 indicating that the PSD of the suspension in flotation is likely best represented by the in situ measurements taken in Fig. 2B.
Foamability
The change in foam height versus surfactant or frother concentration found in the Bikerman column tests for SDS, SLI and MIBC respectively (all in 2.5 vol% magnesium hydroxide suspensions) are shown in Fig. 5A–C. For each of these investigations, the volume of foam increases linearly at lower air flowrates, before entering an unstable non-linear region, indicative of airflow turbulence in the burette.18,30,34,57,82 Also, for the SDS and SLI collector systems, the maximum experimental concentrations presented represent the transition point before the foam became significantly unstable (and no accurate measurements at higher concentrations were possible). The upper relative concentrations of SDS and SLI are within the regions for monolayer surfactant coverage (see Fig. 3) where significant hydrophobisation of particles is assumed to occur. It was observed visually that Mg(OH)2 particles in this concentration region for both surfactants were transported into the foam phase, causing a heterogeneous froth, where less particle dense regions collapsed, forming cavities in the foam structure preventing further foam volume expansion (see ESI Fig. S2†). The SDS had a lower boundary concentration for this effect than SLI, with maximum experimental concentrations of 9.84 μM and 40 μM respectively (see Table 3). This difference is likely related to the greater adsorption intensity of SDS onto Mg(OH)2 surfaces at lower concentrations (again, see Fig. 3). It is also noted that no such effects were evident with the uncharged MIBC frother, and it is assumed to not have any considerable interaction with mineral cationic surfaces. Therefore, MIBC tests were conducted over a much larger concentration range.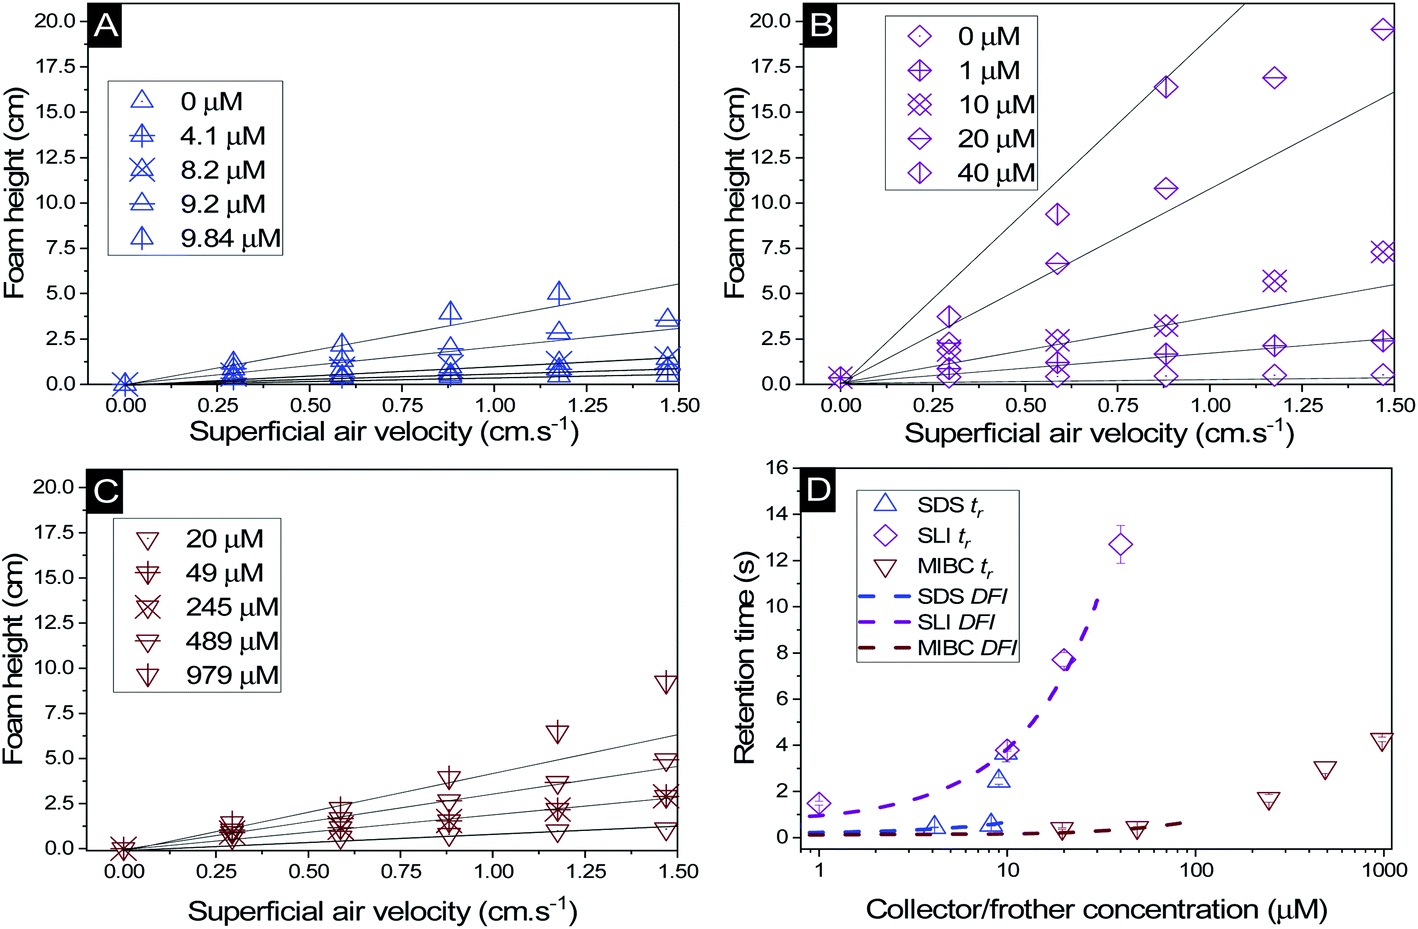 | ||
| Fig. 5 Change in foam height with superficial air velocity for (A) SDS, (B) SLI, and (C) MIBC, all with 2.5 vol% Mg(OH)2 suspensions. (D) The retention time was calculated using eqn (2), with varying collector or frother concentration. Solid lines in (A) to (C) represent linear trendlines to determine the gas retention time (tr). Dashed lines in (D) represent the linear fit of the dynamic foam stability index (DFI) as per eqn (3). | ||
| System | Max conc. (μM) | DFI (s L mol−1) |
|---|---|---|
| Sodium dodecyl sulphate | 9.84 | 49 × 103 |
| Sodium lauroyl isethionate | 40 | 321 × 103 |
| Methyl isobutyl carbinol | 979 | 6 × 10³ |
The retention time of the gas in the foam phase, with varying concentrations of each collector or frother (calculated using eqn (2)) was measured and is presented in Fig. 5D. While the retention time does increase with surfactant concentration for all systems, it does not increase at the same rate, due to the impact of enhanced particle-stabilisation effects in the SDS system (with respect to the SLI-particle system) which complicates the use of retention time as a marker for foam stability in these mixed surfactant-particle cases. The MIBC system achieves greater retention times than the SDS-particle system at high concentrations, but again, this is likely from the concentration limits imposed by the additional foam-particle stability. Indeed, it is noted that in general, MIBC is used as an active frother that promotes stable foams over relatively short periods of time, allowing for high degrees of mineral separation, without long lasting froths that hinder breakdown in onward treatments.83
To compare the foamability with a measure independent of concentration, the dynamic foamability indices (DFI) were calculated using eqn (3) and are displayed in Table 3. The collector-particle systems displayed DFIs greater than that of the frother system, where SDS and SLI have DFIs of 49 × 103 and 321 × 103 s L mol−1 respectively. The MIBC frother displayed a DFI of 6 × 10³ s L mol−1, which is lower than previous work done by Gupta et al.,34 Melo and Laskowski30 and Laskowski et al.,33 who found DFIs of MIBC in the range of 34–37 × 103 s L mol−1. However, in the study by Melo and Laskowski,30 they also investigated the effect of brine on the DFI of MIBC and found a much lower value of 3.9 × 10³ s L mol−1. This difference indicates that ion effects on frother activity may significantly impact the DFI of MIBC, and is important in the current systems because of the semi-solubility of Mg(OH)2, which at 2.5 vol%, possess an ionic strength sufficient to alter the pH of suspensions to >10–10.5.12 In terms of the surfactant systems, a previous study with SDS by Khoshdast et al.,50 found the DFI to be 92 × 103 s L mol−1, and so similar to the value observed in this work (although, any comparisons must be made with caution, owing to the complication of SDS interactions with the Mg(OH)2 particles in the present case). As the DFI for SLI solutions (with or without particles) has not been recorded previously in literature (to the authors' knowledge) additional Bickerman column tests were completed with SLI only solutions (see ESI Fig. S3A and B†) where the DFI was calculated to be 324 × 103 s L mol−1, and so very similar to the particle stabilised SLI system in Table 3.
The role of particles in foam stabilisation has been extensively researched, where Hunter et al.18,24 suggested that for strongly hydrophobic particles with contact angles approaching 90°, particles act as steric barrier to bubble coalescence due to their high particle-interface attachment energy. However, particles that are weakly hydrophobic may also stabilise foams through retarding film drainage in the lamella via film stratification,25,40,84–86 which is more important for dynamic wet foams found in flotation operations, and implies that they have greater water retention at their equilibrium lamella fluid drainage.18 Increased water retention is an important factor in flotation as it may lead to increased water carry-over reducing solid–liquid separation efficiencies. Given the greater DFI for SLI, which has lower collector monolayer adsorption densities, increased stabilisation via film drainage retardation may entrain greater amounts of water with less particles, potentially lowering the collection efficiency factor for the SLI system. The greater foam volume generated by SLI compared to SDS, combined with the lower adsorption density of the SLI onto the Mg(OH)2 particles, indicates that there is a greater water content in the foam. Combined with the potential for particle drainage or lower collection due to the comparatively subpar hydrophobisation, SLI may result in inferior flotation conditions compared to the SDS system.18,19,22,23,31,33,35,38
Flotation performance
Particle recovery as a mass percentage of the total Mg(OH)2 particles initially in the flotation cell as a function of collector concentration of SDS and SLI is presented in Fig. 6A. As the collector concentration increases, there is a clear increase in Mg(OH)2 recovery from the flotation cell using both collectors, which plateaued at 93% and 86% Mg(OH)2 recovery for SDS and SLI respectively. Excluding the first recoded point at ∼1 μM collector concentration, the SDS significantly outperforms the SLI in regards to Mg(OH)2 mass recovery. Fig. 6B compares the mass of water remaining in the flotation cell as a function of collector concentration for SDS and SLI. Much like when considering the mass of Mg(OH)2 recovered from the flotation cell, SDS outperformed the SLI again, with the region of greatest separation in performance located at the predicted region (data points enclosing 172–188 μM) for maximum monolayer coverage discerned from Fig. 3A and B. The combination of the mass of particles and water recovered from the flotation cell can be used to calculate the residual cell concentration from eqn (6), as shown in Fig. 6C. Consistent with the previous performance measures, again the SDS considerably outperforms the SLI system, achieving the lowest cell volumetric concentrations of 0.5 vol% and 1.6 vol% respectively (from initial suspension concentration of 2.5 vol%). Once again, these optimum performances lay in the maximum monolayer coverage regions (calculated from the adsorption isotherms) as highlighted in Fig. 6A–C.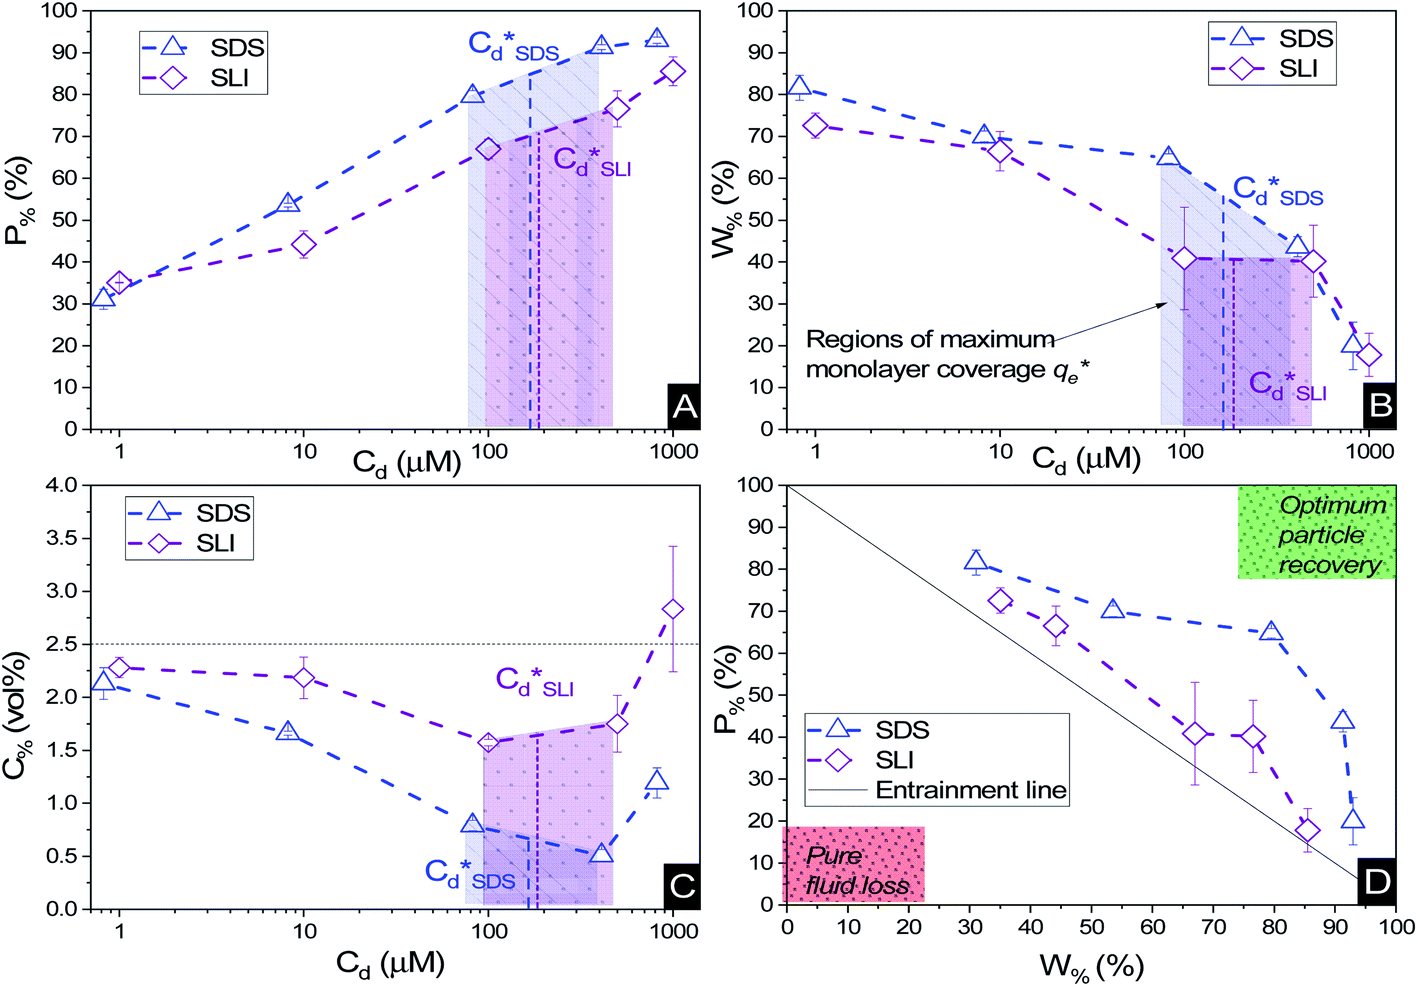 | ||
| Fig. 6 The flotation performance with increasing collector concentration for 2.5 vol% suspensions, as a measure of (A) mass percentage (P%) of Mg(OH)2 particles recovered, (B) mass percentage of water (W%) remaining in the cell, and (C) the residual Mg(OH)2 concentration (C%) in the flotation cell post flotation. (D) The corresponding mass percentage of water recovered with increasing mass percentage of Mg(OH)2 particles recovered. Connecting lines are a visual guide. | ||
For SLI, the residual cell concentration post flotation in the bilayer adsorption regime increased, likely due to the increase in fluid loss intensity shown in Fig. 6B when  . For greater insight into performance, the fluid loss from the cell and particle recovery were plotted with respect to each other, along with an equal entrainment line (P% = W%) as shown in Fig. 6D. Values above the entrainment line represent a higher ratio of the mass percentages of particle recovery to water remaining in the flotation cell post flotation, i.e. greater collection efficiency. Conversely, values below this line represent a greater amount of water being recovered than particles on a mass basis. All data points for SDS and SLI lay above the entrainment line showing at all concentrations of collector dose there is successful particle-fluid separation to some degree, while the heightened performance of SDS is clearly evident across the concentration range.
A synthesis of the data from Fig. 6A–D is shown in Fig. 7, allowing scrutiny of collection efficiency as a function of collector concentration, and by extension, the adsorption data shown in Fig. 3A, for a holistic analysis of flotation performance. The ratio of the mass percentage of Mg(OH)2 particles and water recovered is displayed as the collection efficiency factor, ξ, as per eqn (7). The greater the value of ξ, the more efficient the particle separation from water in the flotation cell, where values below 1 (the entrainment line) represent a greater recovery of water from the Mg(OH)2 suspension. The maximum ξ values coincide with maximum monolayer coverage regions calculated from Fig. 3A. Beyond this point,  , the collection efficiency tends back towards the entrainment line.
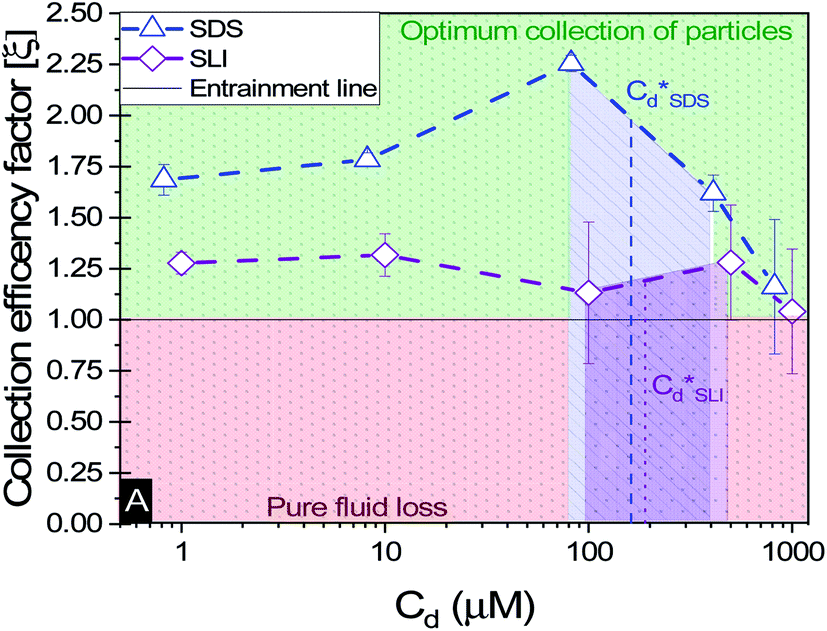 | ||
| Fig. 7 The effect of collector concentration on the collection efficiency factor in eqn (7), displayed with an equal entrainment line. Values above the line represent a greater proportion of particles being recovered and below the line represent greater fluid recovery. | ||
As the maximum monolayer coverage concentration,  , lies between data points, because of the low data resolution from the logarithmic concentration sweep, the performance factors of the highest performing collector concentrations recorded (by ξ) are shown in Table 4. Here one can assume that monolayer coverage is achieved, as the recorded adsorption capacities for these concentrations of SDS and SLI are 96% and 98% respectively of the maximum adsorption capacity
  . SDS outperforms SLI at every measure, with greater proportion of Mg(OH)2 particles recovered, a greater proportion of water retained in the flotation cell and a lower residual concentration of Mg(OH)2 in the flotation cell. Not only does SDS perform better than the SLI by flotation performance metrics, but it is also more efficient on a molecular basis, requiring a lower concentration to achieve a greater collector adsorption density on the surface of the particles to achieve this superior performance. The comparison of flotation performance is illustrated in Fig. 8A and B for SDS and SLI respectively summarising each of the metrics in Table 4.
 onto the Mg(OH)2 particles
| Collector | Cd (μM) | ξ | P% (%) | W% (%) | C% (vol%) | qe (μmol m−2) |
|
|---|---|---|---|---|---|---|---|
| SDS | 82 | 2.3 | 80 | 64.7 | 0.8 | 0.1 | 96 |
| SLI | 100 | 1.1 | 67 | 40.8 | 1.6 | 0.049 | 98 |
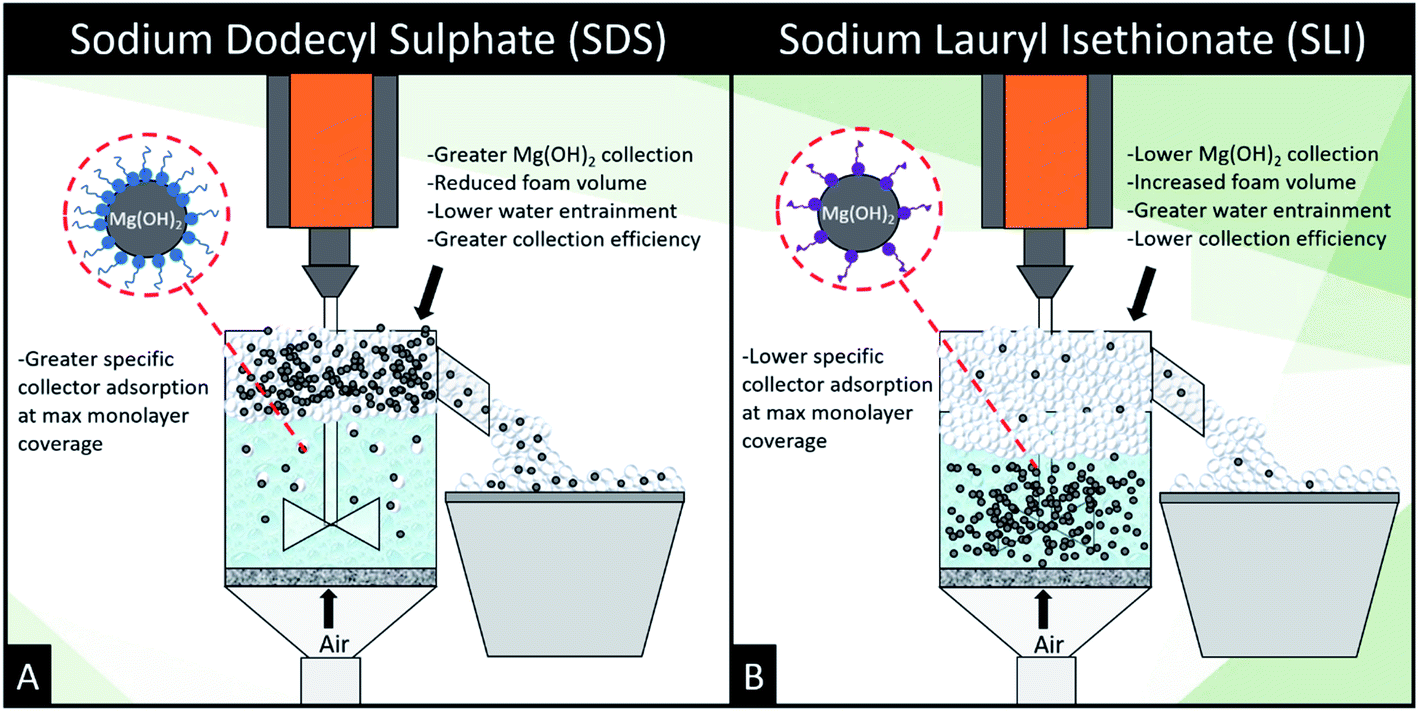 | ||
| Fig. 8 Schematic illustrating the mechanistic differences between (A) sodium dodecyl sulphate and (B) sodium lauroyl isethionate collector flotation systems. | ||
The importance of collector surface adsorption density and foamability on flotation performance are demonstrated clearly in the flotation data. The adsorption density of collectors on the Mg(OH)2 aggregates is vital to increasing the surface hydrophobicity facilitating bubble attachment.22,23,35,38,53 SDS generated the greatest particle recovery in this investigation, forming very stable foams with lower water content than SLI (which displayed a significantly greater DFI in Table 3). This increased foamability of the SLI which captured more water in the lamella than the SDS system, and also recovered less particles due to the lower degree of particle hydrophobisation.87
The role of collector hydrophobisation in flotation performance is highlighted further in the bilayer adsorption regime. At these concentrations,  , “hemimicelles” begin to form,49,75,76 where the second layer of collectors orientate their hydrophobic tails towards the corona of hydrophobic tails in the previously formed monolayer. This lowers the surface energy by reducing the surface area of hydrophobic tails exposed to water dipoles, meaning the bilayer adsorption is entropically driven.44 As the polar head groups of the collectors are now facing out into the water, the particles hydrophobicity is decreased, which prohibits bubble attachment as the bilayer coverage increases. The effects of this increase in wettability are observed in the flotation efficiency analysis in Fig. 7, as the collection efficiency factors tend towards 1 when
  . However, as observed, the collection efficiency factors do not drop below 1 at any concentration, which is likely due to the homogeneous distribution of Mg(OH)2 in the well mixed flotation cell. Here, entrained fluid in the foam lamella also has a heterogeneous concentration distribution of Mg(OH)2. This means that even in the event of bubble coalescence and lamella drainage, the concentration does not change unless particles are successfully hydrophobically attached to air water interfaces in the foam, where the degree of air water interface adsorption decreases as the bilayer coverage increases, thus ξ approaches 1.18,24,25,84
An important observation is that at 96% maximum monolayer adsorption capacity  , SDS removed 80% of particles, meaning that 20% of particles remained in the flotation cell. For industrial applications, it would be likely that a second flotation cell operating in series would be required. At higher concentrations further particles were removed, but the efficiency analysis indicates this was through entrainment rather than hydrophobic separation. Previous work into the effect of the hydrophobic tail lengths in carboxylate soap collectors found that increasing the hydrophobic tail length increased the recovery yield in ion flotation.39 However, in the present case, the increase in chain length of the SLI did not enhance flotation, largely due to the reduced adsorption density from the larger headgroup as shown in the surfactant-particle adsorption density data in Table 2. Also, increasing the hydrophobicity of particles has a trade off with foam stability. Studies have found that particles with contact angles of ∼70° are optimal for flotation, as greater hydrophobicity particles (contact angles of >90°) have been shown to destabilise, dry and collapse foams due to the increased film drainage.18,25 Nevertheless, the low level of aggregation evident (e.g. Fig. 5) would suggest such high contact angles are not achieved through either SDS or SLI adsorption.
The relatively fine particle size distributions may additionally suggest a reduced flotation performance of the Mg(OH)2, because of the hydrodynamic limitations. Studies into the effect of fine and coarse particles on flotation have found that particles which are too small will lack the inertia required to overcome slipstreams created by the bubbles in turbulent foaming conditions for successful interactions at the air–water interface for particle-bubble attachment.15,28,88 While the magnesium hydroxide does aggregate to varying degrees (see Fig. 2) the majority of particles in well mixed conditions are <50–100 μm, with in particular, a high degree of <10 μm fines that will be in the low inertial region. Conversely, aggregates that are too large, may detach from bubbles too easily, because of the greater gravitational forces acting upon them against the buoyancy of rising bubbles.28 Although probably less of an issue in the current system, this is why the minerals industry has very high energy requirements for communition of coarse particles to meet the operational envelope of subsequent froth flotation separation stages which is typically estimated as 10–150 μm.28 The drive for smarter processing to increase recovery yields and decrease water use has driven innovation in this area to the development collectors, which have the dual functionality of flocculation agents and hydrophobic surface modifiers (usually copolymers).15,16,43 However, the current stimuli triggers required to facilitate the switch between hydrophobic and hydrophilic behaviour is problematic for economical/process chemistry concerns, and as a result there is a drive for the development of dual flocculation-collector agents which circumvent the need for stimuli changes.16
Conclusion
The aim of this work was to investigate the application of anionic surfactants, sodium dodecyl sulphate (SDS) and sodium lauroyl isethionate (SLI), as collector agents to dewater Mg(OH)2 based radioactive waste suspensions using dispersed air flotation (in the presence of a methyl isobutyl carbinol frothing agent). SDS was found to have a greater adsorption intensity and density in the monolayer regime, with a surface concentration double that of SLI. During bilayer formation, due to the greater surface energy associated with the long hydrophobic chain length, SLI demonstrated a greater adsorption intensity which was entropically driven. Upon sonication, Mg(OH)2 was found to readily aggregate, due to its low surface potential in a static light scattering kinetic study, where aggregation was further enhanced in the presence of KNO3 salt from reduction of the electrical double layer. The influence of SDS and SLI on the Mg(OH)2 particle size distribution (PSD) as a function of collector concentration was investigated and compared to the baseline coagulation study and found to be negligible. An interrogation of the Mg(OH)2 particle stabilised foam dynamics using a Bikerman column test showed that the SLI system dynamic foamability index (DFI) was greater than the SDS system. Flotation performance was analysed using a batch flotation cell. Whilst mass and water recovery both increased with increasing collector doses, SDS outperformed SLI as a collector with superior Mg(OH)2 recovery and the highest collection efficiency factors. The optimum recovery conditions for both SDS and SLI aligned with the maximum monolayer adsorption density collector concentrations and decreased back to entrainment concentrations in the bilayer regime, which was associated to the decreased hydrophobicity from hemi-micelle formation decreasing the particle surface energy. At the optimal conditions for particle-liquid separation with SDS, 80% of particles were recovered highlighting that flotation is a viable, rapid technique for the dewatering of legacy nuclear wastes.Nomenclature
Scripts
| As | Specific surface area, m2 g−1 |
| C% | Mg(OH)2 concentration remaining in the flotation cell, vol% |
| Cd | Initial supernatant collector concentration, μM |
| Ce | Equilibrium supernatant collector concentration, μM |
| DFI | Dynamic foamability index, s L mol−1 |
| Hf | Foam height, cm |
| kf | Freundlich constant related to the adsorption capacity, mg g−1 |
| Mr | Relative molecular mass, g μmol−1 |
| Mrp | Mass of recovered particles in the collector tray, g |
| Mrw | Mass of recovered water in the collector tray, g |
| MTp | Mass of total particles initially in the flotation cell, g |
| MTw | Mass of total water initially in the flotation cell, g |
| n | Freundlich adsorption intensity-based coefficient, — |
| P% | Mass% of Mg(OH)2 recovered from the floatation cell, % |
| qe | Collector adsorption density on Mg(OH)2 surfaces, mg g−1/μmol m−2 |
| tr | Retention time, s |
| u | Superficial gas velocity, cm s−1 |
| W% | Mass% of water remaining in the flotation cell, % |
| ξ | Collector efficiency factor, — |
Superscripts
| * | At maximum monolayer coverage onto Mg(OH)2 surface |
Conflicts of interest
The authors declare no competing financial interest.Acknowledgements
The authors would like to thank the Engineering and Physical Sciences Research Council (EPSRC) U.K. and Sellafield Ltd for funding this research through the Centre for Doctoral training in Next Generation Nuclear (NGN-CDT) [EP/L015390/1]. We would also like to thank Stuart Micklethwaite and the Leeds Electron Microscopy and Spectroscopy (LEMAS) Centre for their assistance and guidance with the scanning electron microscope experiments. Finally, the authors would like to thank the anonymous reviewers for their important comments and suggestions that helped improve the paper. The data associated with this paper is available from University of Leeds; at https://doi.org/10.5518/990. It is available under a Creative Commons Attribution licence (CC-BY).References
- T. Calvin, Decommissioning Sellafield's First Fuel Storage Pond. Waste Management Symposium, Phoenix, Arizona, USA, 2011 Search PubMed.
- K. R. Hallam, P. C. Minshall, P. J. Heard and P. E. J. Flewitt, Corros. Sci., 2016, 112, 347–363 CrossRef CAS.
- P. G. Heath, M. W. A. Stewart, S. Moricca and N. C. Hyatt, J. Nucl. Mater., 2018, 499, 233–241 CrossRef CAS.
- I. Grant, U. Weintrager, I. E. Richardson and D. Wilson, Sellafield FGMSP Additional Sludge Retrievals A Significant Step in Decommissioning Part of the U.K.'s Nuclear Legacy, Waste Management Symposium, Phoenix, Arizona, USA, 2016 Search PubMed.
- S. A. Parry, L. O'brien, A. S. Fellerman, C. J. Eaves, N. B. Milestone, N. D. Bryan and F. R. Livens, Energy Environ. Sci., 2011, 4, 1457–1464 RSC.
- S. F. Jackson, S. D. Monk and Z. Riaz, Appl. Radiat. Isot., 2014, 94, 254–259 CrossRef CAS PubMed.
- Z. Maher, P. Ivanov, L. O'Brien, H. Sims, R. J. Taylor, S. L. Heath, F. R. Livens, D. Goddard, S. Kellet, P. Rand and N. D. Bryan, J. Nucl. Mater., 2016, 468, 84–96 CrossRef CAS.
- C. Burrows, C. Phillips and A. Milliken, The Thermal Oxide Reprocessing Plant at Sellafield – Lessons Learned from 10 Years of Hot Operations and their Applicability to the DOE Environmental Management Program, Waste Management Symposium, Phoenix, Arizona, USA, 2006 Search PubMed.
- M. Johnson, J. Peakall, M. Fairweather, S. Biggs, D. Harbottle and T. N. Hunter, Ind. Eng. Chem. Res., 2016, 55, 9983–9993 CrossRef CAS.
- W. Brostow, H. E. Hagg Lobland, S. Pal and R. P. Singh, J. Mater. Educ., 2009, 31, 157–166 CAS.
- S. Sinkov, C. Delegard and A. Schmidt, Mitigation of Hydrogen Gas Generation from the Reaction of Uranium Metal with Water in K Basin Sludge and Sludge Waste Forms, 2011 Search PubMed.
- A. P. G. Lockwood, J. Peakall, N. J. Warren, G. Randall, M. Barnes, D. Harbottle and T. N. Hunter, Chem. Eng. Sci., 2021, 231, 116274 CrossRef CAS.
- W. Sung Ng, L. A. Connal, E. Forbes, K. Mohanarangam and G. V. Franks, Adv. Powder Technol., 2018, 29, 1940–1949 CrossRef.
- G. V. Franks, P. D. Yates, N. W. A. Lambert and G. J. Jameson, Int. J. Miner. Process., 2005, 77, 46–52 CrossRef CAS.
- W. S. Ng, R. Sonsie, E. Forbes and G. V. Franks, Miner. Eng., 2015, 77, 64–71 CrossRef CAS.
- W. S. Ng, L. A. Connal, E. Forbes and G. V. Franks, Miner. Eng., 2018, 123, 144–159 CrossRef CAS.
- F. A. Benn, P. D. Fawell, J. Halewood, P. J. Austin, A. D. Costine, W. G. Jones, N. S. Francis, D. C. Druett and D. Lester, Chem. Eng. Sci., 2018, 184, 111–125 CrossRef CAS.
- T. N. Hunter, E. J. Wanless and G. J. Jameson, Colloids Surf., A, 2009, 334, 181–190 CrossRef CAS.
- K. Sun, T. Liu, Y. Zhang, X. Liu, B. Wang and C. Xu, Minerals, 2017, 7, 29 CrossRef.
- M. C. Fuerstenau, G. Jameson and R. Yoon, Froth Flotation: A Century of Innovation, 2007 Search PubMed.
- L. Chang, Y. Cao, G. Fan, C. Li and W. Peng, RSC Adv., 2019, 9, 20226–20239 RSC.
- B. Bai, N. P. Hankins, M. J. Hey and S. W. Kingman, Ind. Eng. Chem. Res., 2004, 43, 5326–5338 CrossRef CAS.
- M. Epple, D. C. Schmidt and J. C. Berg, Colloid Polym. Sci., 1994, 272, 1264–1272 CrossRef CAS.
- T. N. Hunter, R. J. Pugh, G. V. Franks and G. J. Jameson, Adv. Colloid Interface Sci., 2008, 137, 57–81 CrossRef CAS PubMed.
- R. J. Pugh, Bubble and foam chemistry, Cambridge, 2016 Search PubMed.
- M. R. Teixeira and M. J. Rosa, Sep. Purif. Technol., 2006, 52, 84–94 CrossRef CAS.
- P. B. Kowalczuk, O. Sahbaz and J. Drzymala, Miner. Eng., 2011, 24, 766–771 CrossRef CAS.
- C. D. F. Gontijo, D. Fornasiero and J. Ralston, Can. J. Chem. Eng., 2008, 85, 739–747 CrossRef.
- H. Li, M. Liu and Q. Liu, Miner. Eng., 2018, 119, 105–115 CrossRef CAS.
- F. Melo and J. S. Laskowski, Miner. Eng., 2006, 19, 766–773 CrossRef CAS.
- O. Ramos, S. Castro and J. S. Laskowski, Miner. Eng., 2013, 53, 108–112 CrossRef CAS.
- H. Farhadi, S. Riahi, S. Ayatollahi and H. Ahmadi, Chem. Eng. Res. Des., 2016, 111, 449–460 CrossRef CAS.
- J. S. Laskowski, Y. S. Cho and K. Ding, Can. J. Chem. Eng., 2008, 81, 63–69 CrossRef.
- A. K. Gupta, P. K. Banerjee, A. Mishra, P. Satish and Pradip, Int. J. Miner. Process., 2007, 82, 126–137 CrossRef CAS.
- M. Y. Prajitno, S. Tangparitkul, H. Zhang, D. Harbottle and T. N. Hunter, J. Hazard. Mater., 2021, 402, 123567 CrossRef CAS PubMed.
- D. Wilkinson, M. Li and K. Patchigolla, in AIChE Spring National Meeting-5th World Congress on Particle Technology, Orlando, Fl, USA, 2006 Search PubMed.
- X. Zeng, L. Xu, J. Tian, W. Yin, Y. Yang and W. Deng, Miner. Eng., 2017, 111, 201–208 CrossRef CAS.
- A. A. Mohammed, S. E. Ebrahim and A. I. Alwared, J. Chem., 2013, 2013, 6 Search PubMed.
- L. Evans, B. Paul Thalody, J. D. Morgan, S. K. Nicol, D. H. Napper and G. G. Warr, Colloids Surf., A, 1995, 102, 81–89 CrossRef CAS.
- S. Stiller, H. Gers-Barlag, M. Lergenmueller, F. Pflücker, J. Schulz, K. P. Wittern and R. Daniels, Colloids Surf., A, 2004, 232, 261–267 CrossRef CAS.
- R. J. Pugh, Langmuir, 2007, 23, 7972–7980 CrossRef CAS PubMed.
- J. P. O'Shea, G. G. Qiao and G. V. Franks, Langmuir, 2012, 28, 905–913 CrossRef PubMed.
- E. Forbes, D. Bradshaw and G. Franks, Miner. Eng., 2011, 24, 772–777 CrossRef CAS.
- X. Gao and J. Chorover, J. Colloid Interface Sci., 2010, 348, 167–176 CrossRef CAS PubMed.
- N. Barbian, E. Ventura-Medina and J. J. Cilliers, Miner. Eng., 2003, 16, 1111–1116 CrossRef CAS.
- M. I. Jeraal, K. J. Roberts, I. McRobbie and D. Harbottle, ACS Sustainable Chem. Eng., 2018, 6, 2667–2675 CrossRef CAS.
- S. Hashemi, A. Rezaee, M. Nikodel, H. Ganjidost and S. M. Mousavi, React. Kinet., Mech. Catal., 2013, 109, 433–446 CrossRef CAS.
- N. Yekeen, M. A. Manan, A. K. Idris, A. M. Samin and A. R. Risal, J. Pet. Sci. Eng., 2017, 159, 115–134 CrossRef CAS.
- W. Gong, Y. Zang, H. Xie, B. Liu, H. Chen, C. Li and L. Ge, RSC Adv., 2015, 5, 81847–81856 RSC.
- H. Khoshdast, S. Mirshekari and A. Zahab-Nazouri, J. Min. Environ., 2015, 6, 119–124 Search PubMed.
- Martin Marietta Magnesia Specialties, Fed. Regist., 2016, 77, 1–7 Search PubMed.
- P. Li and M. Ishiguro, Soil Sci. Plant Nutr., 2016, 62, 223–229 CrossRef CAS.
- H. Zhang, Y. K. Kim, T. N. Hunter, A. P. Brown, J. W. Lee and D. Harbottle, J. Mater. Chem. A, 2017, 5, 15130–15143 RSC.
- P. Barrett and B. Glennon, Chem. Eng. Res. Des., 2002, 80, 799–805 CrossRef CAS.
- M. Rhodes, Introduction to Particle Technology, ed. M. J. Rhodes, Wiley, 2008 Search PubMed.
- J. Czarnecki, K. Małysa and A. Pomianowski, J. Colloid Interface Sci., 1982, 86, 570–572 CrossRef CAS.
- M. López-Barajas, E. López-Tamames, S. Buxaderas, X. Tomás and M. C. De La Torre, J. Agric. Food Chem., 1999, 47, 3743–3748 CrossRef PubMed.
- L. N. Elliott, R. A. Bourne, A. Hassanpour, J. L. Edwards, S. Sutcliffe and T. N. Hunter, Powder Technol., 2018, 333, 458–467 CrossRef CAS.
- S. Biggs, R. Nabi, C. Poole and A. Patel, in 11th International Conference on Environmental Remediation and Radioactive Waste Management, Parts A and B, ASME, 2007, pp. 1133–1139 Search PubMed.
- S. M. Glover, Y. Yan, G. J. Jameson and S. Biggs, Chem. Eng. J., 2000, 80, 3–12 CrossRef CAS.
- F. Adekola, M. Fédoroff, H. Geckeis, T. Kupcik, G. Lefèvre, J. Lützenkirchen, M. Plaschke, T. Preocanin, T. Rabung and D. Schild, J. Colloid Interface Sci., 2011, 354, 306–317 CrossRef CAS PubMed.
- J. Rosenqvist, Surface chemistry of Al and Si (hydr)oxides, with emphasis on nano-sized gibbsite (α-Al(OH)3), Department of Chemistry, Inorganic Chemistry Umea University, Sweeden, 2002 Search PubMed.
- R. J. Hunter, Foundations of colloid science, Oxford University Press, 2001 Search PubMed.
- B. Shi, Q. Wei, D. Wang, Z. Zhu and H. Tang, Colloids Surf., A, 2007, 296, 141–148 CrossRef CAS.
- M.-Y. Wu and Y. Adachi, Colloids Surf., A, 2016, 506, 686–693 CrossRef CAS.
- B. Buratto, S. P. Usher, D. Parris and P. J. Scales, Colloids Surf., A, 2014, 449, 157–169 CrossRef CAS.
- J. W. Tavacoli, P. J. Dowding and A. F. Routh, Colloids Surf., A, 2007, 293, 167–174 CrossRef CAS.
- L. de Martín, A. Fabre and J. Ruud van Ommen, Chem. Eng. Sci., 2014, 112, 79–86 CrossRef.
- F. Pierce, C. M. Sorensen and A. Chakrabarti, Phys. Rev. E: Stat., Nonlinear, Soft Matter Phys., 2006, 74, 021411 CrossRef CAS PubMed.
- J. Cobbledick, A. Nguyen and D. R. Latulippe, Water Res., 2014, 58, 132–140 CrossRef CAS PubMed.
- P. Raj, A. Blanco, E. de la Fuente, W. Batchelor, C. Negro and G. Garnier, Colloids Surf., A, 2017, 516, 325–335 CrossRef CAS.
- P. Raj, W. Batchelor, A. Blanco, E. de la Fuente, C. Negro and G. Garnier, J. Colloid Interface Sci., 2016, 481, 158–167 CrossRef CAS PubMed.
- V. Vajihinejad and J. B. P. Soares, Chem. Eng. J., 2018, 346, 447–457 CrossRef CAS.
- S. Gangula, S. Y. Suen and E. D. Conte, Microchem. J., 2010, 95, 2–4 CrossRef CAS.
- A. Bera, T. Kumar, K. Ojha and A. Mandal, Appl. Surf. Sci., 2013, 284, 87–99 CrossRef CAS.
- A. Bera and A. Mandal, J. Pet. Explor. Prod. Technol., 2015, 5, 255–268 CrossRef CAS.
- R. M. Pashley and M. E. Karaman, Applied colloid and surface chemistry, John Wiley & Sons, 2004 Search PubMed.
- G. M. Kontogeorgis and S. Kiil, Introduction to Applied Colloid and Surface Chemistry, John Wiley & Sons, Ltd, Chichester, UK, 2016 Search PubMed.
- D. J. Shaw, Introduction to Colloid and Surface Chemistry, Butterworth-Heinemann, 1992 Search PubMed.
- S. A. AL-Thabaiti, F. M. Al-Nowaiser, A. Y. Obaid, A. O. Al-Youbi and Z. Khan, Colloids Surf., B, 2008, 67, 230–237 CrossRef CAS PubMed.
- M. Pisárčik, J. Jampílek, M. Lukáč, R. Horáková, F. Devínsky, M. Bukovský, M. Kalina, J. Tkacz and T. Opravil, Molecules, 2017, 22, 1794–1813 CrossRef PubMed.
- M. R. Mahmoud, M. A. Soliman and G. M. Rashad, Chem. Eng. J., 2017, 326, 781–793 CrossRef CAS.
- G. Bournival, S. Ata and G. J. Jameson, Miner. Process. Extr. Metall. Rev., 2017, 38, 366–387 CrossRef CAS.
- B. P. Binks, Curr. Opin. Colloid Interface Sci., 2002, 7, 21–41 CrossRef CAS.
- S. Simovic and C. A. Prestidge, Langmuir, 2003, 19, 3785–3792 CrossRef CAS.
- S. Abend, N. Bonnke, U. Gutschner and G. Lagaly, Colloid Polym. Sci., 1998, 276, 730–737 CrossRef CAS.
- D. Tao, G. Luttrell and R. Yoon, Int. J. Miner. Process., 2000, 59, 25–43 CrossRef CAS.
- W. S. Ng, L. Cooper, L. A. Connal, E. Forbes, G. J. Jameson and G. V. Franks, Miner. Eng., 2018, 117, 91–99 CrossRef CAS.
Footnote |
| † Electronic supplementary information (ESI) available: Fig. S1: the change in the volume based (vol%) particle size distribution of Mg(OH)2 agitated at 900 rpm and dosed with 10−2 M KNO3 with time. Fig. S2: photograph of Bikerman column during foamability tests, showing stabilised collapsed foam layers preventing further foamability readings. Fig. S3: the change in foam height with superficial air velocity for sodium lauroyl isethionate without Mg(OH)2 particles. See DOI: 10.1039/d1ra01222c |
| This journal is © The Royal Society of Chemistry 2021 |