DOI:
10.1039/D1RA01570B
(Paper)
RSC Adv., 2021,
11, 19128-19135
MgAl LDH nanosheets loaded with Ni nanoparticles: a multifunctional filler for improving the energy storage performance of PVDF-based nanocomposites†
Received
27th February 2021
, Accepted 1st May 2021
First published on 27th May 2021
Abstract
Polymer-based dielectric nanocomposites as raw materials of dielectric capacitors used in advanced electronics and electrical systems have a great application prospect but remain a huge challenge to energy storage performance in high electric fields. In this work, MgAl layered double hydroxide (MgAl LDH) nanosheets loaded with Ni nanoparticles were designed and synthesized, and incorporated into polyvinylidene fluoride (PVDF) to fabricate Ni–MgAl LDH/PVDF nanocomposites with high energy density. The effect of Ni–MgAl LDH nanosheet content (0.2 to 0.8 wt%) on the energy storage performance of MgAl LDH/PVDF nanocomposites was studied. As a result, after adding 0.6 wt% Ni–MgAl LDH nanosheets, the nanocomposites obtained the highest energy density 23.87 J cm−3 (at 640 kV mm−1) and the charge–discharge efficiency reached 65%, which was 76% and 18% higher than that of pure PVDF, respectively. This improvement could be attributed to the multiple functions of Ni–MgAl LDH nanosheets under an applied electric field. On the one hand, Ni nanoparticles on the surface of the MgAl LDH nanosheets could enhance the interfacial conductivity, form plenty of parallel micro-capacitors and produce Coulomb blockade effect, which resulted in high dielectric constant and high breakdown strength. On the other hand, two functions contributed by MgAl LDH nanosheets, homogenizing the electric field and inhibiting the growth of the electric tree coming from its medium dielectric constant and sheet structure, were beneficial to increase the breakdown strength. Furthermore, finite element simulations were employed to explain the mechanism of improved dielectric properties of the Ni–MgAl LDH/PVDF nanocomposites.
1 Introduction
With the rapid development of electronic and electrical industries such as micro-electronics, pulsed devices and hybrid vehicles, there are increasing demands for dielectric capacitors with excellent performance.1–4 The performance of the capacitor mainly depends on the characteristics of polymer-based dielectric nanocomposites, which include light weight, high breakdown strength and excellent energy storage.5 The energy storage performance of nanocomposites is very important, which is usually characterized by energy density U. The energy density U is up to dielectric constant εr and breakdown strength E to decide. As expressed by the formula,  , where D is the electric displacement and D = εrε0E, where ε0 is the vacuum dielectric constant (8.85 × 10⁻¹² F m−1).6,7 In recent years, extensive research has been carried out on the polymers and fillers that comprise the nanocomposites. Polymers usually have high breakdown strength, but their dielectric constants are relatively low.8 For example, the typical commercial polymer dielectric material biaxially oriented polypropylene (BOPP) has higher than 700 kV mm−1 breakdown strength, but its lower dielectric constant (∼2.2) limits its energy density (∼2 J cm−3).9,10 Another polymer that has been intensively studied is PVDF, which has a higher dielectric constant (∼10) than those of most polymers and relatively high breakdown strength.11 In order to obtain a higher energy density, some fillers were introduced into the polymers, hoping to have an effect on the increase in dielectric constant or breakdown strength. Till now, the types of fillers are considered to be the key factor to enhance the energy storage performance of the nanocomposites, and three typical types are high-εr ceramic fillers, conductive fillers and high insulating fillers, respectively.5,8
Combining high-εr ceramic fillers (such as BaTiO3,12,13 TiO2![[thin space (1/6-em)]](https://www.rsc.org/images/entities/char_2009.gif) 14 and Ba1−xSrxTiO3
14 and Ba1−xSrxTiO3![[thin space (1/6-em)]](https://www.rsc.org/images/entities/char_2009.gif) 15) with polymers seems to be an effective approach to obtain materials with high dielectric constant and high breakdown strength. However, the dielectric constant of the nanocomposites can be significantly increased only when the filling volume is high enough, which is often at the expense of breakdown strength and processability.16 In addition, adding a small amount of conductive fillers (such as metal particles, carbon nanotubes and graphenes) can also effectively increase the dielectric constant of the nanocomposites.17–19 However, it is accompanied by a large reduction in the breakdown strength due to the huge electrical conductivity difference between the conductive fillers and the polymer matrix. These approaches are very limited in improving the energy density of the nanocomposites as the energy density is dependent on both dielectric constant and breakdown strength. Therefore, researchers have begun to seek methods to increase the breakdown strength while maintaining the dielectric constant unchanged or slightly reduced. One of the effective methods is to introduce ultra-small (<10 nm) metal nanoparticles such as Ag and Ni nanoparticles to produce Coulomb blockade effect.20–22 The ultra-small metal nanoparticles in the insulating environment can act as Coulomb islands to limit the movement of electrons, which enhances the breakdown strength of the nanocomposites.21 For example, K. Yang et al. introduced nano-Ag (3–5 nm)-decorated core–shell polydopamine (PDA)-coated BaTiO3 (BT) hybrid nanoparticles into P(VDF-HFP). Compared with P(VDF-HFP)/BT nanocomposites, the breakdown strength (from 145 to 248 kV mm−1) and energy density (from 2.45 to 3.21 J cm−3) were improved with 20 vol% filler content, but the dielectric constant of the P(VDF-HFP)/BT–PDA–Ag nanocomposites was slightly decreased.20 G. Chen et al. enhanced the breakdown strength (from 358 to 369 kV mm−1) of the PVDF-based nanocomposites by introducing ultra-small Ni nanoparticles (2–3 nm) onto the surface of BT particles, and the discharged energy density of the Ni@BT/PVDF nanocomposites reached 9.55 J cm−3 with 3 vol% Ni@BT at an electric field of 350 kV mm−1. Similarly, compared with the BT/PVDF nanocomposites, the dielectric constant of the Ni@BT/PVDF nanocomposites decreased.22 Although the breakdown strength of nanocomposites can be enhanced by this method, the enhancement is still not satisfactory. This may be due to the large difference in dielectric constant between the BaTiO3 particles and the polymer matrix, resulting in the uneven distribution of electric field in the nanocomposites, which makes it difficult to further increase the breakdown strength. Another method is to add high insulating fillers (such as BN,23 Al2O3
15) with polymers seems to be an effective approach to obtain materials with high dielectric constant and high breakdown strength. However, the dielectric constant of the nanocomposites can be significantly increased only when the filling volume is high enough, which is often at the expense of breakdown strength and processability.16 In addition, adding a small amount of conductive fillers (such as metal particles, carbon nanotubes and graphenes) can also effectively increase the dielectric constant of the nanocomposites.17–19 However, it is accompanied by a large reduction in the breakdown strength due to the huge electrical conductivity difference between the conductive fillers and the polymer matrix. These approaches are very limited in improving the energy density of the nanocomposites as the energy density is dependent on both dielectric constant and breakdown strength. Therefore, researchers have begun to seek methods to increase the breakdown strength while maintaining the dielectric constant unchanged or slightly reduced. One of the effective methods is to introduce ultra-small (<10 nm) metal nanoparticles such as Ag and Ni nanoparticles to produce Coulomb blockade effect.20–22 The ultra-small metal nanoparticles in the insulating environment can act as Coulomb islands to limit the movement of electrons, which enhances the breakdown strength of the nanocomposites.21 For example, K. Yang et al. introduced nano-Ag (3–5 nm)-decorated core–shell polydopamine (PDA)-coated BaTiO3 (BT) hybrid nanoparticles into P(VDF-HFP). Compared with P(VDF-HFP)/BT nanocomposites, the breakdown strength (from 145 to 248 kV mm−1) and energy density (from 2.45 to 3.21 J cm−3) were improved with 20 vol% filler content, but the dielectric constant of the P(VDF-HFP)/BT–PDA–Ag nanocomposites was slightly decreased.20 G. Chen et al. enhanced the breakdown strength (from 358 to 369 kV mm−1) of the PVDF-based nanocomposites by introducing ultra-small Ni nanoparticles (2–3 nm) onto the surface of BT particles, and the discharged energy density of the Ni@BT/PVDF nanocomposites reached 9.55 J cm−3 with 3 vol% Ni@BT at an electric field of 350 kV mm−1. Similarly, compared with the BT/PVDF nanocomposites, the dielectric constant of the Ni@BT/PVDF nanocomposites decreased.22 Although the breakdown strength of nanocomposites can be enhanced by this method, the enhancement is still not satisfactory. This may be due to the large difference in dielectric constant between the BaTiO3 particles and the polymer matrix, resulting in the uneven distribution of electric field in the nanocomposites, which makes it difficult to further increase the breakdown strength. Another method is to add high insulating fillers (such as BN,23 Al2O3![[thin space (1/6-em)]](https://www.rsc.org/images/entities/char_2009.gif) 24 and SiO2
24 and SiO2![[thin space (1/6-em)]](https://www.rsc.org/images/entities/char_2009.gif) 25) to construct a barrier layer, and besides the high intrinsic insulation properties, its morphology also has a great impact on the breakdown strength of the nanocomposites. Compared with 0D and 1D fillers, 2D fillers have a larger specific surface area, which can effectively inhibit the growth of electric tree and block the formation of the breakdown path.26 Therefore, 2D fillers have the best effect on improving the breakdown strength of the nanocomposites. One of the most representative 2D insulating fillers is the BN nanosheets (band gap ∼ 4–6 eV).27 X. Peng et al. prepared BN NSs/PVDF nanocomposites and the breakdown strength of the nanocomposites was significantly improved (from 306 to 486 kV mm−1). However, due to the low dielectric constant of BN, the dielectric constant of BN NSs/PVDF nanocomposites is lower than that of pure PVDF.28 To sum up, there seems to be a compromise between dielectric constant and breakdown strength, which limits the further improvement of the energy density of the nanocomposites.
25) to construct a barrier layer, and besides the high intrinsic insulation properties, its morphology also has a great impact on the breakdown strength of the nanocomposites. Compared with 0D and 1D fillers, 2D fillers have a larger specific surface area, which can effectively inhibit the growth of electric tree and block the formation of the breakdown path.26 Therefore, 2D fillers have the best effect on improving the breakdown strength of the nanocomposites. One of the most representative 2D insulating fillers is the BN nanosheets (band gap ∼ 4–6 eV).27 X. Peng et al. prepared BN NSs/PVDF nanocomposites and the breakdown strength of the nanocomposites was significantly improved (from 306 to 486 kV mm−1). However, due to the low dielectric constant of BN, the dielectric constant of BN NSs/PVDF nanocomposites is lower than that of pure PVDF.28 To sum up, there seems to be a compromise between dielectric constant and breakdown strength, which limits the further improvement of the energy density of the nanocomposites.
In this work, we propose an effective strategy to carry out research work in order to improve the performance of the nanocomposites. MgAl layered double hydroxide (MgAl LDH) nanosheets were designed and prepared. Its good insulation (band gap ∼ 4.6 eV),29 medium dielectric constant (∼40)30 and sheet morphology can be utilized to increase the breakdown strength. Ni nanoparticles were adhered to the surface of MgAl LDH nanosheets to form Ni–MgAl LDH nanosheets. The conductive properties of Ni nanoparticles can increase the conductivity difference at the interface of the nanocomposites and thus obtain high interfacial polarization, which will increase the dielectric constant. In addition, the combination of these two particles has produced unexpected results. Ni–MgAl LDH nanosheets can be regarded as micro-capacitors under applied electric field, and the Ni nanoparticles on the surface of the MgAl LDH nanosheets can produce Coulomb blockade effect, which further enhances the dielectric constant and breakdown strength of the nanocomposites, respectively. Finally, due to the multiple functions produced by Ni–MgAl LDH nanosheets, the nanocomposites obtained excellent energy storage performance.
2 Experimental
2.1 Materials
PVDF (MW 400–600k) was purchased from Shanghai 3F Co., Ltd. Aluminium nitrate nonahydrate (Al(NO3)3·9H2O), magnesium nitrate hexahydrate (Mg(NO3)2·6H2O) and nickel nitrate hexahydrate (Ni(NO3)2·6H2O) were all purchased from Sinopharm Chemical Reagent Co., Ltd. Sodium carbonate (Na2CO3), sodium hydroxide (NaOH) and N,N-dimethylformamide (DMF, 99.8%) were purchased from Beijing Chemical Works. Sodium borohydride (NaBH4) was purchased from Aladdin Co., Ltd. All the chemicals were used as received without further purification.
2.2 Preparation of MgAl LDH nanosheets
MgAl LDH nanosheets were prepared by employing a hydrothermal method.31 Mg(NO3)2·6H2O and Al(NO3)3·9H2O were dissolved in deionized water to form solution A, in which the mol ratio of Mg/Al = 3.0. Solution B was prepared by dissolving a certain amount of NaOH and Na2CO3 in deionized water. Solution B was added dropwise into solution A under vigorous magnetic stirring to form a precursor solution. After that, the pH value of the precursor solution was adjusted to 12 by adding a NaOH solution.32 The above precursor solution was continuously stirred for 30 minutes and then put into a Teflon inner vessel within a stainless-steel outer vessel. The vessel was placed in an oven at 140 °C overnight. After the vessel was cooled to room temperature, the reaction product was filtered and rinsed several times with deionized water and ethanol. The white filtered solid was dried in an oven at 80 °C for 12 h to obtain MgAl LDH nanosheets.
2.3 Preparation of Ni–MgAl LDH nanoparticles
The Ni–MgAl LDH nanosheets were prepared by an impregnation reduction method.33 As shown in Fig. 1, the hydroxyl groups enriched on the surface of MgAl LDH can form an electrostatic interaction with Ni2+ in the solution, which means that Ni2+ can well adhere to the surface of MgAl LDH. Under the action of any reducing agent, Ni2+ attached to the MgAl LDH surface was reduced to realize the loading of Ni nanoparticles. The specific experimental process is as follows: first, the MgAl LDH power was added into a Ni(NO3)2 solution under vigorous stirring for 2 h to obtain a suspension. Then, the NaBH4 solution was added dropwise into the above suspension and stirring was continued for 4 h. Finally, the product was filtered, washed several times with deionized water and ethanol, and subsequently dried at 70 °C under a N2/H2 stream for 8 h to form Ni–MgAl LDH nanosheets.
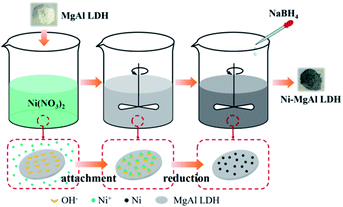 |
| | Fig. 1 Schematic diagram of the preparation of Ni–MgAl LDH nanosheets by an impregnation reduction method. | |
2.4 Fabrication of Ni–MgAl LDH/PVDF nanocomposites
The Ni–MgAl LDH/PVDF nanocomposites were prepared by a solution-casting method.34 The Ni–MgAl LDH nanosheets and PVDF were added into a DMF solvent and mixed by ball-milling for 4 h to obtain a homogeneous mixture. After that, the mixture was casted onto a plate and dried at 80 °C for 8 h in an oven to obtain the nanocomposite films.
2.5 Characterization
The phase compositions of all samples were measured by X-ray diffraction (XRD, Shimadzu Y-2000, Japan) with Cu Kα radiation at a scanning rate of 5° min−1. The morphology study and EDS of Ni–MgAl LDH nanosheets were performed by transmission electron microscopy (JEOL, JEM-2100, Japan). The size of the particles was measured using the ImageJ software. The cross-section morphologies of MgAl LDH/PVDF and Ni–MgAl LDH/PVDF nanocomposites were investigated by scanning electron microscopy (SEM, S-4700, Hitachi, Japan). The element analysis of Ni–MgAl LDH nanosheets was carried out using an X-ray photo-electron spectrometer (XPS, Axis Supra, UK). The crystallization behaviour of pure PVDF and nanocomposites was studied using a differential scanning calorimeter (DSC, Mettler Toledo, Switzerland) at a heating rate of 5 °C min−1 under N2 atmosphere. The crystallinity (XC) was calculated by ΔHf/ΔH100, where ΔHf is the melting enthalpy calculated from the endothermic peak area and ΔH100 (104.6 J g−1 for PVDF) is melting enthalpy with 100% crystallinity. The dielectric constants and dielectric losses of Ni–MgAl LDH/PVDF nanocomposites were measured using a precision impedance analyser (Agilent 4294A, Agilent, USA) at room temperature in the frequency range from 102 to 106 Hz and a voltage amplitude of 1 V. For dielectric properties measurement, a platinum paste was spurted on both sides of the nanocomposite films to form electrodes (9 mm in diameter). DC breakdown strength measurements were performed using a DC HF5013 high-voltage source (HF5013, Changzhou Huiyou Electronics, China) at room temperature and the voltage ramp was 500 V s−1. The breakdown strength of each sample was determined utilizing Weibull statistics on twelve circular specimens with a diameter of 20 mm. The displacement–electric field (D–E) loops of the Ni–MgAl LDH/PVDF nanocomposites were tested at 100 Hz using a ferroelectric test system (Premier II, Radiant Technologies, USA) with a limited current of 1 mA. Before the measurement, the conductive silver paste was evenly coated on both sides of the nanocomposite films. All breakdown and D–E loop measurements were performed in a silicone oil bath.
3 Results and discussion
3.1 Phase compositions and morphology of Ni–MgAl LDH nanosheets and their nanocomposites
Fig. 2 shows the XRD patterns of MgAl LDH and Ni–MgAl LDH nanosheets. The standard PDF cards of cubic-phased Ni and hexagonal-phased MgAl LDH are PDF #04-0850 and PDF #22-0700, respectively.35,36 All diffraction peaks of Ni–MgAl LDH nanosheets are in good agreement with the peaks in the two standard PDF cards. Fig. 3 shows the TEM images and size distribution of Ni–MgAl LDH nanosheets. It can be observed that the MgAl LDH nanosheets are about 200 nm in diameter and the ultra-small Ni nanoparticles (1–2 nm) are well loaded on the surface of MgAl LDH nanosheets. The results of XRD and TEM indicate that the Ni nanoparticles are successfully loaded onto the MgAl LDH nanosheets. Fig. S4† shows the XRD patterns of pure PVDF, MgAl LDH/PVDF and Ni–MgAl LDH/PVDF nanocomposite films, respectively. In the pattern of the pure PVDF film, an obvious diffraction peak appears at 2θ = 20.3°, corresponding to the β-phase (110), and a weak diffraction peak appears at 2θ = 18.3°, corresponding to the α-phase (020).19 PVDF has several different crystalline phases, of which the β-phase has the highest spontaneous polarization, so it has a higher dielectric constant. The α-phase and β-phase of PVDF can still be observed in the patterns of the nanocomposite films. The DSC curves and crystallinity (XC) of pure PVDF, MgAl LDH/PVDF and Ni–MgAl LDH/PVDF nanocomposite films are shown in Fig. S5 and Table S1,† respectively. The results indicate that the introduction of MgAl LDH and Ni–MgAl LDH nanosheets has no obvious effect on the crystallinity of PVDF.
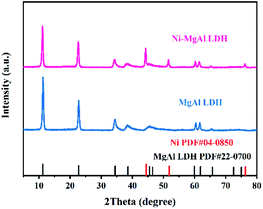 |
| | Fig. 2 XRD patterns of the MgAl LDH nanosheets and Ni–MgAl LDH nanoparticles. | |
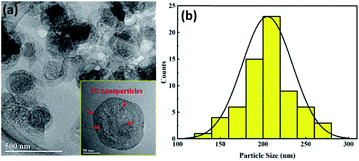 |
| | Fig. 3 (a) TEM images (the inset image is a single Ni–MgAl LDH nanosheet observed at a high magnification) and (b) size distribution of the Ni–MgAl LDH nanosheets. | |
3.2 Dielectric properties and breakdown strength of Ni–MgAl LDH/PVDF nanocomposites
The frequency-dependent dielectric constant and dielectric loss of the Ni–MgAl LDH/PVDF and MgAl LDH/PVDF nanocomposites at room temperature are shown in Fig. 4 and S6,† respectively. As can be seen from Fig. 4(a), at a lower frequency region, the dielectric constant of the Ni–MgAl LDH nanocomposite increases with the decrease in the frequency, while the dielectric constant of pure PVDF is basically unchanged. This is because the introduction of Ni–MgAl LDH nanosheets leads to a strong interfacial polarization, and the degree of polarization increases with the increase in the Ni–MgAl LDH content, resulting in a higher dielectric constant. When the content of Ni–MgAl LDH nanosheets is 0.8 wt%, the dielectric constant of the nanocomposite reaches 10.6 at 1 kHz, which is 15% higher than that of pure PVDF. However, at a higher frequency, the polarization mechanism changes, causing the dielectric constant to decrease.5 As shown in Fig. 4(b), the dielectric loss of the nanocomposites gradually decreases with the increase in the Ni–MgAl LDH content. When the frequency is lower than 104 Hz, the dielectric loss of all nanocomposites is kept at a low level, but raises fast at a higher frequency, which shows the dielectric relaxation characteristics of dielectric materials.37 Additionally, as shown in Fig. 4(c), the Ni–MgAl LDH/PVDF nanocomposites also exhibit a higher dielectric constant and a lower dielectric loss than MgAl LDH/PVDF nanocomposites at 1 kHz, which proves that the MgAl LDH nanosheets loaded with Ni nanoparticles can significantly increase the dielectric properties of the nanocomposites. Such improvement could be attributed to the enhancement of the Maxwell–Wagner–Sillars (MWS) polarization,38 that is, Ni nanoparticles increase the interfacial conductivity between Ni–MgAl LDH nanosheets and the PVDF matrix, allowing a large amount of charges to accumulate at the interface, thus increasing the polarization. Moreover, Ni nanoparticles are separated by thin MgAl LDH nanosheets and the PVDF matrix, which is similar to the parallel connection of multiple micro-capacitors, thereby significantly improving the polarization39 (Fig. 5). It is worth noting that the enhancement of the dielectric constant is achieved at an extremely low filler content, which is very beneficial to maintaining the good processability and flexibility of PVDF. Fig. 6 shows the cross-sectional SEM images of MgAl LDH/PVDF and Ni–MgAl LDH/PVDF nanocomposite films. As seen, the filler particles are uniformly dispersed in the PVDF matrix and due to the low filler content, the distance between filler particles is large, so that there is more free space between the polymer molecular chains, which weakens the constraint on the permanent dipoles and makes them produce enhanced polarization under the applied electric field.40 Besides, the decrease in dielectric loss of Ni–MgAl LDH/PVDF nanocomposites is mainly attributed to the good insulation performance of MgAl LDH nanosheets and the Coulomb blockade effect produced by Ni nanoparticles, which effectively inhibits the migration of electrons.
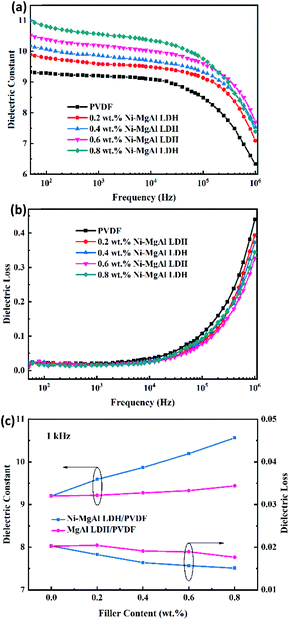 |
| | Fig. 4 (a) Frequency-dependent dielectric constant and (b) dielectric loss of pure PVDF and Ni–MgAl LDH/PVDF nanocomposites with varied Ni–MgAl LDH contents. (c) Dielectric constant and loss of the MgAl LDH/PVDF and Ni–MgAl LDH/PVDF nanocomposites with different filler contents at 1 kHz. | |
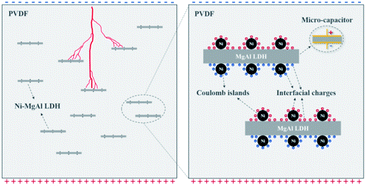 |
| | Fig. 5 Schematic diagram of multiple functions of Ni–MgAl LDH nanosheets in nanocomposites. | |
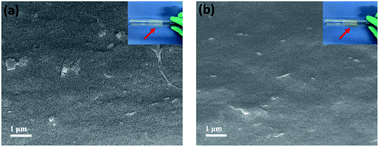 |
| | Fig. 6 Cross-section SEM images of (a) 0.6 wt% MgAl LDH/PVDF and (b) 0.6 wt% Ni–MgAl LDH/PVDF nanocomposite films (the insets are the nanocomposite film images). | |
According to the calculation formula of energy density, the breakdown strength directly affects the energy density of the dielectric nanocomposites and determines its reliability. The breakdown strength of the nanocomposite has been analysed by a two-parameter Weibull statistic distribution method, which is shown in eqn (1):
| |
ln[−ln(1 − P)] = β![[thin space (1/6-em)]](https://www.rsc.org/images/entities/char_2009.gif) ln ln![[thin space (1/6-em)]](https://www.rsc.org/images/entities/char_2009.gif) Eb − β Eb − β![[thin space (1/6-em)]](https://www.rsc.org/images/entities/char_2009.gif) ln ln![[thin space (1/6-em)]](https://www.rsc.org/images/entities/char_2009.gif) α α
| (1) |
where
P is the cumulative probability of electrical failure,
Eb is the measured breakdown field. The scale parameter
α represents the breakdown strength at the cumulative failure probability of 63.2% (Weibull breakdown strength), and shape parameter
β characterizes the scatter of data.
41 Fig. 7(a) gives the Weibull plots of the pure PVDF and nanocomposites with different contents of Ni–MgAl LDH and MgAl LDH nanosheets. The shape parameter
β of all samples is larger than 14, indicating that the prepared nanocomposites have stable breakdown performance. As shown in
Fig. 7(b), the breakdown strength of Ni–MgAl LDH/PVDF nanocomposites increases first and then decreases with the increase in the Ni–MgAl LDH nanosheet content, reaching a maximum value of 640 kV mm
−1 at 0.6 wt%. Further increasing the filler content will lead to a decrease in breakdown strength, which may be due to the proximity of Ni–MgAl LDH nanosheets; it is easy to form conductive channels among Ni nanoparticles. As shown in
Fig. 7(b), Ni–MgAl LDH/PVDF nanocomposites exhibit a higher breakdown strength than that of the MgAl LDH/PVDF nanocomposites, and both are higher than that of pure PVDF. It is confirmed that the breakdown strength of the nanocomposites is enhanced by the synergy of Ni nanoparticles and MgAl LDH nanosheets. On the one hand, Ni nanoparticles loaded on the MgAl LDH nanosheets are electrically insulated from the surrounding materials, can produce Coulomb blockade effect, and act as traps in the charge transport path, thus limiting the charge carrier migration. On the other hand, MgAl LDH nanosheets not only act as carriers, avoiding the contact between Ni nanoparticles to form a conductive network, but also play a role in homogenizing the electric field and inhibiting the growth of electrical tree (
Fig. 5).
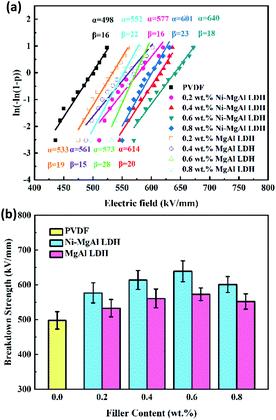 |
| | Fig. 7 (a) Weibull plots and (b) breakdown strength of the pure PVDF and nanocomposites with different mass fractions of Ni–MgAl LDH and MgAl LDH. | |
3.3 Energy storage performance of Ni–MgAl LDH/PVDF nanocomposites
Fig. 8 presents the displacement–electric field (D–E) loops of the Ni–MgAl LDH/PVDF nanocomposites with different Ni–MgAl LDH contents at room temperature. The energy density can be calculated according to the formula  , and charge–discharge efficiency is the ratio of discharged energy density versus the energy density.15 It can be observed in Fig. 8(a) that the electrical displacement of the nanocomposites is significantly improved compared to pure PVDF. The electrical displacement of 0.6 wt% Ni–MgAl LDH/PVDF nanocomposite is the largest (7.11 C m−2), which is 1.48 times larger than that of the pure PVDF (4.82 C m−2). The enhancement of electrical displacement is mainly due to the increased polarization of the nanocomposites after the introduction of Ni–MgAl LDH nanosheets. Meanwhile, with the greatly increased breakdown strength, the energy density of the 0.6 wt% Ni–MgAl LDH/PVDF nanocomposites at 640 kV mm−1 reaches 23.87 J cm−3, which is 1.76 times that of pure PVDF. In addition, compared with pure PVDF, the charge–discharge efficiency of the nanocomposites is also improved (from 55% to 65%). In general, the loops of the nanocomposites will be widened after a ceramic filler or a conductive filler is added into the polymer matrix, which represents the increase in loss.15 However, the loops of Ni–MgAl LDH/PVDF nanocomposites do not appear to be widened, but the addition of Ni–MgAl LDH makes the loops narrow. This is mainly due to the MgAl LDH nanosheets and the Coulomb-blockade effect of the Ni nanoparticles play a role in suppressing the leakage current, thus improving the charge–discharge efficiency. Fig. 8(c) shows the D–E loops of the 0.6 wt% Ni–MgAl LDH/PVDF and MgAl LDH/PVDF nanocomposites under different test electric fields. As can be seen, the introduction of Ni nanoparticles can effectively improve the maximum electrical displacement (Dmax). In addition, the Ni–MgAl LDH/PVDF nanocomposite exhibits a lower remnant polarization (Dr), and hence, the (Dmax − Dr) value is also significantly higher than that of the MgAl LDH/PVDF nanocomposite (Fig. S7†). This further proves that the Coulomb blockade effect caused by Ni nanoparticles can effectively suppress leakage current, thereby reducing losses. Fig. 8(d) shows the energy storage performance of the two nanocomposites. Due to higher electrical displacement and lower loss, the Ni–MgAl LDH/PVDF nanocomposite obtains a higher discharge energy density and efficiency. It was notable that the charge–discharge efficiency of the 0.6 wt% Ni–MgAl LDH/PVDF nanocomposite reaches 83% at 200 kV mm−1, and the discharge energy density is 2.16 J cm−3. The operating electric field of the commercial dielectric material BOPP in the inverter of electric vehicles is usually 200 kV mm−1, but its discharge energy density is less than 0.5 J cm−3 under this condition.42 For further comparison, Fig. 9 shows the discharge energy density of this work and other nanocomposites containing conductive particles decorated inorganic fillers.10,20–22,41,43–48 As illustrated, the nanocomposite prepared by this work exhibits excellent discharge energy density. In addition, the maximum discharge energy density of this work was obtained in the electric field close to the breakdown field strength of BOPP, which is almost 13 times higher than that of BOPP. What is more noteworthy is that the above-mentioned performance is achieved with an ultra-low filler content, which means that the polymer matrix can maintain its original mechanical properties to the greatest extent.
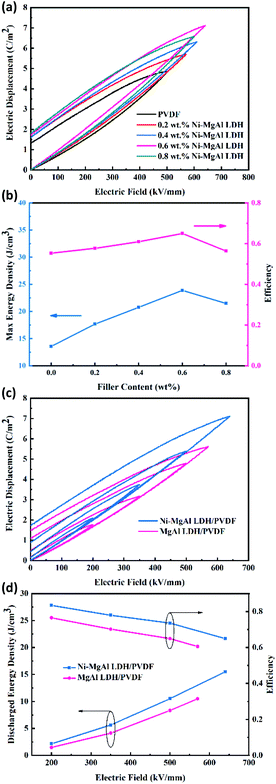 |
| | Fig. 8 (a) D–E loops and (b) energy density and efficiency of the pure PVDF and Ni–MgAl LDH/PVDF nanocomposites with different mass fractions of Ni–MgAl LDH. (c) D–E loops and (d) discharged energy density and efficiency of the 0.6 wt% Ni–MgAl LDH/PVDF and MgAl LDH/PVDF nanocomposites. | |
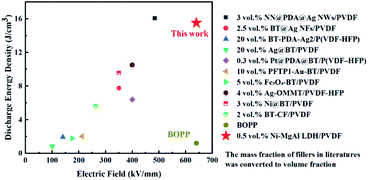 |
| | Fig. 9 Comparison of the discharge energy density between this work and the literature. | |
3.4 Finite element simulations of Ni–MgAl LDH/PVDF nanocomposites
To further clarify the mechanism of improved dielectric properties of Ni–MgAl LDH/PVDF nanocomposites, the distribution of space charge density was simulated by a finite element method. In order to observe more directly, the logarithm of the absolute value of simulation results is adopted.49 As shown in Fig. 10, under the applied electric field, the charges are mainly distributed at the interface of the nanocomposites. The space charge density of the Ni–MgAl LDH/PVDF nanocomposite was significantly higher than that of the MgAl LDH/PVDF nanocomposite. To better understand the simulation results, cross-section models of the space charge density are shown in Fig. 11. The charge density in the PVDF matrix is low due to the good insulation of PVDF and the charges are mainly concentrated near MgAl LDH and Ni–MgAl LDH nanosheets. Moreover, it can be clearly observed that compared with MgAl LDH nanosheets, there are more free charges distributed near Ni–MgAl LDH nanosheets, and the closer to the Ni nanoparticles, the higher the charge density. This is due to the conductivity of Ni nanoparticles (1.4 × 10⁷ S m−1) being much higher than that of MgAl LDH nanosheets (10−5 S m−1) and the PVDF matrix (10−9 S m−1); a large number of charges accumulate around Ni nanoparticles.50,51 These results indicate that the introduction of Ni nanoparticles can effectively improve the space charge density of the nanocomposites, thereby enhancing the interfacial polarization. The simulation results are consistent with the experimental results.
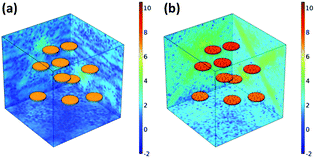 |
| | Fig. 10 Space charge density in three-dimensional model of (a) MgAl LDH/PVDF and (b) Ni–MgAl LDH/PVDF nanocomposites. | |
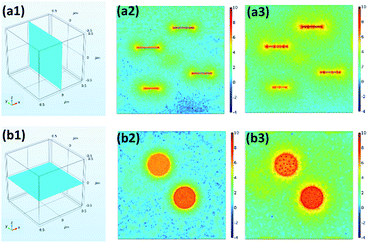 |
| | Fig. 11 (a1) Perpendicular cross-section model, and (a2) space charge density in two-dimensional model of MgAl LDH/PVDF and (a3) Ni–MgAl LDH/PVDF nanocomposites. (b1) Parallel cross-section model, and (b2) space charge density in two-dimensional model of MgAl LDH/PVDF and (b3) Ni–MgAl LDH/PVDF nanocomposite. | |
4 Conclusions
In summary, Ni–MgAl LDH nanosheets have been designed and prepared, and introduced into a PVDF matrix to fabricate dielectric nanocomposites in this work. The dielectric properties, breakdown strength and energy storage performance of Ni–MgAl LDH/PVDF nanocomposites were systematically studied. The dielectric constant and breakdown strength of the nanocomposites were enhanced simultaneously, thus the energy density of the nanocomposites with 0.6 wt% Ni–MgAl LDH nanosheets reached 23.87 J cm−3 at 640 kV mm−1 and the charge–discharge efficiency was 65%. Such a significant enhancement is mainly attributed to the multiple functions of the Ni–MgAl LDH nanosheets under an applied electric field. On the one hand, Ni nanoparticles on the surface of the MgAl LDH nanosheets increased the interfacial conductivity of nanocomposites and formed plenty of parallel micro-capacitors with MgAl LDH nanosheets, which enhanced the polarization, resulting in high dielectric constant. Moreover, the Coulomb blockade effect produced by Ni nanoparticles can suppress the electron mobility and reduce the loss of the nanocomposites, thereby enhancing the breakdown strength and charge–discharge efficiency. On the other hand, MgAl LDH nanosheets have good insulation, medium dielectric constant and sheet structure; these characteristics play the role of homogenizing the electric field and inhibiting the growth of the electric tree, which is beneficial to increase the breakdown strength. Furthermore, simulations were carried out to verify that the structure of MgAl LDH nanosheets loaded with Ni nanoparticles significantly enhanced the polarization. Consequently, this study provides a promising strategy to obtain high-performance dielectric nanocomposites for advanced capacitors.
Conflicts of interest
There are no conflicts to declare.
Acknowledgements
This work was financially supported by National Natural Science Foundation of China (No. 51372014).
Notes and references
- F. H. Liu, Q. Li, Z. Y. Li, Y. Liu, L. J. Dong, C. X. Xiong and Q. Wang, Compos. Sci. Technol., 2017, 142, 139–144 CrossRef CAS.
- K. Yao, S. T. Chen, M. Rahimabady, M. S. Mirshekarloo, S. H. Yu, F. E. H. Tay, T. Sritharan and L. Lu, IEEE Trans. Ultrason. Ferroelectr. Freq. Control, 2011, 58, 1968–1974 Search PubMed.
- H. Luo, X. Zhou, C. Ellingford, Y. Zhang, S. Chen, K. Zhou, D. Zhang, C. R. Bowen and C. Wan, Chem. Soc. Rev., 2019, 48, 4424–4465 RSC.
- Q. Li, F. Z. Yao, Y. Liu, G. Zhang, H. Wang and Q. Wang, Annu. Rev. Mater. Res., 2018, 48, 219–243 CrossRef CAS.
- Prateek, V. K. Thakur and R. K. Gupta, Chem. Rev., 2016, 116, 4260–4317 CrossRef CAS PubMed.
- K. Han, Q. Li, C. Chanthad, M. R. Gadinski, G. Zhang and Q. Wang, Adv. Funct. Mater., 2015, 25, 3505–3513 CrossRef CAS.
- J. K. Yuan, Z. M. Dang, S. H. Yao, J. W. Zha, T. Zhou, S. T. Li and J. Bai, J. Mater. Chem., 2010, 20, 2441–2447 RSC.
- M. F. Guo, J. Y. Jiang, Z. H. Shen, Y. H. Lin, C. W. Nan and Y. Shen, Mater. Today, 2019, 29, 49–67 CrossRef CAS.
- X. Zhang, Y. Shen, B. Xu, Q. Zhang, L. Gu, J. Jiang, J. Ma, Y. Lin and C. W. Nan, Adv. Mater., 2016, 28, 2055–2061 CrossRef CAS PubMed.
- Z. M. Dang, J. K. Yuan, S. H. Yao and R. J. Liao, Adv. Mater., 2013, 25, 6334–6365 CrossRef CAS PubMed.
- X. Zhang, Y. Shen, Z. Shen, J. Jiang, L. Chen and C. W. Nan, ACS Appl. Mater. Interfaces, 2016, 8, 27236–27242 CrossRef CAS PubMed.
- T. Hoshina, J. Ceram. Soc. Jpn., 2013, 121, 156–161 CrossRef CAS.
- Y. Wang, L. Wang, Q. Yuan, Y. Niu, J. Chen, Q. Wang and H. Wang, J. Mater. Chem. A, 2017, 5, 10849–10855 RSC.
- X. Zhang, W. Chen, J. Wang, Y. Shen, L. Gu, Y. Lin and C. W. Nan, Nanoscale, 2014, 6, 6701–6709 RSC.
- S. Wang, X. Huang, G. Wang, Y. Wang, J. He and P. Jiang, J. Phys. Chem. C, 2015, 119, 25307–25318 CrossRef CAS.
- K. Yang, X. Huang, Y. Huang, L. Xie and P. Jiang, Chem. Mater., 2013, 25, 2327–2338 CrossRef CAS.
- Y. Shen, Y. Lin, M. Li and C. W. Nan, Adv. Mater., 2007, 19, 1418–1422 CrossRef CAS.
- C. Wu, X. Huang, X. Wu, L. Xie, K. Yang and P. Jiang, Nanoscale, 2013, 5, 3847–3855 RSC.
- P. Fan, L. Wang, J. Yang, F. Chen and M. Zhong, Nanotechnology, 2012, 23, 365702 CrossRef PubMed.
- K. Yang, X. Huang, J. He and P. Jiang, Adv. Mater. Interfaces, 2015, 2, 1500361 CrossRef.
- L. Xie, X. Huang, B. W. Li, C. Zhi, T. Tanaka and P. Jiang, Phys. Chem. Chem. Phys., 2013, 15, 17560–17569 RSC.
- G. Chen, X. Lin, J. Li, S. Huang and X. Cheng, Appl. Surf. Sci., 2020, 513, 145877 CrossRef CAS.
- Q. Li, K. Han, M. R. Gadinski, G. Zhang and Q. Wang, Adv. Mater., 2014, 26, 6244–6249 CrossRef CAS PubMed.
- H. Li, D. Ai, L. Ren, B. Yao, Z. Han, Z. Shen, J. Wang, L. Q. Chen and Q. Wang, Adv. Mater., 2019, 31, 1900875 CrossRef PubMed.
- Y. Zhou, Q. Li, B. Dang, Y. Yang, T. Shao, H. Li, J. Hu, R. Zeng, J. He and Q. Wang, Adv. Mater., 2018, 30, 1805672 CrossRef PubMed.
- Z. H. Shen, J. J. Wang, Y. Lin, C. W. Nan, L. Q. Chen and Y. Shen, Adv. Mater., 2018, 30, 1704380 CrossRef PubMed.
- S. Saha, M. Jana, P. Khanra, P. Samanta, H. Koo, N. C. Murmu and T. Kuila, ACS Appl. Mater. Interfaces, 2015, 7, 14211–14222 CrossRef CAS PubMed.
- X. Peng, X. Liu, P. Qu and B. Yang, J. Mater. Sci.: Mater. Electron., 2018, 29, 16799–16804 CrossRef CAS.
- S.-M. Xu, T. Pan, Y. B. Dou, H. Yan, S. T. Zhang, F. Y. Ning, W. Y. Shi and M. Wei, J. Phys. Chem. C, 2015, 119, 18823–18834 CrossRef CAS.
- R. Tian, Q. Xu, C. Lu, X. Duan and R. G. Xiong, Chem. Commun., 2017, 53, 7933–7936 RSC.
- T. Hibino and H. Ohya, Appl. Clay Sci., 2009, 45, 123–132 CrossRef CAS.
- M. D. E. Qiu, X. U. Li, A. I. M. Dai, P. Yang, X. Y. Wang and G. Y. I. Bai, Asian J. Chem., 2014, 26, 6740–6744 CrossRef CAS.
- X. Hu, D. Dong, L. Zhang and G. Lu, Catal. Commun., 2014, 55, 74–77 CrossRef CAS.
- S. Liu, T. Ye, Y. Liu, H. Cheng and X. Liu, J. Mater. Sci.: Mater. Electron., 2020, 31, 13063–13069 CrossRef CAS.
- T. Zhu, X. Li, Y. Zhang, M. Yuan, Z. Sun, S. Ma, H. Li and G. Sun, J. Electroanal. Chem., 2018, 823, 73–79 CrossRef CAS.
- Z. Shu, Q. Guo, Y. Chen, J. Zhou, W. Guo and Y. Cao, Appl. Clay Sci., 2017, 149, 13–19 CrossRef CAS.
- R. Diaz-Calleja and E. Riande, Mater. Sci. Eng., A, 2004, 370, 21–33 CrossRef.
- E. Tuncer, Y. V. Serdyuk and S. M. Gubanski, IEEE Trans. Dielectr. Electr. Insul., 2002, 9, 809–828 CrossRef.
- D. Bhadra, S. C. Sarkar and B. K. Chaudhuri, RSC Adv., 2015, 5, 36924–36932 RSC.
- Y. Thakur, T. Zhang, C. Iacob, T. Yang, J. Bernholc, L. Q. Chen, J. Runt and Q. M. Zhang, Nanoscale, 2017, 9, 10992–10997 RSC.
- Prateek, D. Singh, N. Singh, A. Garg and R. K. Gupta, Compos. Sci. Technol., 2019, 174, 158–168 CrossRef CAS.
- Q. Li, L. Chen, M. R. Gadinski, S. Zhang, G. Zhang, H. U. Li, E. Iagodkine, A. Haque, L. Q. Chen, T. N. Jackson and Q. Wang, Nature, 2016, 536, 112 CrossRef CAS PubMed.
- Z. Pan, M. Wang, J. Chen, B. Shen, J. Liu and J. Zhai, Nanoscale, 2018, 10, 16621–16629 RSC.
- J. Chen, X. Yu, F. Yang, Y. Fan, Y. Jiang, Y. Zhou and Z. Duan, J. Mater. Sci.: Mater. Electron., 2017, 28, 8043–8050 CrossRef CAS.
- H. Wang, H. Xie, S. Wang, Z. Gao, C. Li, G. H. Hu and C. Xiong, Composites, Part A, 2018, 108, 62–68 CrossRef CAS.
- L. Wang, X. Huang, Y. Zhu and P. Jiang, Phys. Chem. Chem. Phys., 2018, 20, 5001–5011 RSC.
- X. Huo, W. Li, J. Zhu, L. Li, Y. Li, L. Luo and Y. Zhu, J. Phys. Chem. C, 2015, 119, 25786–25791 CrossRef CAS.
- Q. Wang, J. Zhang, Z. Zhang, Y. Hao and K. Bi, Adv. Compos. Hybrid Mater., 2020, 3, 58–65 CrossRef CAS.
- Y. Liu, Y. Hou, I. Ji, S. Wei, P. Du, L. Luo and W. Li, ACS Appl. Energy Mater., 2020, 3, 3015–3023 CrossRef CAS.
- P. Zhang, T. Yamaguchi, B. N. Nair, K. Miyajima and G. M. Anilkumar, RSC Adv., 2014, 4, 41051–41058 RSC.
- J. Puértolas, J. F. García-García, F. J. Pascual, J. M. González-Domínguez, M. T. Martínez and A. Ansón-Casaos, Compos. Sci. Technol., 2017, 152, 263–274 CrossRef.
Footnote |
| † Electronic supplementary information (ESI) available. See DOI: 10.1039/d1ra01570b |
|
| This journal is © The Royal Society of Chemistry 2021 |
Click here to see how this site uses Cookies. View our privacy policy here.  Open Access Article
 ,
Hongye Li,
Mingyue Du,
Xiaowei Ma,
Xiaolin Liu* and
Lixiong Wen
 *
*
 , where D is the electric displacement and D = εrε0E, where ε0 is the vacuum dielectric constant (8.85 × 10⁻¹² F m−1).6,7 In recent years, extensive research has been carried out on the polymers and fillers that comprise the nanocomposites. Polymers usually have high breakdown strength, but their dielectric constants are relatively low.8 For example, the typical commercial polymer dielectric material biaxially oriented polypropylene (BOPP) has higher than 700 kV mm−1 breakdown strength, but its lower dielectric constant (∼2.2) limits its energy density (∼2 J cm−3).9,10 Another polymer that has been intensively studied is PVDF, which has a higher dielectric constant (∼10) than those of most polymers and relatively high breakdown strength.11 In order to obtain a higher energy density, some fillers were introduced into the polymers, hoping to have an effect on the increase in dielectric constant or breakdown strength. Till now, the types of fillers are considered to be the key factor to enhance the energy storage performance of the nanocomposites, and three typical types are high-εr ceramic fillers, conductive fillers and high insulating fillers, respectively.5,8
![[thin space (1/6-em)]](https://www.rsc.org/images/entities/char_2009.gif) 14 and Ba1−xSrxTiO3
14 and Ba1−xSrxTiO3![[thin space (1/6-em)]](https://www.rsc.org/images/entities/char_2009.gif) 15) with polymers seems to be an effective approach to obtain materials with high dielectric constant and high breakdown strength. However, the dielectric constant of the nanocomposites can be significantly increased only when the filling volume is high enough, which is often at the expense of breakdown strength and processability.16 In addition, adding a small amount of conductive fillers (such as metal particles, carbon nanotubes and graphenes) can also effectively increase the dielectric constant of the nanocomposites.17–19 However, it is accompanied by a large reduction in the breakdown strength due to the huge electrical conductivity difference between the conductive fillers and the polymer matrix. These approaches are very limited in improving the energy density of the nanocomposites as the energy density is dependent on both dielectric constant and breakdown strength. Therefore, researchers have begun to seek methods to increase the breakdown strength while maintaining the dielectric constant unchanged or slightly reduced. One of the effective methods is to introduce ultra-small (<10 nm) metal nanoparticles such as Ag and Ni nanoparticles to produce Coulomb blockade effect.20–22 The ultra-small metal nanoparticles in the insulating environment can act as Coulomb islands to limit the movement of electrons, which enhances the breakdown strength of the nanocomposites.21 For example, K. Yang et al. introduced nano-Ag (3–5 nm)-decorated core–shell polydopamine (PDA)-coated BaTiO3 (BT) hybrid nanoparticles into P(VDF-HFP). Compared with P(VDF-HFP)/BT nanocomposites, the breakdown strength (from 145 to 248 kV mm−1) and energy density (from 2.45 to 3.21 J cm−3) were improved with 20 vol% filler content, but the dielectric constant of the P(VDF-HFP)/BT–PDA–Ag nanocomposites was slightly decreased.20 G. Chen et al. enhanced the breakdown strength (from 358 to 369 kV mm−1) of the PVDF-based nanocomposites by introducing ultra-small Ni nanoparticles (2–3 nm) onto the surface of BT particles, and the discharged energy density of the Ni@BT/PVDF nanocomposites reached 9.55 J cm−3 with 3 vol% Ni@BT at an electric field of 350 kV mm−1. Similarly, compared with the BT/PVDF nanocomposites, the dielectric constant of the Ni@BT/PVDF nanocomposites decreased.22 Although the breakdown strength of nanocomposites can be enhanced by this method, the enhancement is still not satisfactory. This may be due to the large difference in dielectric constant between the BaTiO3 particles and the polymer matrix, resulting in the uneven distribution of electric field in the nanocomposites, which makes it difficult to further increase the breakdown strength. Another method is to add high insulating fillers (such as BN,23 Al2O3
15) with polymers seems to be an effective approach to obtain materials with high dielectric constant and high breakdown strength. However, the dielectric constant of the nanocomposites can be significantly increased only when the filling volume is high enough, which is often at the expense of breakdown strength and processability.16 In addition, adding a small amount of conductive fillers (such as metal particles, carbon nanotubes and graphenes) can also effectively increase the dielectric constant of the nanocomposites.17–19 However, it is accompanied by a large reduction in the breakdown strength due to the huge electrical conductivity difference between the conductive fillers and the polymer matrix. These approaches are very limited in improving the energy density of the nanocomposites as the energy density is dependent on both dielectric constant and breakdown strength. Therefore, researchers have begun to seek methods to increase the breakdown strength while maintaining the dielectric constant unchanged or slightly reduced. One of the effective methods is to introduce ultra-small (<10 nm) metal nanoparticles such as Ag and Ni nanoparticles to produce Coulomb blockade effect.20–22 The ultra-small metal nanoparticles in the insulating environment can act as Coulomb islands to limit the movement of electrons, which enhances the breakdown strength of the nanocomposites.21 For example, K. Yang et al. introduced nano-Ag (3–5 nm)-decorated core–shell polydopamine (PDA)-coated BaTiO3 (BT) hybrid nanoparticles into P(VDF-HFP). Compared with P(VDF-HFP)/BT nanocomposites, the breakdown strength (from 145 to 248 kV mm−1) and energy density (from 2.45 to 3.21 J cm−3) were improved with 20 vol% filler content, but the dielectric constant of the P(VDF-HFP)/BT–PDA–Ag nanocomposites was slightly decreased.20 G. Chen et al. enhanced the breakdown strength (from 358 to 369 kV mm−1) of the PVDF-based nanocomposites by introducing ultra-small Ni nanoparticles (2–3 nm) onto the surface of BT particles, and the discharged energy density of the Ni@BT/PVDF nanocomposites reached 9.55 J cm−3 with 3 vol% Ni@BT at an electric field of 350 kV mm−1. Similarly, compared with the BT/PVDF nanocomposites, the dielectric constant of the Ni@BT/PVDF nanocomposites decreased.22 Although the breakdown strength of nanocomposites can be enhanced by this method, the enhancement is still not satisfactory. This may be due to the large difference in dielectric constant between the BaTiO3 particles and the polymer matrix, resulting in the uneven distribution of electric field in the nanocomposites, which makes it difficult to further increase the breakdown strength. Another method is to add high insulating fillers (such as BN,23 Al2O3![[thin space (1/6-em)]](https://www.rsc.org/images/entities/char_2009.gif) 24 and SiO2
24 and SiO2![[thin space (1/6-em)]](https://www.rsc.org/images/entities/char_2009.gif) 25) to construct a barrier layer, and besides the high intrinsic insulation properties, its morphology also has a great impact on the breakdown strength of the nanocomposites. Compared with 0D and 1D fillers, 2D fillers have a larger specific surface area, which can effectively inhibit the growth of electric tree and block the formation of the breakdown path.26 Therefore, 2D fillers have the best effect on improving the breakdown strength of the nanocomposites. One of the most representative 2D insulating fillers is the BN nanosheets (band gap ∼ 4–6 eV).27 X. Peng et al. prepared BN NSs/PVDF nanocomposites and the breakdown strength of the nanocomposites was significantly improved (from 306 to 486 kV mm−1). However, due to the low dielectric constant of BN, the dielectric constant of BN NSs/PVDF nanocomposites is lower than that of pure PVDF.28 To sum up, there seems to be a compromise between dielectric constant and breakdown strength, which limits the further improvement of the energy density of the nanocomposites.
25) to construct a barrier layer, and besides the high intrinsic insulation properties, its morphology also has a great impact on the breakdown strength of the nanocomposites. Compared with 0D and 1D fillers, 2D fillers have a larger specific surface area, which can effectively inhibit the growth of electric tree and block the formation of the breakdown path.26 Therefore, 2D fillers have the best effect on improving the breakdown strength of the nanocomposites. One of the most representative 2D insulating fillers is the BN nanosheets (band gap ∼ 4–6 eV).27 X. Peng et al. prepared BN NSs/PVDF nanocomposites and the breakdown strength of the nanocomposites was significantly improved (from 306 to 486 kV mm−1). However, due to the low dielectric constant of BN, the dielectric constant of BN NSs/PVDF nanocomposites is lower than that of pure PVDF.28 To sum up, there seems to be a compromise between dielectric constant and breakdown strength, which limits the further improvement of the energy density of the nanocomposites.


![[thin space (1/6-em)]](https://www.rsc.org/images/entities/char_2009.gif) ln
ln![[thin space (1/6-em)]](https://www.rsc.org/images/entities/char_2009.gif) Eb − β
Eb − β![[thin space (1/6-em)]](https://www.rsc.org/images/entities/char_2009.gif) ln
ln![[thin space (1/6-em)]](https://www.rsc.org/images/entities/char_2009.gif) α
α

 , and charge–discharge efficiency is the ratio of discharged energy density versus the energy density.15 It can be observed in Fig. 8(a) that the electrical displacement of the nanocomposites is significantly improved compared to pure PVDF. The electrical displacement of 0.6 wt% Ni–MgAl LDH/PVDF nanocomposite is the largest (7.11 C m−2), which is 1.48 times larger than that of the pure PVDF (4.82 C m−2). The enhancement of electrical displacement is mainly due to the increased polarization of the nanocomposites after the introduction of Ni–MgAl LDH nanosheets. Meanwhile, with the greatly increased breakdown strength, the energy density of the 0.6 wt% Ni–MgAl LDH/PVDF nanocomposites at 640 kV mm−1 reaches 23.87 J cm−3, which is 1.76 times that of pure PVDF. In addition, compared with pure PVDF, the charge–discharge efficiency of the nanocomposites is also improved (from 55% to 65%). In general, the loops of the nanocomposites will be widened after a ceramic filler or a conductive filler is added into the polymer matrix, which represents the increase in loss.15 However, the loops of Ni–MgAl LDH/PVDF nanocomposites do not appear to be widened, but the addition of Ni–MgAl LDH makes the loops narrow. This is mainly due to the MgAl LDH nanosheets and the Coulomb-blockade effect of the Ni nanoparticles play a role in suppressing the leakage current, thus improving the charge–discharge efficiency. Fig. 8(c) shows the D–E loops of the 0.6 wt% Ni–MgAl LDH/PVDF and MgAl LDH/PVDF nanocomposites under different test electric fields. As can be seen, the introduction of Ni nanoparticles can effectively improve the maximum electrical displacement (Dmax). In addition, the Ni–MgAl LDH/PVDF nanocomposite exhibits a lower remnant polarization (Dr), and hence, the (Dmax − Dr) value is also significantly higher than that of the MgAl LDH/PVDF nanocomposite (Fig. S7†). This further proves that the Coulomb blockade effect caused by Ni nanoparticles can effectively suppress leakage current, thereby reducing losses. Fig. 8(d) shows the energy storage performance of the two nanocomposites. Due to higher electrical displacement and lower loss, the Ni–MgAl LDH/PVDF nanocomposite obtains a higher discharge energy density and efficiency. It was notable that the charge–discharge efficiency of the 0.6 wt% Ni–MgAl LDH/PVDF nanocomposite reaches 83% at 200 kV mm−1, and the discharge energy density is 2.16 J cm−3. The operating electric field of the commercial dielectric material BOPP in the inverter of electric vehicles is usually 200 kV mm−1, but its discharge energy density is less than 0.5 J cm−3 under this condition.42 For further comparison, Fig. 9 shows the discharge energy density of this work and other nanocomposites containing conductive particles decorated inorganic fillers.10,20–22,41,43–48 As illustrated, the nanocomposite prepared by this work exhibits excellent discharge energy density. In addition, the maximum discharge energy density of this work was obtained in the electric field close to the breakdown field strength of BOPP, which is almost 13 times higher than that of BOPP. What is more noteworthy is that the above-mentioned performance is achieved with an ultra-low filler content, which means that the polymer matrix can maintain its original mechanical properties to the greatest extent.


