 Open Access Article
Proton exchange membrane and bio-Fenton micro fuel cells for energy harvesting, gas leakage detection, and dye degradation†
Mitali Basak a,
Shirsendu Mitra
 *b and
Partho Sarathi Gooh Pattader
 *ac
*ac
aCentre for Nanotechnology, Indian Institute of Technology Guwahati, Assam 781039, India. E-mail: psgp@iitg.ac.in
bDiscipline of Physics, Indian Institute of Technology Gandhinagar, Gujarat 382355, India. E-mail: shirsenduofficial@gmail.com
cDepartment of Chemical Engineering, Indian Institute of Technology Guwahati, Assam 781039, India
First published on 1st April 2021
Abstract
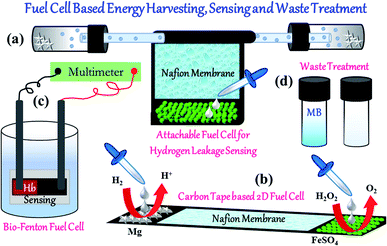
The present work focuses on the non-conventional design and operation of micro fuel cells. Two different kinds of fuel cells, Proton Exchange Membrane (PEM) and Biological Fenton (BF) based fuel cells, are fabricated to harvest energy. For the PEM fuel cell, H2 and O2 are generated by Mg/HCl reaction and Fenton's reaction respectively, and are subsequently fed into two terminals of the PEM fuel cell. For the BF fuel cell, the reaction product of hemoglobin (Hb) with hydrogen peroxide (H2O2) is used as a source of chemical fuel to generate electrical energy within the fuel cell. An array of PEM microscale fuel cells is fabricated to scale up the reaction which can be used for MEMS/NEMS applications. Furthermore, the application of this adhesive and flexible PEM fuel cell as a hydrogen leakage sensor is demonstrated. In the BF fuel cell, an electronic imbalance across a carbon tape is generated owing to the formation of reactive hydroxyl radicals and concurrent electrons in the system. The generation of a highly oxidizing hydroxyl radical is also utilized to degrade Methylene Blue (MB) dye along with energy harvesting. This multi-purpose fuel cell can be synergistically used in industrial applications of waste treatment as well as energy production.
1. Introduction
In recent times, the harvesting of clean energy1,2 and waste treatments3,4 have been two issues needed to be addressed with utmost seriousness. A plethora of literature is available for clean energy harvesting exploiting non-conventional energy sources like seawater chemical energy,5,6 solar energy,7,8 wind energy,9,10 tidal energy,11,12 electrochemical water splitting13 among others. Studies have also been made for the development of efficient electrodes for hydrogen14 or oxygen evolution.15 While continuous energy production from green sources is gaining importance, at the same time, waste management from the adaptation of already existing conventional energy, as well as from industrial and biochemical plants is becoming a crucial topic to sustain. Extensive research has already been devoted to wastewater treatment,16,17 industrial effluent,18,19 nuclear waste,20,21 metal contamination,22 and biological waste treatment.23,24 Advanced oxidation processes, including Fenton's reaction,25 Photo Fenton reaction,26 and electro Fenton reaction27 are a few of the most important technologies currently being followed for waste treatments. Of late, researchers have come up with innovative ideas where energy harvesting and waste treatments are being done synergistically. Microbial fuel cell,28 fuel cells involving Fenton29 and electro Fenton reaction,30 enzymatic fuel cell31 are to name a few where waste treatment and energy harvesting are operational in concurrent mode.Fuel cells are suitable candidates for energy harvesting due to their high energy density. Among various kinds of fuel cells, proton exchange membrane (PEM)32 is the most common type of fuel cell, where H2 and O2 are fed at two terminals of the fuel cell separated by a proton exchange membrane. PEM fuel cell has two electrodes, and a proton exchange membrane separating the two electrode chambers. Proton is generated from hydrogen gas at the anode. The proton then moves through the membrane while developing a potential difference across the two electrodes. Eventually, during the generation of protons from hydrogen gas, excess electrons build up at the anode and the same develops the potential difference.
Among the PEM fuel cell, Nafion (Nf) membrane is a widely used one. H2 being a clean fuel, researchers have targeted production of H2 by electrochemical,33 photochemical,34 and heterogeneous catalysis based water splitting,33 although the processes are a complicated and costly affair. Apart from PEM fuel cells, other types of fuel cells are direct methanol fuel cells,35 alkaline fuel cells,36 phosphoric acid fuel cells,37 molten carbonate fuel cells,38 solid oxide fuel cells,39 and reversible fuel cells.40 Recent developments in this direction are microbial fuel cell,41 membrane-less liquid fuel cell,42 solid oxide fuel cell, etc. In the most recent development, people have also exploited micro-bots43 as a generation source for enhanced efficiency in fuel cells. Flexible devices including fuel cells are becoming popular in recent times for a host of reasons including ease of installation, adjustment of installation area, applicability in harsh environment, material cost of design and fabrication among others.44,45
In what follows, it is understood that despite the availability of ample literature, the emphasis is not given in micro energy harvesting, especially on non-conventional pathways. In this study, we focused on designing a PEM fuel cell on a flexible carbon tape surface with a single embodiment. On the other hand, non-conventional energy harvesting is considered using the Biological Fenton reaction. In hemoglobin, there is a central ferrous (Fe2+) ion that can undergo a biological Fenton reaction and get oxidized (Fe3+) to produce hydroxyl radical in the H2O2 medium. BF based fuel cell prototype was developed to show its potential to generate energy on the micro scale. In this regard, it is to be noted that the fuel cell for large-scale energy production was not targeted. We have addressed the following topics in this paper: (a) generation of energy in PEM and BF type fuel cells, (b) integration of micro PEM fuel cells for adding up potentials, (c) use of flexible fuel cell in making a hydrogen leakage sensor, (d) exploitation of hydroxyl radical generation in BF fuel cell for the methylene blue dye degradation.
2. Materials and methods
2.1. Materials
Nafion (Nf), ferrous sulphate (FeSO4), hydrogen peroxide (H2O2), hemoglobin (Hb), methylene blue (MB), hydrochloric acid (HCl) were obtained from Sigma Aldrich India. Magnesium turnings (∼99.5% purity), connecting pipes, dropper, crocodile clips, and carbon tape (Make: G nano) were procured from local vendors. Glass vials and glass slides were also procured from Sigma Aldrich India.2.2. Instruments
Multimeter (Mastech, MAS 830L), weighing balance, hotplate, desiccator (Lablink), and vacuum pump were used. Raman spectroscopy (Horiba, LabRAM HR Evolution), and UV-Vis spectroscopy (Shimadzu, UV 2700), were used for characterizations of the surface. Goniometer (Holmarc) was used for the measurement of the contact angle on the carbon tape and Nafion coated carbon tape.2.3. Methods
In the second setup, we termed it as fuel cell of kind 2, instead of the H2 fuel bath, ∼40 mg of Mg turnings were deposited on one end of the carbon tape (where Nf film was absent). To the other end of the carbon tape, FeSO4 of ∼15 mg was deposited similar to the fuel cell of kind 1. This second setup of the PEM fuel cell is shown in Fig. 1(b). It is to be mentioned that unlike conventional PEM fuel cells, no catalyst was used for the fabrication of the PEM fuel cells. It was found that the heterogeneous surface of the Nf coated carbon tape is capable of converting hydrogen gas into protons and the same is evident from the generation of the potential. Further, as the PEM fuel cell of kind 1 is used for hydrogen gas sensing purpose, no platinum catalyst is used to augment the rate of potential generation.
3. Characterizations
In general, carbon tape is highly hydrophobic, and hence it does not allow the wetting of water molecules on its surface. However, for the smooth operation of the PEM fuel cell, the wetting surface was mandatory for assisting the permeation of protons through the Nf membrane. The contact angle on bare carbon tape surface was found to be in the range of ∼92° to ∼98° (Fig. 2(a)), whereas, the contact angle on Nf coated carbon tape was in the range of ∼54° to ∼66° (Fig. 2(b)). This shows that the Nf coated surface becomes more hydrophilic compared to untreated carbon tape.The formation of the gases that were fed at the two ends of the PEM fuel cell was ensured using Gas Chromatographic (GC) study. It was mentioned in the previous section that the H2 and O2 gases which were fed in the PEM fuel cell were generated by Mg/HCl and Fenton's reaction, respectively. In a closed vial, the Mg and HCl were allowed to react, and after some time with a GC syringe, gas was collected from the free space and subsequently injected into the GC instrument. Fig. 3(a) shows the retention time plot, which clearly shows the peak for H2. Similarly, Fenton's reaction was also allowed to happen in a closed vial, and gas was collected with a syringe for GC analysis. Fig. 3(b) shows the retention time plot for the same, which has the peak of O2.
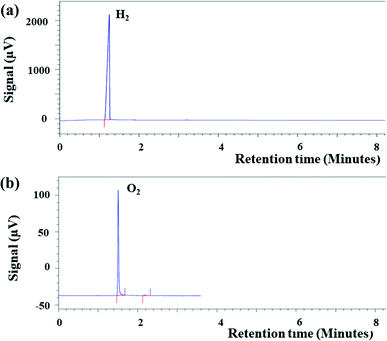 | ||
| Fig. 3 Plot (a) shows the GC peak of H2 obtained from Mg and HCl reaction. Plot (b) shows the GC of O2 obtained from Fenton's reaction. | ||
4. Results and discussion
4.1. PEM fuel cells
In the present work, two prototype setups of the fuel cell of kind 1 and fuel cell of kind 2, of PEM fuel cells were developed on a single platform using Nf coated carbon tape deposited on top of a glass slide base for energy harvesting. The fabrication of both the setups is discussed in Section 2.3.4. In the first setup, as shown in Fig. 4(a), a separate H2 fuel bath was taken, and the generated H2 gas was then supplied to the one end of the PEM fuel cell membrane. On the other end, O2 was generated in the electrode's proximity by the reaction of ∼15 mg FeSO4 with ∼50 μL of 10% H2O2. The reason for such an arrangement was to utilize the maximum amount of H2 generated due to the reaction. It is to be noted that the rate of generation of O2 was kept higher than the rate of generation of H2, in this case. The one end of the carbon tape was connected to the H2 fuel bath using connecting pipes, the other end, O2 was formed directly and fed into the PEM cell. Both the electrodes were connected to the Multimeter using crocodile clips. The Nf membrane surface was made wet with distilled water, which allowed the permeation of the gases generated at the two ends of the carbon tape, which subsequently created a potential drop. A fuel cell setup without Nf showed no potential generation. In the absence of Nf, there was minimal scope for proton permeation, and the hydrophobicity of the carbon tape also hindered the formation of the liquid film.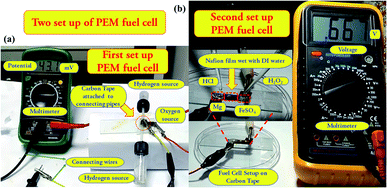 | ||
| Fig. 4 (a) Shows the arrangement of PEM fuel cell of kind 1. (b) Shows the configuration of PEM fuel cell of kind 2. | ||
Similarly, in the second kind of fuel cell, as shown in Fig. 4(b), the magnesium turnings were deposited at one end of the carbon tape, where Nf was absent, and FeSO4 to the other end. These two ends (electrodes) were then connected to the Multimeter to record the change in potential. At first, the Nf coated carbon tape was made wet with a few drops of distilled water to channelize the permeation of ions through the Nf membrane placed between the electrodes. After that, at the one side of the carbon tape, ∼50 μL of 1 N HCl was added in a dropwise manner on the Mg turnings, and on the other terminal, ∼50 μL of 10% H2O2 was added to the FeSO4 using a micropipette, simultaneously. Mg turnings on reaction with HCl generated H2, and FeSO4 on reaction with H2O2 generated O2. Permeation of these gases through the Nf membrane created a potential difference between the two electrodes, as observed in the Multimeter, thus generating energy. In this case, a direct reaction was performed to enhance the potential difference by direct feeding of both the gases.
It was observed that the energy generated in the first arrangement of the PEM fuel cell, as discussed above, was lower as compared to the second set up of the PEM fuel cell. However, the potential in the first case was observed to be stable for a longer time than in the second case, where the potential dropped suddenly. The reason for low potential and longer duration was the slow rate of generation of H2 in the glass vials, less partial pressure accumulation, and the time taken for the transportation of H2 generated in the glass vials to the fuel cell membrane. These reasons made the H2 permeation slower and hence, a slow increase in potential, which became constant after a specific time, and therefore a constant potential was observed. Moreover, as the reaction went to the completion stage in the vials, the rate of H2 generation decreased, and thus the potential also decreased over time. Furthermore, the amount of potential generated can be increased by increasing H2 generation in the vials.
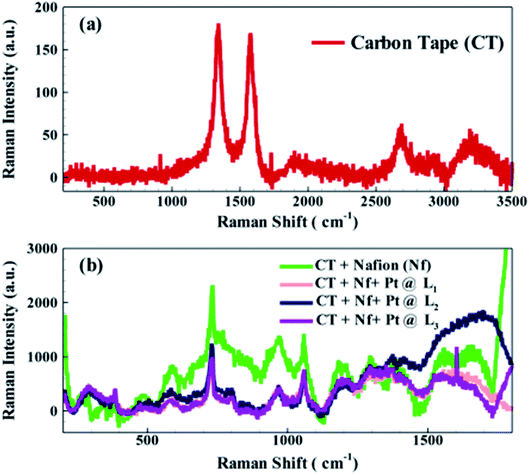
To decipher proton's working mechanism, especially transfer kinetics through the Nf coated carbon tape membrane, Raman characterization was performed for bare carbon tape, and Nf coated carbon tape before and after protonation of the surface. For this Raman characterization, Horiba LabRAM HR Evolution Raman Spectrometer was used with the laser wavelength, accumulation time, acquisition time, modulation, optical magnification, and a grating of 532 nm, 10 s, 4 s, 10%, 20×, and 1800 g mm−1, respectively.
In case of bare carbon tape, two characteristics peaks of carbon, (Fig. 5 (a)), 1323 cm−1 (D band), and 1584 cm−1 (G band) were obtained.46 Raman spectroscopy for Nf coated carbon tape, as shown by the traffic green line in Fig. 5(b), was recorded. The same indicates few new peaks at ∼1355, 1208, 1053, 995, 727, 338 cm−1 corresponding to the presence of Nf.47–49 The acidic moiety of Nf may protonate the π-electron cloud of the carbon tape, thus diminishes the characteristic peak at ∼1584 cm−1 (G band). We further studied the Raman spectroscopy of the Nf membrane after the PEM fuel cell operation, i.e. after protonation from an external hydrogen source. The spectra were taken at different locations (denoted by L1 and L2, and L3), and in all the locations, the peaks for Nf were reduced indicating the interaction between Nf and protons. As the Nf polymer itself has acidic protons on its surface, in the presence of proton permeation no significant change in the carbon tape/Nf was observed except a slight change in intensity.
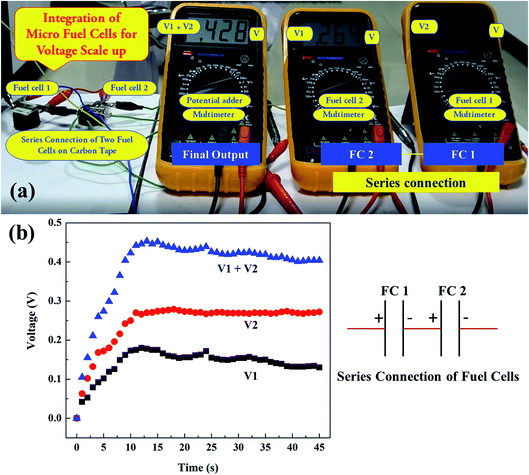
Next, the integration of PEM fuel cells was studied to show the scaling up of the energy when more fuel cells were connected in series. For this, two PEM fuel cells of the second kind, the Fuel cell 1 and Fuel cell 2 were connected in a series configuration. Two Multimeters were connected across each fuel cell, the Fuel cell 1 and Fuel cell 2 separately, whereas a third Multimeter was connected across the two fuel cells connected in series, as shown in Fig. 6(a) and ESI Video 1.† It was observed that the amount of potential generated in the third Multimeter, connected across the series connection of two fuel cells, was higher and approximately equal to the summation of the potential generated from the individual fuel cell i.e. Fuel cell 1 and Fuel cell 2, respectively with minimal losses. Thus, the integration of these micro fuel cells in series can be thought of for large-scale micro energy generation.
We extended our work to determine the potential growth kinetics of the PEM fuel cells. We recorded videos for the potential generation, and the same was further analyzed to get the kinetic data. Fig. 6(b) shows the potential generation kinetics (as a function of time) in Fuel cell 1, Fuel cell 2, and the addition of potentials obtained in two different fuel cells. In this particular arrangement, a potential shoot-up till ∼11 s, after which, a nearly stable plateau region with a slight decrease in potential was observed. The square symbols in black, and the circular symbols in red in Fig. 6(b), indicate the potential generation in the Fuel cell 1 and Fuel cell 2, respectively, whereas the delta symbols in blue indicate the change in potential across the two fuel cells with time. In this regard, it is to be noted that the growth rate might change based on the H2 and O2 flux into the PEM fuel cell membrane and thereby on the rate of inputs of reagents.
The fabricated fuel cell is an excellent candidate for hydrogen leakage sensor because of its adhesion and flexible properties. PEM fuel cell of kind 1, as shown previously in Fig. 4(a), was exploited to develop a leakage sensor. On a carbon tape, Nf was dispensed to make it a proton permeable membrane. Both the ends of the carbon tape were kept bare for higher conductivity purposes as those ends were used as electrodes. For a prototype, we made an arrangement where two culture bottles were connected to the two ends of a polymer tube of ∼0.5 cm by making holes in the caps of the culture bottle. Inside the culture bottle, 0.1 N HCl and Mg turning were kept to generate hydrogen gas. Thus, the generated hydrogen gas was free to pass through the connected tubes. In an experiment, as shown in ESI Video 2,† we deliberately made a small leak on the connected pipe, and Nf coated carbon tape was wrapped around it. After wrapping, both the ends of the carbon tape were connected with a Multimeter. It was observed that when hydrogen leaked through the hole, a potential up to ∼20 mV generated across the ends of the tape, and the same indicated leakage of hydrogen (see Video 2 in ESI†). One interesting thing is that the amount of available oxygen in the air was abundant to create a potential drop. In a second experiment on the opposite end of the leakage, we generated oxygen by Fenton's reaction, and a similar setup showed a potential generation of up to ∼200 mV. Hence, additional oxygen flux enhances the sensor's sensitivity. However, as mentioned earlier, the ambient oxygen was also capable enough to detect the leakage. This kind of flexible and adhesive fuel cell can be used in process industries for instant hydrogen leakage detection. Moreover, the leaked gas was exhausted during the operation of the fuel cell and offers safety at least for initial micro leakage and provide sufficient time to take necessary measure to avoid a disaster. The detailed description of the repeatability and shelf life study done to check the reusability of the developed PEM fuel cell of kind 2, is given in Section S2 of the ESI.†
4.2. Bio-Fenton fuel cell
Next, a proof-of-concept prototype of BF fuel cell, as shown in Fig. 7(a), was developed to harvest energy from Hb and H2O2. The ferrous (Fe2+) ion entrapped in the Hb molecule was responsible for the bio-Fenton reaction, which generated highly reactive hydroxyl radicals. A few of the previous articles also elaborated similar phenomenon of bio-Fenton reaction.50 The setup for the BF fuel cell prototype was described in Section 2.3.6. In this setup, both the electrodes were placed on the same glass slide. A carbon tape was pasted on the glass slide, and one side of the same was coated with ∼40 μL of Hb solution (conc. 3 mg dL−1), and that place was only responsible for the bio-Fenton reaction. The electrode set up was then dipped into a vessel containing 1% (v/v) H2O2 solution. After dipping the electrode system into the vessel, the Hb rich portion of the electrode system remained electron enriched zone as the bio-Fenton reaction generated electrons along with hydroxyl radical formation. Hence, Hb-rich zone served as a cathode due to electrons' presence and on the other part of the electrode set up, where bare carbon tape was present, served as the anode of the fuel cell. As long as the bio-Fenton reaction persisted, the cathode remained as a source of excess electrons, and a difference in potential across the two electrodes was maintained. The potential difference across the two ends of the electrode setup was recorded with the help of a Multimeter. In this case, a potential value of as much as ∼135 mV was obtained across the two ends. The entire operation of this BF fuel cell is shown in ESI Video 3.†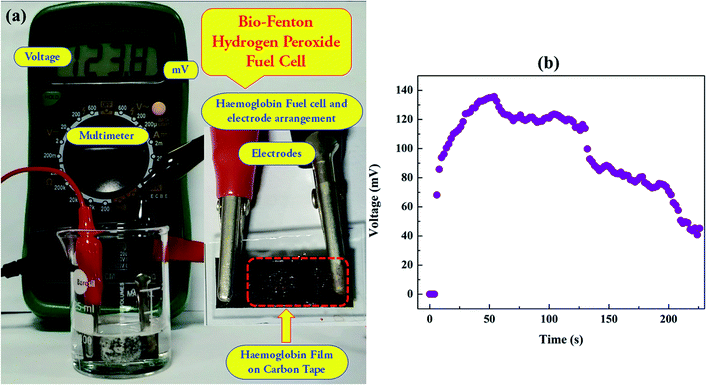 | ||
| Fig. 7 Plot (a) shows the BF fuel cell setup. Plot (b) shows the potential growth kinetics in BF cell. | ||
Fig. 7(b) shows the growth kinetics of developed potential inside BF fuel cell. In this present setup, it was observed that an initial rise time to reach a potential of ∼133 mV was ∼58 s and subsequently, the potential gradually started diminishing with occasional fluctuations. However, for a longer duration i.e. more than 40 min (not shown here), the potential difference between two electrodes persisted, indicating a high lifetime of bio-Fenton reaction. Of course, this lifetime depends on the Hb concentration on the electrode and the concentration of H2O2 in the medium. This proof of concept prototype uncovered an important pathway to harvest energy using medical waste materials that contain blood.
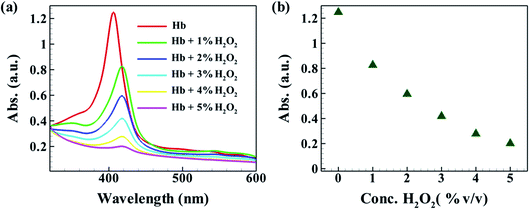
In relevance, it is to be noted that the present article explored the initial development of the model BF fuel cell and deciphered the chemical reactions that took place during the process of energy harvesting from the BF fuel cell. Bio-Fenton reaction, i.e. the reaction between H2O2 and Hb, served the conversion of chemical energy to electrical energy. In a set of experiments, as shown in Fig. 8(a), Hb solution of 0.3 mg dL−1 was allowed to react with different concentrations of peroxide solutions, and UV-Vis absorption spectra were recorded. As intuitive, it was observed that with the increase in the concentration of H2O2, the absorption of the Hb solution gradually decreased, signifying an increase in the extent of reaction and conversion from Fe2+ to Fe3+. The extent of conversion as a function of the concentration of H2O2 is shown with the help of Fig. 8(b). Here, the extent of reaction is represented by the decrease in the intensity of the maximum absorption peak against the concentration of H2O2. The same shows a nonlinear decay of absorption value signifying decay of Hb conc. due to reaction.
Bio-Fenton reaction generates hydroxyl radical, and the same is a strong oxidizing agent.51 The strong oxidizing characteristics of the hydroxyl radicals made it eligible for degradation of waste materials and dyes.52 Here, we exploited the same oxidizing nature of the hydroxyl radical and used the bio-Fenton reaction to demonstrate a proof of concept that Hb can simultaneously exhibit dual operations, – energy generation, and dye degradation. The addition of Methylene Blue (MB) to the bio-Fenton fuel cell, shows discoloration of MB in bio-Fenton fuel cell set up.
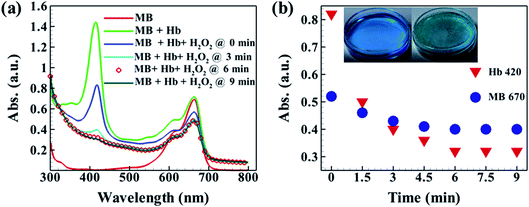
A detail UV-Vis spectrophotometric analysis was made to justify the phenomenon. In Fig. 9(a), UV-Vis spectroscopy of MB and Hb individually, and with H2O2 at different time intervals is represented. The red colored solid line in the plot indicates the UV-Vis spectra of pure MB and the same has absorption maxima at ∼670 nm, whereas the traffic green colored solid line indicates UV-Vis spectra taking MB and Hb together, and the same showed an additional peak at ∼420 nm. Other four spectra, shown in navy blue, sky blue, circular symbols, and dark green show the absorption peaks at different time intervals; 0 min, 3 min, 6 min, and 9 min, on the addition of H2O2 to the MB and Hb solution. It was observed that up to 6 min the absorption peaks for both MB and Hb were reduced, indicating both the components' decay. The bio-Fenton reaction generated the hydroxyl radical with the concurrent generation of electrons and was responsible for creating electrical potential. Fig. 9(b) showed the maximum absorption intensities at wavelength ∼420 nm and at ∼670 nm, a decrease of which indicates the progression of the reaction and the degradation of the dye. The intensity values against time for MB (circular symbols in navy blue) and Hb (delta symbols in red) characteristic peaks are depicted. The hydroxyl radical, thus generated in the bio-Fenton reaction, causes degradation of MB, and the same was observed in this UV-Vis study.
5. Conclusions
In this article, two non-conventional energy harvesting ways in two different kinds of fuel cells were studied. The key findings are summarized as follows:• A 2D PEM fuel cell was developed on a single carbon tape-based platform, where cathode, anode, and proton-exchange membrane all are housed on a single embodiment. The deposition of Nf on the carbon tape made the permeation of protons possible. Also, the Nf made the carbon tape hydrophilic surface and thereby facilitated the flow of an aqueous proton solution.
• A hassle-free methodology was adopted to integrate multiple fuel cells for adding up the potentials to scale up the energy output. The adhesive property and flexibility of the carbon tapes made the integration process easy and simple. This special kind of flexible fuel cell can be applied for the detection of leakage in the H2 line system and is demonstrated in this paper.
• In another type of fuel cell, the bio-Fenton reaction was exploited to harvest electrical energy. It opens up the possibility of the use of medical waste to harvest energy.
• The biological-Fenton-based fuel cell was also exploited for dye degradation, which is a challenging problem for industrial waste treatment to date.
This study will be useful for future multi-dimensional research in energy harvesting, gas sensors, waste management, or a sustainable and synergistic combination of these fields to address bigger challenges toward a green planet.
Author contributions
All the authors designed the experiment. Shirsendu Mitra and Mitali Basak performed the experiments. The manuscript was written through the contributions of all the authors. All the contributing authors made final approval to this version of the manuscript.Conflicts of interest
There is no competing interest and conflict to declare.Acknowledgements
PSGP acknowledges DST SERB, grant no. ECR/2015/000447, partial financial assistance from grant no. CRG/2019/000118 and MeitY – grant no. 5(9)/2012-NANO for financial assistance. SM acknowledges IIT Gandhinagar for financial support during partial compilation of the manuscript.References
- H. Wang, A. Jasim and X. Chen, Energy harvesting technologies in roadway and bridge for different applications–A comprehensive review, Appl. Energy, 2018, 212, 1083–1094 CrossRef.
- Z. Wan, Y. Tan and C. Yuen, Review on energy harvesting and energy management for sustainable wireless sensor networks, 2011 IEEE 13th international conference on communication technology, IEEE, 2011, pp. 362–367 Search PubMed.
- J. Karam and J. A. Nicell, Potential applications of enzymes in waste treatment, J. Chem. Technol. Biotechnol., 1997, 69(2), 141–153 CrossRef CAS.
- A. Houas, H. Lachheb, M. Ksibi, E. Elaloui, C. Guillard and J.-M. Herrmann, Photocatalytic degradation pathway of methylene blue in water, Appl. Catal., B, 2001, 31(2), 145–157 CrossRef CAS.
- X. Song, Z. Liu and D. D. Sun, Energy recovery from concentrated seawater brine by thin-film nanofiber composite pressure retarded osmosis membranes with high power density, Energy Environ. Sci., 2013, 6(4), 1199–1210 RSC.
- Z. Jia, B. Wang, S. Song and Y. Fan, Blue energy: Current technologies for sustainable power generation from water salinity gradient, Renewable Sustainable Energy Rev., 2014, 31, 91–100 CrossRef.
- N. J. Guilar, T. J. Kleeburg, A. Chen, D. R. Yankelevich and R. Amirtharajah, Integrated solar energy harvesting and storage, IEEE Trans. VLSI Syst., 2009, 17(5), 627–637 Search PubMed.
- V. Khullar, H. Tyagi, P. E. Phelan, T. P. Otanicar, H. Singh and R. A. Taylor, Solar energy harvesting using nanofluids-based concentrating solar collector, J. Nanotechnol. Eng. Med., 2012, 3(3), 031003 CrossRef.
- S. Li, J. Yuan and H. Lipson, Ambient wind energy harvesting using cross-flow fluttering, American Institute of Physics, 2011 Search PubMed.
- S. Orrego, K. Shoele, A. Ruas, K. Doran, B. Caggiano, R. Mittal and S. H. Kang, Harvesting ambient wind energy with an inverted piezoelectric flag, Appl. Energy, 2017, 194, 212–222 CrossRef.
- S. Couch and I. Bryden, Tidal current energy extraction: Hydrodynamic resource characteristics, Proc. Inst. Mech. Eng., Part M, 2006, 220(4), 185–194 Search PubMed.
- W. Liu, Q. Xiao and F. Cheng, A bio-inspired study on tidal energy extraction with flexible flapping wings, Bioinspiration Biomimetics, 2013, 8(3), 036011 CrossRef PubMed.
- A. K. Samantara and S. Ratha, Metal Oxides/Chalcogenides and Composites: Emerging Materials for Electrochemical Water Splitting, Springer, 2019 Search PubMed.
- J. K. Das, A. K. Samantara, S. Satyarthy, C. S. Rout and J. Behera, Three-dimensional NiCoP hollow spheres: an efficient electrode material for hydrogen evolution reaction and supercapacitor applications, RSC Adv., 2020, 10(8), 4650–4656 RSC.
- R. K. Tripathy, A. K. Samantara and J. Behera, A cobalt metal–organic framework (Co-MOF): a bi-functional electro active material for the oxygen evolution and reduction reaction, Dalton Trans., 2019, 48(28), 10557–10564 RSC.
- L. Metcalf, H. P. Eddy and G. Tchobanoglous, Wastewater engineering: treatment, disposal, and reuse, McGraw-Hill, New York, 1979 Search PubMed.
- C. L. Grady Jr, G. T. Daigger, N. G. Love and C. D. Filipe, Biological wastewater treatment, CRC Press, 2011 Search PubMed.
- W. Brostow, H. H. Lobland, S. Pal and R. P. Singh, Polymeric flocculants for wastewater and industrial effluent treatment, J. Mater. Educ., 2009, 31(3–4), 157–166 CAS.
- J. Arundel, Sewage and industrial effluent treatment, Blackwell Science Ltd, 2000 Search PubMed.
- C. Hill, J.-F. Dozol, V. Lamare, H. Rouquette, S. Eymard, B. Tournois, J. Vicens, Z. Asfari, C. Bressot and R. Ungaro, Nuclear waste treatment by means of supported liquid membranes containing calixcrown compounds, Calixarenes 50th Anniversary: Commemorative Issue, Springer, 1994, pp. 399–408 Search PubMed.
- N. V. Ashley and D. J. Roach, Review of biotechnology applications to nuclear waste treatment, J. Chem. Technol. Biotechnol., 1990, 49(4), 381–394 CrossRef CAS PubMed.
- C. L. Huff, Method for treatment of heavy metal contamination, WO2000026153, 1999.
- W. W. Eckenfelder and D. J. O'Connor, Biological waste treatment, Elsevier, 2013 Search PubMed.
- G. M. Evans, Biowaste and biological waste treatment, Earthscan, 2001 Search PubMed.
- A. Barros, T. Pizzolato, E. Carissimi and I. Schneider, Decolorizing dye wastewater from the agate industry with Fenton oxidation process, Miner. Eng., 2006, 19(1), 87–90 CrossRef CAS.
- G. Ruppert, R. Bauer and G. Heisler, The photo-Fenton reaction—an effective photochemical wastewater treatment process, J. Photochem. Photobiol., A, 1993, 73(1), 75–78 CrossRef CAS.
- M. Panizza and M. A. Oturan, Degradation of Alizarin Red by electro-Fenton process using a graphite-felt cathode, Electrochim. Acta, 2011, 56(20), 7084–7087 CrossRef CAS.
- H. J. Kim, H. S. Park, M. S. Hyun, I. S. Chang, M. Kim and B. H. Kim, A mediator-less microbial fuel cell using a metal reducing bacterium, Shewanella putrefaciens, Enzyme Microb. Technol., 2002, 30(2), 145–152 CrossRef CAS.
- L. Fu, S.-J. You, G.-q. Zhang, F.-L. Yang and X.-h. Fang, Degradation of azo dyes using in situ Fenton reaction incorporated into H2O2-producing microbial fuel cell, Chem. Eng. J., 2010, 160(1), 164–169 CrossRef CAS.
- X. Zhu and B. E. Logan, Using single-chamber microbial fuel cells as renewable power sources of electro-Fenton reactors for organic pollutant treatment, J. Hazard. Mater., 2013, 252, 198–203 CrossRef.
- D. Leech, P. Kavanagh and W. Schuhmann, Enzymatic fuel cells: Recent progress, Electrochim. Acta, 2012, 84, 223–234 CrossRef CAS.
- V. Mehta and J. S. Cooper, Review and analysis of PEM fuel cell design and manufacturing, J. Power Sources, 2003, 114(1), 32–53 CrossRef CAS.
- J. Wang, W. Cui, Q. Liu, Z. Xing, A. M. Asiri and X. Sun, Recent progress in cobalt-based heterogeneous catalysts for electrochemical water splitting, Adv. Mater., 2016, 28(2), 215–230 CrossRef CAS.
- A. A. Ismail and D. W. Bahnemann, Photochemical splitting of water for hydrogen production by photocatalysis: a review, Sol. Energy Mater. Sol. Cells, 2014, 128, 85–101 CrossRef CAS.
- S. Wasmus and A. Küver, Methanol oxidation and direct methanol fuel cells: a selective review, J. Electroanal. Chem., 1999, 461(1–2), 14–31 CrossRef CAS.
- E. Gülzow, Alkaline fuel cells: a critical view, J. Power Sources, 1996, 61(1–2), 99–104 CrossRef.
- N. Sammes, R. Bove and K. Stahl, Phosphoric acid fuel cells: Fundamentals and applications, Curr. Opin. Solid State Mater. Sci., 2004, 8(5), 372–378 CrossRef CAS.
- A. L. Dicks, Molten carbonate fuel cells, Curr. Opin. Solid State Mater. Sci., 2004, 8(5), 379–383 CrossRef CAS.
- R. M. Ormerod, Solid oxide fuel cells, Chem. Soc. Rev., 2003, 32(1), 17–28 RSC.
- K. Sridhar, M. Gottmann, Combined energy storage and fuel generation with reversible fuel cells, US Pat., US7364810B2, 2008 Search PubMed.
- B. H. Kim, I. S. Chang and G. M. Gadd, Challenges in microbial fuel cell development and operation, Appl. Microbiol. Biotechnol., 2007, 76(3), 485 CrossRef CAS PubMed.
- X. Yu and A. Manthiram, Catalyst-selective, scalable membraneless alkaline direct formate fuel cells, Appl. Catal., B, 2015, 165, 63–67 CrossRef CAS.
- M. Shirsendu, N. Roy, M. Surjendu and B. Dipankar, Multimodal chemo-/magneto-/phototaxis of 3G CNT-bots to power fuel cells, Microsyst. Nanoeng., 2020, 6, 19 CrossRef.
- F. Ning, X. He, Y. Shen, H. Jin, Q. Li, D. Li, S. Li, Y. Zhan, Y. Du and J. Jiang, Flexible and lightweight fuel cell with high specific power density, ACS Nano, 2017, 11(6), 5982–5991 CrossRef CAS PubMed.
- Y. Wang, H. Y. Kwok, Y. Zhang, W. Pan, H. Zhang, X. Lu and D. Y. Leung, A flexible paper-based hydrogen fuel cell for small power applications, Int. J. Hydrogen Energy, 2019, 44(56), 29680–29691 CrossRef CAS.
- N. Roy, S. Mitra, N. M. Das, N. Mandal, D. Bandyopadhyay, H. B. Nemade and T. K. Mandal, Paper Based Enzymatic Chemiresistor for POC Detection of Ethanol in Human breath, IEEE Sens. J., 2019, 20(5), 2278–2286 Search PubMed.
- A. Gruger, A. Régis, T. Schmatko and P. Colomban, Nanostructure of Nafion® membranes at different states of hydration: An IR and Raman study, Vib. Spectrosc., 2001, 26(2), 215–225 CrossRef CAS.
- R. Buzzoni, S. Bordiga, G. Ricchiardi, G. Spoto and A. Zecchina, Interaction of H2O, CH3OH, (CH3)2O, CH3CN, and pyridine with the superacid perfluorosulfonic membrane Nafion: an IR and Raman study, J. Phys. Chem., 1995, 99(31), 11937–11951 CrossRef CAS.
- L. Zhang, C. Pan, J. Zhu and C. Wang, Synthesis and characterization of Nafion®-115 nanowire arrays, Nanotechnology, 2005, 16(10), 2242 CrossRef CAS PubMed.
- A. Karimi, M. Aghbolaghy, A. Khataee and S. Shoa Bargh, Use of enzymatic bio-Fenton as a new approach in decolorization of malachite green, Sci. World J., 2012, 2012, 691569 Search PubMed.
- X. Li, S. Chen, I. Angelidaki and Y. Zhang, Bio-electro-Fenton processes for wastewater treatment: Advances and prospects, Chem. Eng. J., 2018, 354, 492–506 CrossRef CAS.
- C. Hsueh, Y. Huang, C. Wang and C.-Y. Chen, Degradation of azo dyes using low iron concentration of Fenton and Fenton-like system, Chemosphere, 2005, 58(10), 1409–1414 CrossRef CAS PubMed.
Footnote |
| † Electronic supplementary information (ESI) available: Supporting files, supporting videos 1, 2 and 3, are provided along with a document. See DOI: 10.1039/d1ra01378e |
| This journal is © The Royal Society of Chemistry 2021 |

