 Open Access Article
A novel energy efficient path for nitrogen fixation using a non-thermal arc†
Iqbal Muzammil *,
Dae Hoon Lee*,
Duy Khoe Dinh,
Hongjae Kang,
Seon Ah Roh,
You-Na Kim,
Seongil Choi
 ,
Chanmi Jung and
Young-Hoon Song
Department of Environmental and Energy Systems, Korea Institute of Machinery and Materials, 156 Gajeongbuk-Ro, Yuseong-Gu, Daejeon, South Korea. E-mail: dhlee@kimm.re.kr
First published on 1st April 2021
Abstract
Plasma-assisted nitrogen fixation is a promising sustainable and clean alternative to the classical Haber–Bosch process. However, the high energy consumption and low production rate of plasma-assisted nitrogen fixation limit its application. This study shows that the non-thermal (non-equilibrium) enhancement of the arc plasma significantly reduces the energy consumption of nitrogen fixation. The highest energy efficiency with high NO selectivity is observed with a low specific energy input (SEI). However, the highest production rate is reached at a high SEI. The studied process offers high NO selectivity (up to 95%) with low energy consumption (∼48 GJ per tN) at 0.1 kJ L−1 SEI, which is much lower than the previously reported value of plasma-assisted atmospheric nitrogen fixation and is close to that of the Haber–Bosch process.
Introduction
Satisfying global energy needs in a fossil fuel-free and sustainable way is one of the most significant challenges of our times. Although fossil fuel-based energy is still an efficient, cheap, and reliable power source for the chemical industry, the use of renewable energy to convert base molecules (e.g., H2O, CO2, N2, and O2) into value-added compounds (e.g., H2, CO, NH3, and NO) has attracted considerable interest.1–3Nitrogen is an essential element for living beings. The chemical nitrogen fixation process is one of the major chemical processes sustaining the global population.4–6 Since its invention in the early 1900s, the Haber–Bosch process has been used to convert N2 from air into 500 million tons of ammonia, nourishing billions of people annually by consuming about 1–2% of the world's total energy and causing air pollution and greenhouse gas emissions.6–8
The contribution of the Haber–Bosch process to global warming motivated the scientific community to find a more sustainable path for N2 fixation (NF).9–11 The development of the Birkeland–Eyde process in 1903 was one of the earliest attempts of plasma-based NF; in this process, 1% of the nitric oxide is produced by a high-temperature arc discharge.12,13 Subsequently, various types of thermal and non-thermal plasma treatments have been developed for NOx. The produced NO can either be use to produced nitrate (NO3−) in water well-known liquid fertilizer or it can be used for green ammonia production by catalytic NO reduction in hydrogen, by providing additional hydrogen.11,14–18 Recently, the non-thermal plasma treatment has attracted more attention because its theoretical energy efficiency is comparable to that of the Haber–Bosch process.9 Various non-thermal plasma discharge sources have been proposed for NOx production, including dielectric barrier discharge, glows, sparks, and arcs; however, these sources generally have low rate of NOx production along with low selectivity and high energy consumption.19–22 On the other hand, microwave plasma at a reduced pressure can produce NO with low energy consumption of ∼30 GJ per tN for NF and N2 conversion of 14%.23 However, this energy consumption value accounts only for the discharge power used in the reactor. Vacuum equipment is required to induce microwave discharge at low-pressure, which causes additional costs and lowers the applicability of this technique to industrial processes.
The atmospheric pressure gliding arc (GA) discharge, which is typically considered as a “warm” discharge, is an attractive and promising technique owing to its ability to control the degree of non-equilibrium characteristics. The production of NOx with atmospheric pressure GA discharge has been reported in several previous works. Patil et al.24,25 reported 1% NOx production with energy consumption of 103 GJ per tN using a milli-scale GA reactor operated under atmospheric pressure. In a follow-up study, they improved the NOx concentration to 1.4% by using the same milli-scale GA reactor powered by a pulsed power supply; however, the NO selectivity was not improved significantly (∼80%). Wang et al.26 studied the chemical kinetics of NOx production using a pulsed power GA discharge. They proposed that the N2 vibrational excitation contributes significantly to NO formation reactions. They reported an overall NOx yield of approximately 1%. Pei et al.27,28 compared the energy consumptions and NOx yields of dielectric barrier, glow, propeller arc, and spark discharge sources. They reported energy consumptions of 200, 138, and 253 GJ per tN for pin-to-pin DC glow discharge, spark discharge, and arc discharge, respectively, with less than 0.5% NOx yield and low selectivity, whereas the theoretical energy consumption for NOx calculated from the excited states of O and N from non-thermal electron impact is approximately 20 GJ per tN.9
In this study, we produce NOx using rotating GA (RGA) discharge at high air flow rate, which helps reduce the residence time of active species in the discharge area, thus avoiding the undesirable oxidation of NO to NO2 and enhancing the NO selectivity. Our novel arc reactor has a nozzle structure that can focus the arcs into a small volume to increase the energy applied for gas conversion while decreasing the thermal loss.29,30 In addition, RGA plasma reactor is modelled by means of a fluid plasma description. The gas flow pattern and gas temperature distribution in reactor are analyzed. We propose solutions to enhance the non-thermal characteristics of the arc plasma, which can significantly reduce the energy consumption and increase the NO selectivity. The commercialization feasibility of this technology is evaluated and compared with that of previous plasma techniques and the classical Haber–Bosch synthesis.
Experimental
Experimental setup
The main components of the experimental setup are an RGA reactor and an AC power supply. Fig. 1 shows the rotating gliding arc (RGA) plasma reactor adopted in this study. High pressure house air at various flow rates from 20 to 170 L min−1 controlled by a mass flow controller was fed tangentially into the reactor through two holes at the bottom of the cylindrical ground to provide a swirling flow to rotate the arc. At a controlled condition, the arc can be anchored at the nozzle exit without further elongation into the narrow tube. The anchoring and heat transfer of the arc produces jet stream with high temperature and chemically active condition. The arc discharge was driven by an AC power source Dawonsys (ARC-10K/1601-01) with a high-voltage transformer that could supply up to 12 kV and current up to 6 A at a frequency of 20 kHz. A Tektronix P6015A high-voltage probe (1000:1) and a Tektronix TCP303 current probe were employed to measure the voltage and current, respectively. The electrical signals were monitored using a four-channel PC oscilloscope (Tektronix TDS5054B). The sampling rate of the voltage and current was 2 million samples per second (or 2 MHz), which was sufficiently high to perform direct integration with an AC frequency of 20 kHz. Further details about the influence of the air flow rate on the voltage–current signal for the rotating arc reactor are provided in the ESI (Fig. S1†).Experiments were conducted under atmospheric pressure using different input powers between 200 and 2000 W and air flow rates between 20 and 170 L min−1. Fourier transform infrared spectroscopy (Tensor 27) was performed for real-time product analysis, and the results were verified by using a commercially available emission monitoring system (MRU Air Fair) based on infrared and electrochemical sensors (ESI; Fig. S2†). A thermocouple was placed 200 mm downstream from the nozzle to measure the downstream gas temperature. The reactor temperature was measured by infrared (IR) thermal camera (NEC TH9100) and the thermal images were analyzed by ThermoNote software to determine the temperature profile of the reactor. Although the gas and reactor temperatures did not exactly reflect the temperature inside the reaction chamber owing to non-uniform temperature distribution inside the reactor, the thermocouple and IR image measurements could be used as a relative qualitative comparison of the thermal environment inside the reactor under different experimental conditions. The optical emission spectrum from the arc discharge was recorded using a multichannel spectrometer (Ocean Optics, Maya 2000 Pro) with a measurement range of 200–1000 nm and resolution 0.5 nm. The RGA reactor modeled based on the exact design, used experimentally, by using finite element based code COMSOL® Multiphysics (COMSOL®, Inc., Burlington, MA).
Performance assessment
Performance of the RGA reactor induced NF reaction was assessed by reviewing the total NOx production, NO selectivity, and energy consumption analyses. Here, the discharge power, Pdis, specific energy input (SEI), energy consumption (in GJ per tN), ENOx, and NO selectivity were respectively defined as follows:
 | (1) |
 | (2) |
 | (3) |
 | (4) |
Results and discussion
The specific energy input (SEI), defined as the electrical power per unit of reactant volume, is the main parameter for the determination of the bulk gas temperature in the reactor chamber and the control of the non-thermal characteristics of the arc discharge. For example, an increase in the air flow rate at a given electrical power results in faster cooling of the arc column by the airflow; this, in turn, results in a lower arc temperature and thus, a larger difference between the temperature of the electrons and the gas, which enhances the non-equilibrium (non-thermal) state. Meanwhile, the change in the arc length, defined as the distance from the high-voltage electrode tip to the nozzle, changes the reaction time. The time of contact between the gas and arc volume is longer for a longer arc length, resulting in longer reaction time. The elongation of the arc also results in higher efficiency of conversion from electrical power to heat or it can provide more heat for the reactant gas for the same SEI basis.29,30The reactor with nozzle structure produces reactive arc jet stream down of the nozzle exit with arc inside anchored at the nozzle exit and depending on the SEI and flow rate, the length of the plasma jet is controlled resulting in different effective reaction volume. The reaction volume is defined by the volume covered by arcs and jet area, as the average temperature of the bulk reactant in the jet area can be few thousands of Kelvin, which is sufficient for O2 and N2 dissociation. The control on reaction volume by tuning jet area has its significance as most follow up reactions that involve formation and destruction of NO and NO2 occur in the jet area due to its gradually shrinking temperature from thousands of Kelvin to room temperature.
Effects of arc length
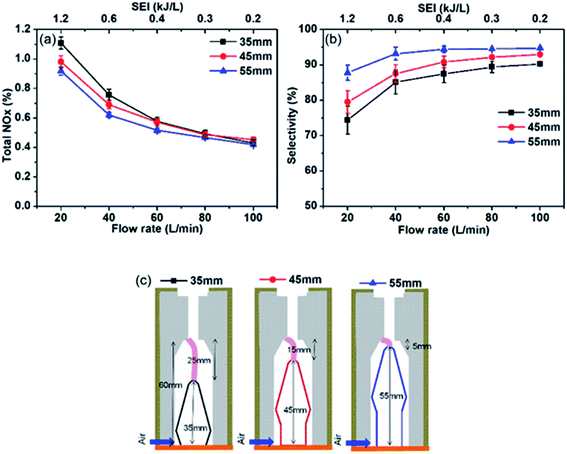
Fig. 2 shows the total NOx production and NO selectivity as a function of the flow rate and SEI. The figure reveals that the total NOx production is higher with a longer arc length (25 mm) at a lower air flow rate or higher SEI. For example, the total NOx production is 1.1%, 0.98%, and 0.90% at SEI of 1.2 kJ L−1 with an arc length of 25, 15, and 5 mm, respectively. The higher NOx production with a longer arc length might be related to the change in reaction time scale or residence time of air in the reaction volume of the reactor because with longer arc length most of the gas that flows through reactor also experience arc discharge. The effect of the arc length on the NOx production is reduced as the flow rate increases at the same power (lowering SEI), or the gas flow rate can change the residence time of active species in the arc discharge. The decrease in the difference in NOx production between different arc lengths at a higher gas flow rate and lower SEI indicates that the effect of the electrode length decreases because the difference in the residence time decreases. A similar phenomenon can be observed in the NO selectivity (Fig. 2b). At 20 L min−1 (1.2 kJ L−1 SEI), the NO selectivity is 74%, 79%, and 88% for an arc length of 25, 15, and 5 mm, respectively. The decline in the NO selectivity at lower flow rates shows that the NOx production process is followed by NO oxidation owing to the higher plasma jet lengths (or longer species residence time in the arc and jet). Further discussion on the arc and jet lengths and controllability of the reaction time and average gas temperature are presented in a subsequent section (gas and reactor temperature). The NO selectivity increases with the increase in the flow rate or decrease in SEI; at the air flow of 100 L min−1, the NO selectivity is 95%, 93%, and 90% for the arc lengths of 25, 15, and 5 mm, respectively. A similar decrease in the NO selectivity with different discharge lengths was observed in a previously reported air glow discharge.27 The 14% difference in NO selectivity at arc lengths of 25 and 5 mm at low flow rates decreased to 4% at an air flow rate of 100 L min−1 (0.24 kJ L−1 SEI) as the role of high flow rate to reduce residence time of active species is more significant as compared to that of arc length.NOx concentration and energy cost
Fig. 3 depicts the effect of the electrical power on the NOx production, energy consumption, and selectivity. It can be seen that the increase in electrical energy increases the NOx production; at an SEI of 2.7 kJ L−1, 1.3% NOx production is achieved (Fig. 3a), and this production can be further increased by increasing the SEI (Fig. S3†). The high NOx concentration at high electrical power with a low flow rate (high SEI) can be attributed to the extended plasma jet due to the high gas temperature and high residence time. A previous study showed that the thermal plasma is related to a high SEI, corresponding to either high electrical power or a low flow rate.31 The highest NOx yield consumed more than 300 GJ per tN of energy. The increase in the NOx production is always accompanied by high energy consumption; hence, a trade-off exists between the NOx concentration and energy cost in the plasma NF. The higher NOx production with higher energy consumption demonstrates that most of the electrical energy is spent on heating the gas or the electrodes (Fig. 4 and 5). Therefore, the NOx production is high due to the combined contribution of thermal oxidation and plasma chemistry. The NO formed during air discharge is quickly oxidized to NO2 owing to the large reaction volume which lowers the NO selectivity at high SEI (Fig. 3c). However, the NO selectivity is still higher than the NO2 selectivity owing to the dissociation of NO2 into NO and O at highly thermal conditions. The detailed analysis, of NOx formation and loss reactions is presented in the ESI.†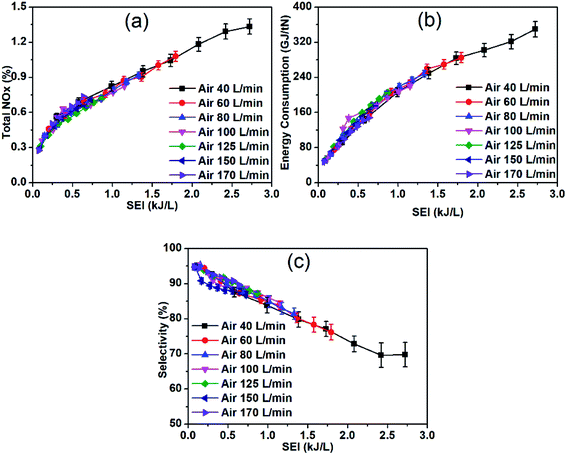 | ||
| Fig. 3 (a) Total NOx production, (b) energy consumption, and (c) NO selectivity as a function of the specific energy input at various air flow rates. | ||
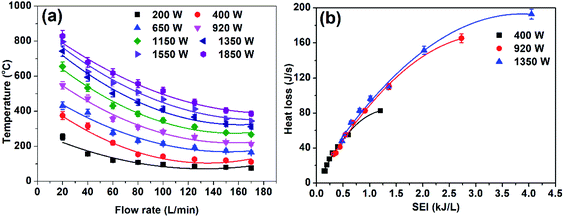 | ||
| Fig. 4 (a) Gas temperature as a function of the air flow rate, and (b) heat loss to the high-voltage electrode as a function of SEI. | ||
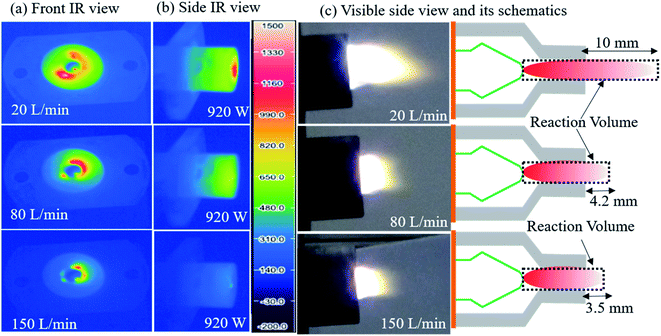 | ||
| Fig. 5 Infrared (a) front and (b) side views, (c) visible images and schematic diagrams showing enhanced non-thermal characteristics of plasma. | ||
The continuous and smooth decrease in the energy consumption with the decrease in SEI indicates the enhancement in the non-thermal plasma. The control of the degree of non-equilibrium of non-thermal plasma is more effective because the RGA involves properties of both phases.32 Generally, a strong thermal arc is required for higher production, and a non-thermal arc is required for higher selectivity and energy efficiency of the plasma chemistry reaction. Depending on the required chemical processes, the non-equilibrium degree can be tuned.
The decrease in the electrical power and the increase in the flow rate (decrease in SEI) decreases the production of NOx (both NO and NO2). However, the decrease in NO2 production is higher than that of NO production owing to the lower reaction volume and gas temperature at higher flow rates, which prevents further oxidation of NO, resulting in a high NO selectivity (∼95%), as shown in Fig. 3c. The higher flow rate with lower electrical power (lower SEI) enhances the degree of non-equilibrium in the plasma process, i.e., the temperature of the electrons is higher than that of the ions and neutral gas. As previously shown that vibrational excitation of N2 molecules has a great influence on plasma chemistry of gliding arc that facilitates the splitting of strong N2 triple bond and promotes NOx formation.26,33,34 When the gas temperature is high at high SEI the rate of vibrational–translational (VT) relaxation increases, hence depopulating the vibrational levels. However, the fast cooling at low SEI (high gas flow, low power) prevents these VT relaxation processes from taking place and hence relatively long lifetime of the vibrationally excited molecules promotes NOx formation. Consequently, at low SEI, due to the combined low thermal loss and vibrationally-promoted Zeldovich mechanisms in non-thermal plasma resulting in the energy consumption of ∼48 GJ per tN for NF, which is comparable to that of the classical Haber–Bosch process (∼30 GJ per tN) and significantly lower than for thermal plasma NOx formation. However, the NOx yield is only ∼0.3%. The high energy efficiency at lower SEI is due to the low-thermal plasma effect.26
Gas and reactor temperature
The concept of non-thermal enhancement was verified by checking the bulk gas temperature and the heat loss of the electrodes, which is one of the key factors that decrease the energy efficiency during the arc discharge (Fig. 4). The heat loss from the electrodes is calculated by our previously reported method, which shows that the heat loss due to the high voltage and ground electrodes are approximately the same. In this study, we only computed the heat loss of the high-voltage electrode, which is roughly the same as the heat loss of the ground electrode.35 Fig. 4a shows that, at a low flow rate and high power condition (high SEI), the temperature of the bulk gas is very high (∼800 °C) at 200 mm downstream from the arc, indicating the thermal character of arc plasma; the heat loss to the high-voltage electrode was about 200 J s−1 (Fig. 4b). The constant drop in the gas temperature and heat loss as the flow rate increases with low power (lowering SEI) indicates the enhancement on the degree of non-equilibrium characteristic of plasma. The gas temperature in the jet discharge area also shows a similar trend (optical emission spectroscopic diagnostics Fig. 6 and 7).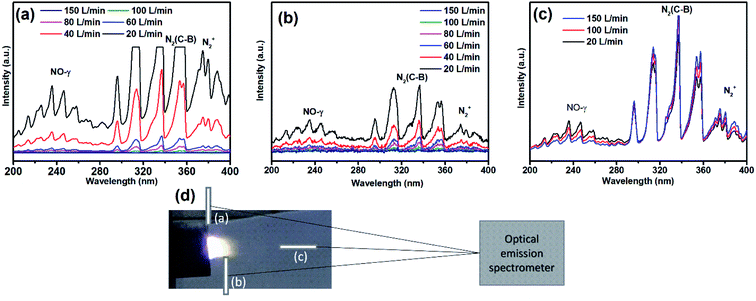 | ||
| Fig. 6 Optical emission spectra of (a) plasma jet close to reactor nozzle, (b) 10 mm from reactor nozzle, and (c) arc discharge at 200 mm distance, as shown in (d). | ||
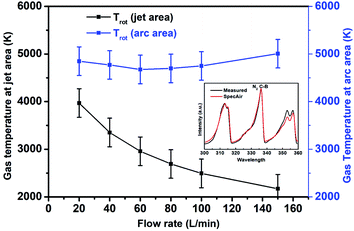 | ||
| Fig. 7 Gas temperatures during air discharge at the jet and arc areas measured from optical emission spectra. Graph inset shows a comparison between SpecAir and measured spectrum. | ||
The decrease in electrical power and increase in flow rate (lowering SEI) caused the downstream gas temperature to drop to about 100 °C, which ensured a low energy consumption due to the reduced heat loss, as confirmed by the infrared images (Fig. 5a and b). The infrared images at 920 W power and 20, 80, and 150 L min−1 flow rates show that with a low flow rate, the heat loss to the reactor is high, as indicated by the red (hot) area in the reactor surface, and as the flow rate increases, the heat loss to reactor decreases, as indicated by the blue (cold) area in the reactor surface. The decline in reactor walls temperature and heat loses due to high flow rate was verified by gas flow modeling of novel rotating gliding arc reactor (Fig. 8). The gas flow rate also has a significant influence on the plasma jet length. When the air flow rate is 20 L min−1, the interaction between the plasma jet and the external air is weak, and the jet area is large (∼35 mm2 area), as shown in Fig. 5c. When the air flow rate is 150 L min−1, the plasma jet flow becomes more turbulent; then, the interaction with the outside air becomes stronger, resulting in a smaller jet area (∼8 mm2), which helps to stop the reaction, quickly quenching the possible oxidation of NO and decreasing the thermal loss. The lower jet volume caused by the increased flow rate is further verified using optical emission spectroscopy (OES) and gas temperature distribution in the simulated reactor at various flow rates (Fig. 6, 7, and ESI Fig. S5†).
Plasma diagnostics by optical emission spectroscopy (OES)
The air discharge optical emission spectra were recorded for the characterization of the plasma species and measurement of the temperatures. The light emitted by the air discharge was collected at three different locations via an optical fiber, as shown in Fig. 6. The presence of NO-γ and N2(C–B) emission lines in the jet area (Fig. 6a and b) indicates that the plasma jet is effective in producing the NOx species. The high emission lines from plasma jet at low SEI (low flow) indicate high reaction volumes that result in low selectivity of NO, as NOx production process is followed by NO oxidation owing to the higher plasma jet lengths. The reduction in the jet volume at low SEI (high flow rate) as reflected in the continuously decreasing emission lines resulted in high NO selectivity and high energy efficiency due to less residence time and heat loss respectively. Further, the fast cooling at low jet volume also promotes vibrational excitation as explained in previous section. The increase in the air flow rate reduced the length and trailing volume of the plasma jet. The optical emission spectra obtained from the arc area are significantly different when compared with those from the jet area, as shown in Fig. 6c. The emission spectra in the arc regions show the high intensity of NO-γ at low flow rate. As the flow rate increases, the NO-γ intensity decreases, and the N2(C–B) intensity surprisingly increases. The inverse relationship between NO-γ and N2(C–B) is attributed to the fact that the spectrometer at point c (Fig. 6d) collects light from both the arc and jet areas, and the decrease in the NO-γ intensity indicates a reduction in the plasma jet volume whereas the increase in the N2(C–B) intensity reflects the relatively increased emissions from the arc area. These results support our assertion that the reaction volume is large at low flow rates, resulting in high NOx production with low selectivity. These results also verified by fluid plasma description of reactor (Fig. 8 and 9).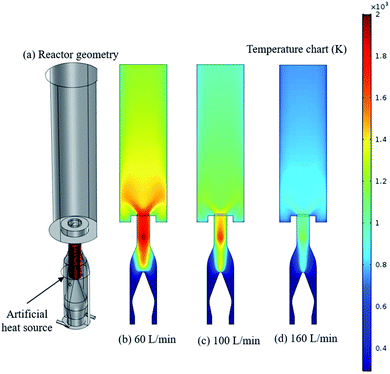 | ||
| Fig. 9 Reactor geometry (a) with a cylindrical shape to act as a heat source and gas temperature distribution in the reactor for air flow rate of (b) 60 L min−1 (c) 100 L min−1 (d) 160 L min−1. | ||
The gas temperature was estimated by fitting the emission spectra to the simulated spectral lines of the N2(C–B) emission using SpecAir software.36–38 The vibrational temperature does not show significant variations in the arc and jet areas and remains at ∼6000 K. Fig. 7 only shows the variations in the rotational temperature. Note that the gas temperature estimated by curve fitting of the emission line shows the trend of gas temperature versus flow rate and does not represent the exact values, as the temperature in an arc plasma reactor is not uniform. The arc column itself contains highly energetic electrons of a few eV, which is most suitable for efficient vibrational excitation.37 The gas temperature in the jet area, 10 mm away from the reactor nozzle (at point b in Fig. 6d), continuously falls as the flow rate increases. This result indicates a reduction in the reaction volume as observed from IR and visible camera measurements, which helps to stop reaction quickly, also quenching the possible oxidation of NO and decreasing the thermal loss. The lower reaction volume and less thermal loss is also verified modeling gas flow pattern and temperature distribution in the reactor and these are in reasonable agreement with the experimental findings (Fig. 8 and 9). The observed gas temperature in the arc area does not change significantly owing to the emission contributions of the plasma jet and arc.
Gas flow pattern and gas temperature distribution inside the novel rotating gliding arc reactor
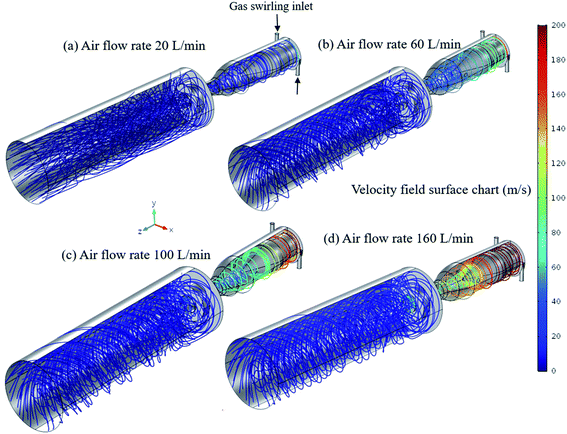
The gas velocity streamlines in the RGA reactor with a nozzle (as used in experiments) were indicated in Fig. 8, calculated by solving the Navier–Stokes equations for a Newtonian fluid. A turbulent RANS model (k-epsilon) was used, based on the commercial software COMSOL® Multiphysics (COMSOL®, Inc., Burlington, MA). There are two tangential gas inlets and gas flow rate was specified according to the experimental conditions. The outlet is defined as a zero-gradient outflow boundary with no flux at the reactor wall and a no-slip condition.The air inlet flow rate ranges from 10 to 160 L min−1 in the model. In Fig. 8, the gas velocity streamlines are plotted without plasma for the four cases with 20, 60, 100 and 160 L min−1 airflow in the 3D geometry. The velocity magnitude goes up to 200 m s−1 inside the reactor, suggesting highly turbulent air flow. The air flow coming from the two tangential inlets forms a high-speed peripheral stream along the reactor walls. The two tangential inlets in the reactor essentially act as a swirl generator. For lower air flow rate the velocity magnitude is similar throughout the reactor that is around 20 m s−1 that causes high heat loss to walls of reactors as it is also observed in Fig. 4 and 5. As the air flow rate increases, the air velocity near the walls of the reactor increases while the inner flow velocity remains relatively constant, the flow velocity at the sidewall has its maximum value that is ∼200 m s−1 for flow rate of 160 L min−1 (Fig. 4d). The central part velocity is at a minimum, this low-speed central air flow surrounded by high-speed flow not only stabilizes the arc plasma in the center but also provides better thermal insulation, which reduces heat loss as observed in Fig. 4 and 5 (main manuscript). Therefore, with high air flow rate, the outer strong swirl air flow can isolate the arc column from the reactor more effectively to further reduce thermal loss and prolongs the lifetime of the reactor. Nevertheless, in general, the calculated results for heat loss show good agreement with the experiments.
In Fig. 9a, an artificial heat source (cylindrical shape) that simulates the arc discharge volume was applied to study the gas temperature inside the reactor at different gas inlet flow rates. The artificial heat source was 2000 W, the convective heat loss to the reactor wall was also included (h = 500 W m−2 K−1). The spatial distribution of gas temperature for various gas flow rates are shown in Fig. 9. As is evident with low flow rate, reaction volume is high due to high temperate condition (Fig. 9b) and heat loss to the reactor wall is also high as the gas temperature near the sidewalls of the reactor is ∼1400 K. The similar reactor wall temperature behavior was also observed during IR imaging. High reaction volume during low air flow rate causes further oxidation of NO to form NO2, and high heat loss causes high energy cost as it was observed during NOx production (Fig. 3). As discussed in the previous paragraph at high flow rate most of the mass transfer takes place from the walls to the center that effectively insulates central heat from the sides, so plasma (high temperature zone) itself can be confined within the inner flow, which leads to a higher degree of ionization with low energy cost. Fig. 9d shows gas temperature distribution at a high flow rate, the reaction volume shrinks (high temperature zone) that prevents further oxidation of NO, so we get high selectivity. In addition to lower reaction volume, the cool gas near walls also provides excellent thermal insulation to plasma (high temperature zone) that prevents heat loss. Although it might not be completely accurate because of model limitations, we can conclude, high flow rate reaction volume is low and plasma can be well insulated from the side walls. Thus, the walls are almost thermally isolated from the plasma, protecting them from the high temperature resulting in low energy consumption. The trends of the simulated and experimental gas flow pattern and temperature distribution are in excellent agreement.
Benchmarking of our results against results from other studies
To benchmark our results against those reported in available literature, we performed a comparison, as shown in Table 1. The operating conditions (flow rate, SEI) and results for NOx production (concentration, energy consumption, and selectivity) are compared among the previous results and our work. Our results yield the highest NOx concentration among all the available gliding arc atmospheric plasma results. At the flow rate of 20 L min−1 and SEI of 2.7 kJ L−1, we achieved the highest NOx concentration of 1.8% with energy consumption of 497 GJ per tN. As the SEI was decreased to 0.6 kJ L−1 by decreasing the power, the energy consumption decreased to 131 GJ per tN.| Reactor type | Flow rate (L min−1) | SEI (kJ L−1) | NOx con. (%) | Energy cons. (GJ per tN) | Selectivity (%) | Reference |
|---|---|---|---|---|---|---|
| RGA | 20 | 2.721 | 1.8 | 497 | 60 | This work |
| 20 | 0.6 | 0.79 | 131 | 89 | This work | |
| 170 | 0.636 | 0.74 | 148 | 90 | This work | |
| 170 | 0.077 | 0.28 | 48 | 95 | This work | |
| Propeller arc | 3 | 2.66 | 0.4 | 253 | — | 27 |
| Shielded sliding discharge | 1 | 0.1 | 1714 | 75 | 39 | |
| Gliding arc | 2 | 1.4 | 0.9 | 286 | — | 26 |
| Milli scale gliding arc | 1 | 0.58 | 0.95 | 103 | — | 24 and 25 |
| DBD with γ-Al2O3 catalyst | 1 | 0.0027 | 0.5 | 1286 | 70 | 20 |
| Gliding arc plasmatron | 10 | 2.74 | 1.5 | 257 | 93 | 34 |
At the air flow rate of 170 L min−1 0.74% NOx concentration was obtained with energy consumption of 148 GJ per tN at 0.636 kJ L−1 SEI. At this flow rate, the further decrease in SEI to 0.077 kJ L−1 owing to the decrease in power resulted in the lowest energy consumption value of 48 GJ per tN. The results of the milli-scale gliding arc show a similar trend, i.e., for the same gas volume and SEI. However, for this reactor, the energy consumption was higher at 103 GJ per tN whereas that in our work was ∼48 GJ per tN. Our energy consumption is much better than other reported set-ups mentioned in Table 1, but worse than the low pressure MW plasmas, as working at low pressure requires pumping, which requires additional cost and makes it less viable for industrial applications, in addition, they have not been reproduced since then.23 The generation of low-cost NO using air plasma is very promising for sustainable agriculture. The promising results obtained in the RGA on a small scale are encouraging for further research to be performed on reactor up-scaling.
Conclusions
This plasma-assisted nitrogen fixation demonstrated that the increase in the degree of the non-equilibrium condition of the RGA air plasma can replace the traditional Haber–Bosch process in the near future. The energy consumption for nitrogen fixation in our system is ∼48 GJ per tN, and the selectivity of NO is 95%, which is comparable to that of the classical Haber–Bosch process (∼30 GJ per tN). The very high energy efficiency with a high flow rate (∼170 L min−1) of the RGA indicates its superiority over other low-thermal plasmas. It should be emphasized that this low energy consumption is achieved at low SEI with very low NOx concentration. However, further work is needed to get low energy consumption without sacrificing the high conversion rate of N2 by tuning RGA rectors the reactor geometry so that more gas molecules experience arc discharge. Therefore, we still have much room to lower the cost with high NOx concentration by optimization of the discharge condition for the possible replacement of the traditional Haber–Bosch process.Conflicts of interest
There are no conflicts to declare.Acknowledgements
This work was supported by KIMM Institutional program (NK225F) and the KIST Institutional Program (Atmospheric Environment Research Program, Project No. 2E30860-20-P050).Notes and references
- K. Imamura and J. Kubota, Sustainable Energy Fuels, 2019, 3, 1406–1417 RSC.
- A. Bogaerts and E. C. Neyts, ACS Energy Lett., 2018, 3, 1013–1027 CrossRef CAS.
- R. Snoeckx and A. Bogaerts, Chem. Soc. Rev., 2017, 46, 5805–5863 RSC.
- K. Fisher and W. E. Newton, in Catalysts for Nitrogen Fixation, Springer Netherlands, 2004, pp. 1–31 Search PubMed.
- D. W. Lawlor, G. Lemaire and F. Gastal, in Plant Nitrogen, Springer Berlin Heidelberg, 2001, pp. 343–367 Search PubMed.
- C. Hank, A. Sternberg, N. Köppel, M. Holst, T. Smolinka, A. Schaadt, C. Hebling and H.-M. Henning, Sustainable Energy Fuels, 2020, 4, 2256–2273 RSC.
- A. Yapicioglu and I. Dincer, Renewable Sustainable Energy Rev., 2019, 103, 96–108 CrossRef CAS.
- C. Smith, A. K. Hill and L. Torrente-Murciano, Energy Environ. Sci., 2020, 13, 331–344 RSC.
- S. Li, J. A. Medrano, V. Hessel, F. Gallucci, J. Medrano Jimenez, V. Hessel, F. Gallucci, J. A. Medrano, V. Hessel and F. Gallucci, Processes, 2018, 6, 248 CrossRef CAS.
- A. Anastasopoulou, R. Keijzer, S. Butala, J. Lang, G. Van Rooij and V. Hessel, J. Phys. D: Appl. Phys., 2020, 53, 234001 CrossRef CAS.
- J. Sun, D. Alam, R. Daiyan, H. Masood, T. Zhang, R. Zhou, P. J. Cullen, E. C. Lovell, A. Jalili and R. Amal, A hybrid plasma electrocatalytic process for sustainable ammonia production, Energy Environ. Sci., 2021, 14, 865–872 RSC.
- K. R. Birkeland, Trans. Faraday Soc., 1906, 2, 98–116 RSC.
- S. Eyde, Ind. Eng. Chem., 1912, 4, 771–774 CrossRef CAS.
- S. Goldstein, D. Behar, T. Rajh and J. Rabani, J. Phys. Chem. A, 2015, 119, 2760–2769 CrossRef CAS PubMed.
- J. Yang, T. Li, C. Zhong, X. Guan and C. Hu, J. Electrochem. Soc., 2016, 163, E288–E292 CrossRef CAS.
- L. Hollevoet, F. Jardali, Y. Gorbanev, J. Creel, A. Bogaerts and J. A. Martens, Angew. Chem., Int. Ed., 2020, 59, 23825–23829 CrossRef CAS PubMed.
- L. Sivachandiran and A. Khacef, RSC Adv., 2017, 7, 1822–1832 RSC.
- S. Zhang, A. Rousseau and T. Dufour, RSC Adv., 2017, 7, 31244–31251 RSC.
- S. Pekárek, Plasma Chem. Plasma Process., 2017, 37, 1313–1330 CrossRef.
- B. S. S. Patil, N. Cherkasov, J. Lang, A. O. O. Ibhadon, V. Hessel and Q. Wang, Appl. Catal., B, 2016, 194, 123–133 CrossRef CAS.
- A. A. Abdelaziz and H.-H. Kim, J. Phys. D: Appl. Phys., 2020, 53, 114001 CrossRef CAS.
- L. Lin, H. Xu, H. Gao, X. Zhu and V. Hessel, J. Phys. D: Appl. Phys., 2020, 53, 133001 CrossRef CAS.
- R. Asisov, V. Givotov, V. Rusanov and A. Fridman, Sov. Phys. High Energy Chem., 1980, 14, 366 Search PubMed.
- B. S. Patil, J. Rovira Palau, V. Hessel, J. Lang and Q. Wang, Plasma Chem. Plasma Process., 2016, 36, 241–257 CrossRef CAS.
- B. S. Patil, F. J. J. Peeters, G. J. van Rooij, J. A. Medrano, F. Gallucci, J. Lang, Q. Wang and V. Hessel, AIChE J., 2018, 64, 526–537 CrossRef CAS.
- W. Wang, B. Patil, S. Heijkers, V. Hessel and A. Bogaerts, ChemSusChem, 2017, 10, 2110 CrossRef CAS.
- X. Pei, D. Gidon and D. B. Graves, J. Phys. D: Appl. Phys., 2020, 53, 044002 CrossRef CAS.
- X. Pei, D. Gidon, Y. J. Yang, Z. Xiong and D. B. Graves, Chem. Eng. J., 2019, 217–228 CrossRef CAS.
- D. K. Dinh, D. H. Lee, M. Iqbal, H. Kang, S. Choi, C. M. Jung, Y. H. Song, S. Jo and K. T. Kim, Plasma Chem. Plasma Process., 2020, 40, 483–497 CrossRef CAS.
- D. K. Dinh, D. H. Lee, Y. H. Song, S. Jo, K. T. Kim, M. Iqbal and H. Kang, RSC Adv., 2019, 9, 32403–32413 RSC.
- O. Mutaf-Yardimci, A. V Saveliev, A. A. Fridman and L. A. Kennedy, J. Appl. Phys., 2000, 87, 1632 CrossRef CAS.
- D. H. Lee, K. T. Kim, H. S. Kang, S. Jo and Y. H. Song, Plasma Chem. Plasma Process., 2014, 34, 111–124 CrossRef CAS.
- F. Jardali, S. Van Alphen, J. Creel, H. Ahmadi Eshtehardi, M. Axelsson, R. Ingels, R. Snyders and A. Bogaerts, Green Chem., 2021, 23, 1748–1757 RSC.
- E. Vervloessem, M. Aghaei, F. Jardali, N. Hafezkhiabani and A. Bogaerts, ACS Sustainable Chem. Eng., 2020, 8(26), 9711–9720 CrossRef CAS.
- D. Khoe Dinh, D. H. Lee, Y. H. Song, S. Jo and K. T. Kim, J. CO2 Util., 2018, 28, 274–282 CrossRef CAS.
- M. Gharagozalian, D. Dorranian and M. Ghoranneviss, J. Theor. Appl. Phys., 2017, 11, 171–180 CrossRef.
- J. Zhu, A. Ehn, J. Gao, C. Kong, M. Aldén, M. Salewski, F. Leipold, Y. Kusano and Z. Li, Opt. Express, 2017, 25, 20243–20257 CrossRef CAS PubMed.
- K. Liu, W. Ren, C. Ran, R. Zhou, W. Tang, R. Zhou, Z. Yang and K. Ostrikov, J. Phys. D: Appl. Phys., 2020, 54, 65201 CrossRef.
- M. A. Malik and K. H. Schoenbach, J. Phys. D: Appl. Phys., 2013, 46, 145201 CrossRef.
Footnote |
| † Electronic supplementary information (ESI) available: (S1) Current and voltage characteristics. (S2) Reaction mechanism for high NO selectivity. See DOI: 10.1039/d1ra01357b |
| This journal is © The Royal Society of Chemistry 2021 |


