 Open Access Article
An investigation of broadband optical nonlinear absorption and transient nonlinear refraction in a fluorenone-based compound†
Xingzhi Wu *a,
Jinchong Xiao
 b,
Yanbing Hanc,
Jiabei Xua,
Wenfa Zhouc,
Yang Li
 a,
Yu Fanga,
Yongqiang Chena,
Quanying Wua and
Yinglin Song
 *cd
*cd
aJiangsu Key Laboratory of Micro and Nano Heat Fluid Flow Technology and Energy Application, School of Physical Science and Technology, Suzhou University of Science and Technology, Suzhou 215009, China. E-mail: wuxingzhi@usts.edu.cn
bCollege of Chemistry and Environment Science, Key Laboratory of Chemical Biology of Hebei Province, Hebei University, Baoding 071002, China
cDepartment of Physics, Harbin Institute of Technology, Harbin 150001, China. E-mail: ylsong@hit.edu.cn
dDepartment of Physics, Soochow University, Suzhou 215123, China
First published on 29th April 2021
Abstract
A novel fluorenone derivative, FO52, is designed and synthesized. The fluorenone group is introduced to provide the central π-conjugated system in the molecule and triphenylamine is substituted at both sides. Intramolecular Charge Transfer (ICT) from the terminal groups to the molecular center is confirmed via DFT calculations. Ultrafast optical nonlinearities are investigated via Z-scan and transient absorption spectroscopy (TAS) studies with a 190 fs laser. Reverse saturable absorption, two-photon induced excited-state absorption, and pure two-photon absorption are observed at 532 nm, 650 nm, and 800 nm, respectively. The different mechanisms at these wavelengths are discussed and interpreted with assistance from the results from TAS. Furthermore, strong excited-state refraction and ultrafast negative refraction from the bound electron response are resolved and discussed in phase object pump probe (POPP) experiments. The results suggest that the ICT-enhanced optical nonlinearities provide FO52 with strong optical limiting capabilities at visible wavelengths and ultrafast refraction with tiny attenuation in the near infrared region. The combination of these properties in one compound could be attractive for applications like laser protection and low-loss all-optical switching.
1. Introduction
Research into nonlinear optics began decades ago after the invention of laser in 1960s. Various applications such as harmonic generation, optical limiting and all optical switching (AOS) have been developed.1,2 To realize these applications, nonlinear optical (NLO) materials are indispensable. Among all the NLO materials, organic materials have attracted substantial attention due to their large molecular optical nonlinearity, relatively easy synthesis and tailoring.3 To optimize the NLO response in organic NLO materials, one feasible way is to introduce electron donor or acceptor groups into the molecule as the intramolecular charge transfer (ICT) could enhance optical nonlinearity in numerous organic molecular systems.4 The relationship between ICT and molecular optical nonlinearity has been studied in many π-conjugated systems such as phthalocyanines,5 pyrene derivatives,6–10 thiophene derivatives11–13 and benzothiadiazole derivatives.14–16Fluorenone, as an aromatic organic group, is usually employed as an electron acceptor in ICT molecules. Due to their high photostability and bright fluorescence,17–19 fluorenone dyes have been synthesized and studied as probes for cell imaging.20,21 Besides, the enhanced optical nonlinearity via ICT provides fluorenone-based compounds with a superior multi-photon response, which further extends the excited wavelengths towards the infrared region. Taking advantage of this property, fluorenone derivatives display great potential in applications like multi-photon microscopy21–24 and second harmonic generation (SHG).25,26 However, although multi-photon absorption27,28 in fluorenone derivatives has been reported many times, systematic investigations into excited-state associated nonlinear absorption are rare.29–31 Furthermore, most of the research focuses on nonlinear absorption (NLA), little attention has been paid to the ultrafast nonlinear refraction (NLR) in fluorenone derivatives.
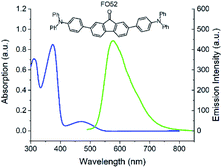
Here in this work, a novel NLO compound FO52 is designed and synthesized. Fluorenone is employed as the core of the molecule with triphenylamine linked at both sides (Fig. 1). The ultrafast nonlinear absorption and refraction at various wavelengths are systematically studied. The magnitudes of NLA & NLR are estimated and the ultrafast mechanisms of NLA & NLR are investigated via transient absorption and refraction experiments. The combined research of NLA and NLR could help us gain a more comprehensive understanding of the excited-state optical nonlinearity in fluorenone derivatives and the additional information from NLR could provide a different perspective to consider the structure–property relationship in these compounds.
2. Experimental section
2.1 Synthesis and characterization
The synthetic procedure is depicted in Scheme 1.A (338 mg, 1 mmol), B (723 mg, 2.5 mmol), K2CO3 (1.38 g, 10 mmol) and THF/H2O (v/v = 20 mL/10 mL) were added into a 120 mL pressure flask in order. Pd(PPh3)4 (81 mg, 0.07 mmol) was added after filling with nitrogen (5 min) and the reaction proceeded at 85 °C for 16 h. After that, saturated salt solution and dichloromethane were used for extraction. All solvent was removed through decompression concentration, purification was carried out with a silica gel column with V(petroleum ether)![[thin space (1/6-em)]](https://www.rsc.org/images/entities/char_2009.gif) :
:![[thin space (1/6-em)]](https://www.rsc.org/images/entities/char_2009.gif) V(dichloromethane) = 4
V(dichloromethane) = 4![[thin space (1/6-em)]](https://www.rsc.org/images/entities/char_2009.gif) :
:![[thin space (1/6-em)]](https://www.rsc.org/images/entities/char_2009.gif) 1 used as the eluent. A red solid product was obtained (502 mg, 76%). The 1H NMR, 13C NMR and MS characterization can be found in the ESI.†
1 used as the eluent. A red solid product was obtained (502 mg, 76%). The 1H NMR, 13C NMR and MS characterization can be found in the ESI.†
FO52:1H NMR (600 MHz, CDCl3, 298 K), δ:7.84 (d, 2H, J = 1.2 Hz), 7.65–7.63(dd, 2H, J = 7.8 Hz), 7.49–7.48(d, 2H, J = 7.8 Hz), 7.46–7.45(d, 4H, J = 9.0 Hz), 7.25–7.23(m, 8H), 7.11–7.10(m, 12H), 7.03–7.01(t, 4H); 13C NMR (150 MHz, CDCl3, 298 K), δ = 194.06, 147.92, 147.61, 142.72, 141.61, 135.35, 133.49, 132.67, 129.48, 127.53, 124.79, 123.62, 123.35, 122.52, 120.77. MS (MALDI-TOF, m/z): Calc. for C49H34N2: [m/z] 666.27, found: [m/z] 666.27. HR-MS (m/z): Calc. for C49H34N2: [m/z] 666.2671, found: [m/z] 666.2662.
2.2 Nonlinear optical experiments
3. Results and discussion
3.1 UV-vis absorption and fluorescence
The UV-Vis absorption and fluorescence spectra of the FO52 toluene solution (∼10−5 M) are recorded and displayed in Fig. 1. Several absorption peaks can be found in the FO52 solution, as well as the absorption peaks at 310 nm and 374 nm, there is a relatively weak absorption peak at 472 nm, which dominates the linear absorption in the visible region. The emission spectrum of the FO52 solution covers a wide spectral range from around 500 nm to 800 nm, the peak wavelength is located at 577 nm.To obtain more information about the linear absorption and fluorescence of FO52, DFT calculations are conducted. The distribution of the frontier molecular orbitals and their corresponding energies are obtained and displayed in Fig. 2. One can find that there is an evident charge transfer towards the fluorenone core of the molecule upon excitation. The calculated energy gap between the HOMO and LUMO is 2.72 eV (456 nm), which is close to the first absorption peak of the FO52 solution at 472 nm. The results indicate that the absorption of FO52 at visible wavelengths has a significant ICT feature.
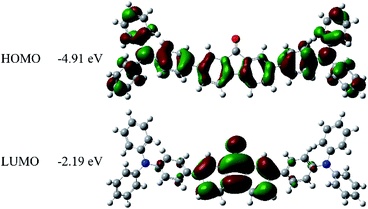 | ||
| Fig. 2 Electronic distributions and energies of the frontier molecular orbitals in FO52 extracted from DFT calculations. | ||
3.2 Z-scan experiments
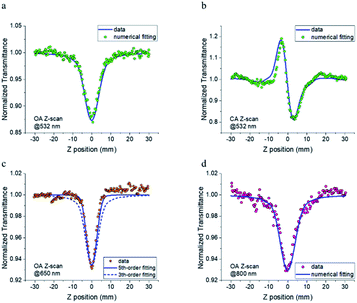
To estimate the intensity-dependent NLA and NLR of FO52, femtosecond Z-scans are conducted at 532 nm, 650 nm and 800 nm, peak intensities are measured to be 24, 66 and 75 GW cm−2, respectively. The linear transmittance measured at these wavelengths are 0.43, 0.99 and 0.99, respectively. The open aperture (OA) and closed aperture (CA) curves are recorded and displayed in Fig. 3. When excited with 532 nm laser pulses, the OA Z-scan curve shows a single valley at the zero position (Fig. 3(a)), indicating that FO52 has strong reverse saturable absorption. Besides, the CA Z-scan in Fig. 3(b) displays a distinct peak-valley shape after removal of the solvent background, which suggests a negative change of the refractive index when the sample passes through the focal spot towards the +z direction and is often referred to as self-defocusing. Note that there is a significant transmittance change between the transmittance peak and valley (ΔTp − ΔTv = 0.4), which indicates a large negative NLR in FO52. Considering that 532 nm is located within the first linear absorption band of the compound solution (Fig. 1), the reverse saturable absorption and negative nonlinear refraction under resonant excitation could both originate from the excited-state optical nonlinearity. When the incident laser wavelength is tuned away from the resonant absorption band, FO52 shows an extremely high transmittance (0.99) at 650 nm and 800 nm. The OA Z-scan records a single valley curve at both 650 nm and 800 nm as shown in Fig. 3(c) and (d). Unlike the 532 nm situation, NLA at 650 nm and 800 nm cannot originate from the one photon induced excited-state absorption, hence we assign the NLA to the multi-photon absorption. Moreover, no sign of NLR could be found after careful comparison between the solution and solvent samples at 650 nm and 800 nm, which is different from the large negative NLR at 532 nm. Furthermore, the transmittance valley at 650 nm in the OA Z-scan is much narrower compared with the 532 nm and 800 nm cases. This narrowing of the OA Z-scan curve is further confirmed by comparing the sample solution with a ZnSe sample in the same Z-scan. This situation suggests the existence of a higher order NLA in FO52 at 650 nm.Numerical simulation based on Sheik Bahae's theory is used to analyse the Z-scan results. The absorption coefficient α and refraction index n could be expanded as:
| α = α0 + βI + (γI2) |
| n = n0 + n2I |
| 532 nm, T = 0.43 | 650 nm, T = 0.99 | 800 nm, T = 0.99 | |
|---|---|---|---|
| FO52 | β = 1.1 × 10⁻¹² m W−1 | β = 0 | β = 1.5 × 10⁻¹³ m W−1 |
| n2 = −1.2 × 10⁻¹⁹ m2 W−1 | γ = 3.5 × 10⁻²⁸ m3 W−2 | σTPA = 412 GM |
One can find that FO52 shows the largest NLA and NLR at 532 nm in our experiments. With the increasing of laser wavelength, the NLA decreases while the NLR is covered by the strong solvent background. As discussed above, the optical nonlinearity of FO52 at 532 nm is dominated by the one photon induced excited-state absorption and refraction. On the other side, the NLA at 650 nm and 800 nm are assigned to multi-photon absorption since the one-photon absorption could be neglected in such a high transmittance. Although both originate from multi-photon absorption, it is interesting to find that the OA curve at 650 nm is much narrower than the 532 nm and 800 nm case. Numerical simulation using third-order NLA cannot fit the OA data at 650 nm (dashed line in Fig. 3(c)). An excellent matching is obtained after the replacing of the third-order term (βI) with a fifth-order term (γI2) in eqn (1). Considering that the possibility of simultaneous three-photon absorption is relatively low, the fifth-order NLA at 650 nm may originate from the two-photon induced excited-state absorption. Recalling the femtosecond laser pulses used in the Z-scan experiment, an excited-state with ultrafast established time and large absorption cross-section is required in such a case. As for the 800 nm case, the OA data could be well fitted by a third-order NLA, indicating that two-photon absorption dominates the NLA at 800 nm. Two-photon absorption is observed in the Z-scan at both 650 nm and 800 nm, however, the promoted electrons on the excited state are likely to absorb another 650 nm photon rather than an 800 nm photon. A much stronger excited-state absorption is expected at 650 nm than 800 nm in this case, which would be investigated via transient absorption.
The NLO coefficients obtained in the Z-scan experiment are compared with some of the reported fluorenone derivatives in Table 2. Compared with other compounds, FO52 displays significant nonlinear refraction and a relatively large absorption cross-section for two-photon absorption. The nonlinear absorption in FO52 is considered to be enhanced by the symmetric π-conjugated system while the nonlinear refraction arises from the significant ICT between the HOMO and LUMO.
3.3 Transient absorption and refraction
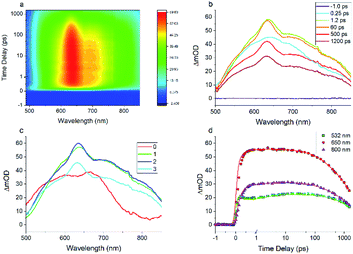
The results of the Z-scan indicate that the excited-state plays a key role in the optical nonlinearity of FO52. Besides, as a single beam measuring technique, the Z-scan could only measure the NLA and NLR within a pulse width. To obtain more information about the ultrafast dynamics of the excited-state optical nonlinearity, investigation into the transient absorption and refraction is conducted.The entire transient absorption spectroscopy (TAS) spectrum ranging from 500 nm to 850 nm is recorded and displayed in a 2D colormap in Fig. 4(a). For more detail, TAS spectra at several selected delay times are extracted and plotted in Fig. 4(b). One can find that the excited-state absorption could be built within a pulse width (<250 fs) and lasts for several nanoseconds. Besides, broadband reverse saturable absorption (ΔmOD > 0) covering wavelengths from 500 nm to 850 nm is observed in the entire delay time window. The recorded ultrafast broadband excited-state absorption in TAS agrees with the measured reverse saturable absorption in the Z-scan at 532 nm. Moreover, one can find that the TAS maintains a similar shape from 0.5 ps to 1.8 ns in Fig. 4(a) and (b), this dominant excited-state absorption in FO52 is assigned to a charge transfer singlet state.
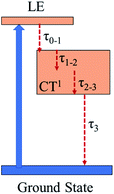
Global and target analysis is employed to numerically reconstruct the TAS data (details of the numerical simulation could be found in the ESI†). To obtain a reasonable fit, four spectral components in total are used and labelled from 0 to 3 in Fig. 4(c) and the results of the numerical simulation at selected wavelengths are plotted in Fig. 4(d). Note that the extracted absorption spectroscopy of the four components can provide information about the evolution of TAS, component 0 represents the ultrafast absorption within a pulse duration while component 3 represents the absorption of the last excited state before the electrons relax back to ground state. Considering the 0 component and the results from the femtosecond Z-scan, reverse saturable absorption could be found at both 532 nm and 650 nm while the absorption at 650 nm is much stronger. The large absorption cross-section at 650 nm and the ultrafast establishing time agrees with the two-photon induced excited-state absorption at 650 nm in the Z-scan results. Furthermore, little absorption could be found in the 0 component at 800 nm, which could be the reason that the two-photon absorption at 800 nm cannot trigger subsequent excited-state absorption as in the 650 nm case. Besides, the lifetimes for the spectral components 0 to 3 are extracted from the simulation as 0.2 ps, 2.1 ps, 240 ps and 2500 ps, respectively (Fig. 5). The 0.2 ps lifetime is assigned to the conversion time from a locally excited (LE) state to the charge transfer state. Since all the 1, 2, and 3 components share a similar spectrum and hence all originate from the charge transfer state, 2.1 ps and 240 ps are assigned to the vibrational cooling processes inside the charge transfer state and 2500 ps is assigned to its lifetime.
The dynamics of NLR are investigated via the phase object pump–probe (POPP) technique. The results of the POPP are shown in Fig. 5 when the sample solution is pumped at 400 nm and probed at 515 nm. The dynamics of NLA in Fig. 6(a) display a strong reverse saturable absorption at zero time, after that the NLA decreases with a lifetime of 2 ps and then maintains for a relatively long lifetime, the probed dynamics of NLA agrees with the above results in Z-scan and TAS experiments. Correspondingly, the dynamics of NLR in Fig. 6(b) show a significant drop at zero time and then maintains for a long time. The results indicate the strong negative excited-state NLR in FO52, which is consistent with the above discussion.
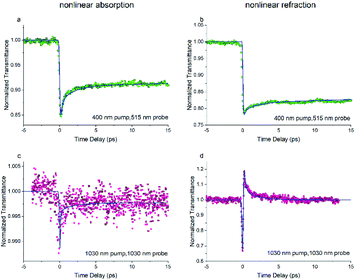 | ||
| Fig. 6 The transient ((a), (c)) nonlinear absorption and ((b), (d)) nonlinear refraction of FO52 probed at 515 nm and 1030 nm. Solid lines represent the results of the numerical simulations. | ||
Since we are more interested in the optical nonlinearity of FO52 in the near infrared, the pump and probe beams are then switched to 1030 nm. The dynamics of NLA and NLR are recorded and displayed in Fig. 6(c) and (d), respectively. The normalized transmittance in Fig. 5(c) drops swiftly at zero time and then is maintained at 0.996 after a fast relaxation. Analogously, the ultrafast absorption at zero time is assigned to the two-photon absorption while the absorption with a relatively long lifetime is assigned to the two-photon induced excited-state absorption. The energy of two 1030 nm photons equals that of a 515 nm photon, while 515 nm is located at the edge of the first absorption band (Fig. 1), hence the two-photon absorption at 1030 nm is very weak. Moreover, the weak two-photon absorption results in fewer excitons in the excited-state, which further suppresses the excited-state absorption. One can find that the maximum change of the normalized transmittance in Fig. 5(c) is about 0.01, indicating that both the two-photon absorption and excited-state absorption are extremely weak at 1030 nm. In contrast, a strong NLR is found in the same experiment and the result is shown in Fig. 6(d). A dramatic drop of transmittance at zero time indicates the strong ultrafast negative NLR in FO52. When the impact of the pump pulse finishes, the NLR experiences an ultrafast switching of sign (from negative to positive) and this positive NLR disappears after a relaxation in about 5 ps. The ultrafast negative NLR in a pulse width is assigned to the response of bound electrons while the positive NLR is assigned to the excited-state refraction. The modulation in intensity (Ip) and phase (φp) of the probe beam can be represented as:36
where z is the propagation length within the sample, NSn represents the population density of the effective energy state Sn, σp,Sn is the absorptive cross section of the excited-state Sn, β here is the two-photon absorption coefficient, and Ie and Ip stand for the intensity of the pump and probe beam, respectively. n2 is the optical nonlinear refractive index of the bound electron response and Δηp,Sn (defined as ηp,Sn – ηp,S0) is the change of the refractive volume between the effective state Sn and ground state S0. Like the discussion in the TAS experiment, we use S0, S1 and S2 to represent the ground state, the charge transfer state and the locally excited (LE) state, respectively. Note that the lifetime of the first excited state (2500 ps as measured in TAS) cannot be resolved here due to the limited delay time. After a series of numerical simulations, β = 0.4 × 10⁻¹³ m W−1 and n2 = −5 × 10⁻¹⁹ m2 W−1 are finally obtained. The details of the rate equations can be found in the ESI† and the parameters are listed in Table 3.
| n | 400 pump, 515 probe | 1030 pump, 1030 probe | τn (ps) | ||
|---|---|---|---|---|---|
| σp,Sn (m2) | Δηp,Sn (m3) | σp,Sn (m2) | Δηp,Sn (m3) | ||
| 0 | 7.4 × 10⁻²³ | 0 | 5.5 × 10⁻²⁴ | 0 | — |
| 1 | 7.7 × 10⁻²¹ | −2.4 × 10⁻²¹ | 5 × 10⁻²¹ | 0 | 250 |
| 2 | 7.7 × 10⁻²¹ | −2.6 × 10⁻²¹ | 8 × 10⁻²¹ | 0.8 × 10⁻¹⁹ | 1.8 |
| 3 | 8.5 × 10⁻²¹ | −2.9 × 10⁻²¹ | 10 × 10−21 | 6 × 10⁻¹⁹ | 0.2 |
| β | 0 | 0.4 × 10⁻¹³ m W−1 | |||
| n2 | 0 | −5 × 10⁻¹⁹ m2 W−1 | |||
3.4 Optical limiting
The strong transient NLR and tiny NLA observed in the infrared region make FO52 an ideal compound for all optical applications in which ultrafast modulation of light and low attenuation of signals are required. Furthermore, the strong excited-state NLA and NLR in the visible region with a relatively long lifetime are also attractive for NLO applications with picosecond or nanosecond laser pulses since more excitons could accumulate in the excited-state. Hence the optical limiting property of FO52 is investigated under a 4 ns, 532 nm laser source and displayed in Fig. 7.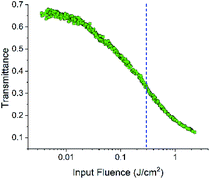 | ||
| Fig. 7 Transmittance variations in the optical limiting measurements; the dashed line indicates the position of the threshold value. | ||
A significant decrease in the transmittance with the increasing input fluence could be observed in FO52. The threshold of optical limiting (defined as the corresponding input fluence when the transmittance decreases to half of the linear transmittance) reaches 0.3 J cm−2 as displayed in Fig. 7. With the further increase of the input fluence, a major part of the input fluence is absorbed. The results of the optical limiting test indicate that FO52 is a promising material for laser protection, which further enriches the applications of this fluorenone based compound.
4. Conclusions
A novel fluorenone compound FO52 is synthesized and the ultrafast optical nonlinearities are investigated. Strong reverse saturable absorption with a negative nonlinear refraction at 532 nm, two-photon induced excited-state absorption at 650 nm, and pure two-photon absorption at 800 nm are characterized with the Z-scan technique. The strong nonlinear refraction and multi-photon absorption are assigned to significant ICT and the symmetric π-conjugated system in FO52, which are revealed via DFT calculations. The transient absorption in the excited state is then investigated with TAS; a charge-transfer state with broadband excited-state absorption and a nanosecond-scale lifetime is observed. The ultrafast dynamics are then resolved via global and target analysis. The different nonlinear refraction responses originating from the excited state and the bound electron response are distinguished in POPP experiments. The strong optical nonlinearities enhanced by ICT and the high-contrast ultrafast nonlinear refraction in FO52 make it a potential material for laser protection in the visible region and low-loss optical applications at near-infrared wavelengths.Conflicts of interest
There are no conflicts to declare.Acknowledgements
The authors gratefully acknowledge the support of the Natural Science Foundation of Jiangsu Province (No. BK20180965, BK20170375), National Natural Science Foundation of China (Grant No. 11804244 and 11704273), and the Jiangsu Province Key Discipline of China's 13th five-year plan (No. 20168765).References
- R. W. Boyd, Nonlinear optics, Academic Press, 2020 Search PubMed.
- B. Gu, C. Zhao, A. Baev, K.-T. Yong, S. Wen and P. N. Prasad, Adv. Opt. Photonics, 2016, 8, 328–369 CrossRef.
- H. S. Nalwa, Adv. Mater., 1993, 5, 341–358 CrossRef CAS.
- D. Dini, M. J. F. Calvete and M. Hanack, Chem. Rev., 2016, 116, 13043–13233 CrossRef CAS PubMed.
- G. de la Torre, P. Vaquez, F. Agullo-Lopez and T. Torres, Chem. Rev., 2004, 104, 3723–3750 CrossRef CAS PubMed.
- J. Sung, P. Kim, Y. O. Lee, J. S. Kim and D. Kim, J. Phys. Chem. Lett., 2011, 2, 818–823 CrossRef CAS.
- M. Planells, M. Pizzotti, G. S. Nichol, F. Tessore and N. Robertson, Phys. Chem. Chem. Phys., 2014, 16, 23404–23411 RSC.
- X. Wu, J. Xiao, R. Sun, J. Jia, J. Yang, G. Shi, Y. Wang, X. Zhang and Y. Song, Dyes Pigm., 2017, 143, 165–172 CrossRef CAS.
- J. Jia, X. Wu, Y. Fang, J. Yang, X. Guo, Q. Xu, Y. Han and Y. Song, J. Phys. Chem. C, 2018, 122, 16234–16241 CrossRef CAS.
- J. Wei, Y. Li, P. Song, Y. Yang and F. Ma, Spectrochim. Acta, Part A, 2021, 245, 118897 CrossRef CAS PubMed.
- T. Jaunet-Lahary, A. Chantzis, K. J. Chen, A. D. Laurent and D. Jacquemin, J. Phys. Chem. C, 2014, 118, 28831–28841 CrossRef CAS.
- N. B. Teran, G. S. He, A. Baev, Y. Shi, M. T. Swihart, P. N. Prasad, T. J. Marks and J. R. Reynolds, J. Am. Chem. Soc., 2016, 138, 6975–6984 CrossRef CAS PubMed.
- J. Jia, X. Zhang, Y. Wang, Y. Shi, J. Sun, J. Yang and Y. Song, J. Phys. Chem. A, 2020, 124, 10808–10816 CrossRef CAS PubMed.
- J. E. Barnsley, G. E. Shillito, C. B. Larsen, H. van der Salm, L. E. Wang, N. T. Lucas and K. C. Gordon, J. Phys. Chem. A, 2016, 120, 1853–1866 CrossRef CAS PubMed.
- K. D. Belfield, M. V. Bondar, S. Yao, I. A. Mikhailov, V. S. Polikanov and O. V. Przhonska, J. Phys. Chem. C, 2014, 118, 13790–13800 CrossRef CAS.
- X. Wu, J. Xiao, R. Sun, J. Jia, J. Yang, G. Ao, G. Shi, Y. Wang, X. Zhang and Y. Song, Opt. Laser Technol., 2018, 102, 93–99 CrossRef CAS.
- F. Xu, H. Wang, X. Du, W. Wang, D.-E. Wang, S. Chen, X. Han, N. Li, M.-S. Yuan and J. Wang, Dyes Pigm., 2016, 129, 121–128 CrossRef CAS.
- F. Lincker, B. Heinrich, R. De Bettignies, P. Rannou, J. Pécaut, B. Grévin, A. Pron, B. Donnio and R. Demadrille, J. Mater. Chem., 2011, 21, 5238–5247 RSC.
- L. A. Estrada and D. C. Neckers, J. Org. Chem., 2009, 74, 8484–8487 CrossRef CAS PubMed.
- A. L. Capodilupo, V. Vergaro, G. Accorsi, E. Fabiano, F. Baldassarre, G. A. Corrente, G. Gigli and G. Ciccarella, Tetrahedron, 2016, 72, 2920–2928 CrossRef CAS.
- S. Chi, L. Li and Y. Wu, J. Phys. Chem. C, 2016, 120, 13706–13715 CrossRef CAS.
- J. Liu, G. Li and Y. Wang, J. Phys. Chem. A, 2012, 116, 7445–7451 CrossRef CAS PubMed.
- A. L. Capodilupo, V. Vergaro, E. Fabiano, M. De Giorgi, F. Baldassarre, A. Cardone, A. Maggiore, V. Maiorano, D. Sanvitto, G. Gigli and G. Ciccarella, J. Mater. Chem. B, 2015, 3, 3315–3323 RSC.
- W. Zhang, W. Liu, P. Li, J. kang, J. Wang, H. Wang and B. Tang, Chem. Commun., 2015, 51, 10150–10153 RSC.
- J. Xu, S. Semin, D. Niedzialek, P. H. J. Kouwer, E. Fron, E. Coutino, M. Savoini, Y. Li, J. Hofkens, H. Uji-I, D. Beljonne, T. Rasing and A. E. Rowan, Adv. Mater., 2013, 25, 2084–2089 CrossRef CAS PubMed.
- X. Jialiang, S. Sergey, C. Jonathan, W. Linjun, S. Matteo, F. Eduard, C. Eduardo, C. Thibault, W. Chunliang, L. Yongjun, L. Huibiao, L. Yuliang, T. Paul, P. H. J. Kouwer, T. W. Ebbesen, H. Johan, B. David, A. E. Rowan and R. Theo, Adv. Opt. Mater., 2015, 3, 948–956 CrossRef.
- T. H. Huang, X. C. Li, Y. H. Wang, Z. H. Kang, R. Lu, E. L. Miao, F. Wang, G. W. Wang and H. Z. Zhang, Opt. Mater., 2013, 35, 1373–1377 CrossRef CAS.
- T. H. Huang, D. Yang, Z. H. Kang, E. L. Miao, R. Lu, H. P. Zhou, F. Wang, G. W. Wang, P. F. Cheng, Y. H. Wang and H. Z. Zhang, Opt. Mater., 2013, 35, 467–471 CrossRef CAS.
- L. A. Estrada, J. E. Yarnell and D. C. Neckers, J. Phys. Chem. A, 2011, 115, 6366–6375 CrossRef CAS PubMed.
- T. Gerbich, J. Herterich, J. Köhler and I. Fischer, J. Phys. Chem. A, 2014, 118, 1397–1402 CrossRef CAS PubMed.
- J. Köhler, P. Hemberger, I. Fischer, G. Piani and L. Poisson, J. Phys. Chem. A, 2011, 115, 14249–14253 CrossRef PubMed.
- M. Sheik-Bahae, A. A. Said, T.-H. Wei, D. J. Hagan and E. W. Van Stryland, IEEE J. Quantum Electron., 1990, 26, 760–769 CrossRef CAS.
- J. Y. Yang, Y. L. Song, Y. X. Wang, C. W. Li, X. Jin and M. Shui, Opt. Express, 2009, 17, 7110–7116 CrossRef CAS PubMed.
- J. Dipold, R. J. M. B. Batista, R. D. Fonseca, D. L. Silva, G. L. C. Moura, J. V. dos Anjos, A. M. Simas, L. De Boni and C. R. Mendonca, Chem. Phys. Lett., 2016, 661, 143–150 CrossRef CAS.
- S. Chi, L. Li and Y. Wu, J. Phys. Chem. C, 2016, 120, 13706–13715 CrossRef CAS.
- G. Shi, C. Y. He, Y. B. Li, R. X. Zou, X. R. Zhang, Y. X. Wang, K. Yang, Y. L. Song and C. H. Wang, J. Opt. Soc. Am. B, 2009, 26, 754–761 CrossRef CAS.
Footnote |
| † Electronic supplementary information (ESI) available. See DOI: 10.1039/d1ra01134k |
| This journal is © The Royal Society of Chemistry 2021 |

