 Open Access Article
Catalytic wet peroxide degradation of acrylonitrile wastewater by ordered mesoporous Ag/CeO2: synthesis, performance and kinetics
Guozheng Zhao ,
Hui Liang,
Hongzhu Xu,
Changbo Li
 *,
Qingwei Tan and
Daihang Zhang
School of Environmental & Safety Engineering, Liaoning Petrochemical University, Liaoning, Fushun 113001, China. E-mail: lnpulcb@126.com
First published on 29th April 2021
Abstract
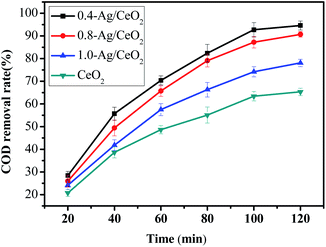
Ordered mesoporous Ag/CeO2 catalysts have been successfully synthesized by a microwave assisted soft template method. The morphology, structure and chemical composition of the catalyst were characterized by XRD, N2 adsorption–desorption, SEM, EDS, TEM and XPS. The study of catalytic performance and reaction kinetics of organic matter degradation in acrylonitrile wastewater was performed in a catalytic wet peroxide (CWPO) system. The degradation pathways of organic matter in acrylonitrile wastewater were elucidated by temporal evolution of intermediates and final products detected by GC/MS analysis along with a continuous flow experiment study. The results show that the Ag/CeO2 has an ordered mesoporous structure, the specific surface area is 91.4–118.2 m2 g−1 and the average pore size is 12.63–16.86 nm. 0.4-Ag/CeO2 showed the best catalytic performance, the COD removal rate reached 94.6%, which was 30% higher than that of CeO2. The degradation is in accordance with the second-order reaction kinetics of the Arrhenius empirical model and Langmuir–Hinshelwood kinetic model. However the latter fits better, and the linear correlation coefficient R2 is more than 0.98, which describes the adsorption catalytic mechanism of Ag/CeO2. According to the analysis by GC/MS, the organic compounds in acrylonitrile wastewater oxidized into intermediate compounds and other small compounds, then are further oxidized into carbon dioxide and water. The catalytic activity of Ag/CeO2 was the result of the combination of Lewis acid–base position of CeO2 and redox cycle of Ce3+/Ce4+.
Introduction
Acrylonitrile is an important chemical raw material, and its production wastewater is toxic and harmful due to high organic compound concentrations such as those of acrylonitrile, acetonitrile and N-heterocyclic compounds.1,2 At present, the treatment methods of acrylonitrile wastewater include biological methods, distillation methods, incineration methods and catalytic oxidation methods, etc3–5. The effluent COD after biological treatment is very high due to the low biodegradability of the –CN group. The distillation method has a poor effect on the separation of components with similar boiling points. The cost of incineration is high and the equipment is corroded seriously. The catalytic oxidation method has low catalytic efficiency and serious dissolution of metal ions. Catalytic wet peroxide (CWPO) which uses H2O2 as an oxidant, can effectively degrade organic matter at ambient temperature.6 The design and development of catalysts become the key to improve the removal of pollutants.Due to the unique valence electron configuration, CeO2 is reduced from Ce4+ to Ce3+, resulting in the formation of oxygen vacancies on the surface of CeO2, which promote the number of active centers. The ability of store and release oxygen improves the catalytic activity of CeO2.7–9 The redox cycle between Ce3+ and Ce4+ is similar to that of Fe2+/Fe3+ in Fenton catalytic oxidation.10–12 In addition to redox, CeO2 also has unique acid–base properties. CeO2 is a metal oxide with Lewis acid and base sites, which is a typical acid–base catalyst.13 In the past two decades, many nanocomposites containing CeO2 have been prepared, it can be divided into the following categories, metal/CeO2, metal oxide/CeO2, CeO2/support, such as Co/CeO2,14 Ni/CeO2,15 AuCu/CeO2,16 MnO2/CeO2,17 CuO/CeO2,18 CeO2/SiO2,19 CeO2/g-C3N4,20 CeO2/Al2O3,21 Ni–La2O3–CeO2/SBA-15,22 Ni–CeO2/graphene,23 and so on. Metal or metal oxide supported on CeO2 carrier by impregnation method, or doped in the lattice of CeO2 in the form of metal cation to form metal–Ce solid solution, which can improve the catalytic performance of the catalyst.24–26 Compared with platinum, palladium, gold and other precious metals, silver is stable and relatively cheaper, which makes silver more practical in industrial applications.25,27 In particular, silver nanoparticles have been proved to be promising catalysts, and many excellent catalysts based on silver nanoparticles have been reported, such as Ag/TiO2,28,29 Ag/SBA-15,30,31 Ag/Al2O3,32,33 Ag/g-C3N4 (ref. 34 and 35) and so on. Also some scholars have successfully synthesized Ag/CeO2 catalysts.36–38 Most of them were prepared by hydrothermal or coprecipitation methods, and the Ag/CeO2 prepared was used for catalytic degradation of p-nitrophenol,36 naphthalene,39 formaldehyde,40 propene,41 etc. Therefore, it is necessary to further study the application potential of Ag/CeO2 in catalytic degradation of organic compounds.42
In this study, we report a soft template method assisted by microwave for preparing of ordered mesoporous Ag/CeO2 catalyst by a combination of the block copolymer and the redox reaction between Ag+ and Ce3+. And its catalytic performance in CWPO system, reaction kinetics and degradation mechanism of organic compounds in acrylonitrile wastewater were systematically studied.
Materials and methods
Materials
All reagents used were of analytical grade without further purification as follows: triblock copolymer F127 (EO106PO70EO106, Mav = 12![[thin space (1/6-em)]](https://www.rsc.org/images/entities/char_2009.gif) 600, Sigma-Aldrich); cerium nitrate (Ce(NO3)3·6H2O, Aladdin), hydrogen peroxide solution (H2O2, 30 wt%, Sinopharm Chemical Reagent Co., Ltd), silver nitrate (AgNO3, Sinopharm Chemical Reagent Co., Ltd), sodium hydroxide (NaOH, Sinopharm Chemical ReagentCo., Ltd). Test wastewater sample was taken from a acrylonitrile chemical plant in Fushun, the initial COD value was 1500 mg L−1. The concentration of organic matter in wastewater was expressed by COD index.
600, Sigma-Aldrich); cerium nitrate (Ce(NO3)3·6H2O, Aladdin), hydrogen peroxide solution (H2O2, 30 wt%, Sinopharm Chemical Reagent Co., Ltd), silver nitrate (AgNO3, Sinopharm Chemical Reagent Co., Ltd), sodium hydroxide (NaOH, Sinopharm Chemical ReagentCo., Ltd). Test wastewater sample was taken from a acrylonitrile chemical plant in Fushun, the initial COD value was 1500 mg L−1. The concentration of organic matter in wastewater was expressed by COD index.
Catalysts preparation
5 mmol Ce (NO3)3·6H2O and 2 mmol AgNO3 were added into a mixture of 20 mL ethanol and 2 g F127, the pH value was adjusted to 10 by NaOH solution, the mixture was stirred for 60 min at room temperature, then the mixture was reacted in a microwave reactor at 100 °C for 60 min, the gel was dried in oven at 120 °C for 10 hours, then calcined in muffle furnace at 550 °C for 5 h and finally mesoporous Ag/CeO2 was obtained. During different AgNO3 dosage, the molar ratio of Ag to Ce is 0.4![[thin space (1/6-em)]](https://www.rsc.org/images/entities/char_2009.gif) :
:![[thin space (1/6-em)]](https://www.rsc.org/images/entities/char_2009.gif) 1, 0.8
1, 0.8![[thin space (1/6-em)]](https://www.rsc.org/images/entities/char_2009.gif) :
:![[thin space (1/6-em)]](https://www.rsc.org/images/entities/char_2009.gif) 1 and 1.0
1 and 1.0![[thin space (1/6-em)]](https://www.rsc.org/images/entities/char_2009.gif) :
:![[thin space (1/6-em)]](https://www.rsc.org/images/entities/char_2009.gif) 1, respectively, which recorded as 0.4-Ag/CeO2, 0.8-Ag/CeO2, 1.0-Ag/CeO2.
1, respectively, which recorded as 0.4-Ag/CeO2, 0.8-Ag/CeO2, 1.0-Ag/CeO2.
In the same way, 5 mmol Ce (NO3)3·6H2O was added into the mixed solution of ethanol and F127, the mesoporous CeO2 was obtained.
Characterization
The D8 advance X-ray diffractometer of Brooke spectroscopic instrument company, Germany, using a radiation source Cu (Kα = 1.54178 nm, 40 kV and 15 mA) with a scanning rate of 10 (°) min−1, continuous scanning mode, wide-angle scanning range is 5–90° and small-angle scanning range is 0.5–8.0°. Autosorb-IQ2-MP automatic physical static analyzer of Cantor instrument company, the liquid nitrogen temperature is 77 K. SU8010 field emission scanning electron microscope of Hitachi company, Japan, with accelerating voltage of 15 kV and working distance of WD = 4 mm. JEM-2100F high resolution transmission electron microscope of Japan Electronics Co., Ltd., accelerating voltage 200 kV. ESCALAB 250Xi photoelectron spectrometer of Thermo Scientific company, USA, uses monochromatic Al target as X-ray source. Agilent 7890a/5975c GC/MS instrument of Agilent Technology Co., Ltd. of the United States, the carrier gas is high-purity nitrogen, HP-5MS column.Catalytic wet peroxidation experiments
Results and discussion
X-ray difraction analysis
The phase and crystal structure of the catalyst was investigated by the X-ray diffraction (XRD). The typical XRD patterns of pure CeO2 and Ag/CeO2 catalysts is shown in Fig. 1a, the peaks located at angles (2θ) of 28.6°, 33.2°, 47.6°, 56.6°, 59.4°, 69.8°, 76.9° and 79.3° are corresponding to plane (111), (200), (220) and (311) of CeO2 with face-centered cubic (FCC) structure. While 38.2°, 44.1°, 64.4° and 77.4° are corresponding to plane (111), (200), (220) and (311) of Ag structure. All the peaks in the pattern are indexed for face-centered cubic structure, and the lattice constant calculated from XRD data is closely agreement with Joint Committee of Powder Difraction Data (JCPDS) (card no: 34-0394 and 65-2871).43,44 The small angle diffraction pattern of the samples are shown in Fig. 1b. The sharp peak near 0.5° indicates that the sample has good crystallinity and ordered mesoporous structure. The CeO2 meso-structure avoids a severe breakdown throughout the Ag nanoparticles supporting step.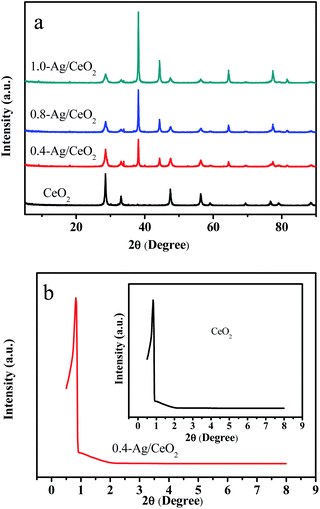 | ||
| Fig. 1 XRD patterns: (a) wide-angle diffraction pattern of CeO2, 0.4-Ag/CeO2, 0.8-Ag/CeO2 and 1.0-Ag/CeO2; (b) small-angle diffraction pattern of CeO2 and 0.4-Ag/CeO2. | ||
N2 adsorption–desorption analysis
The N2 adsorption–desorption isotherms of the prepared samples is shown in Fig. 2. According to the IUPAC classification,45 the isotherms belong to IV isotherms, which are typical cage structure characteristics, indicating that the loaded samples have mesoporous structure. There is an obvious H2 type hysteresis in the range of P/P0 between 0.6 and 0.9, which indicating that Ag was successfully loaded on CeO2 without changing the original mesoporous structure of CeO2. The pore size is calculated by BJH model, specific surface area and pore volume are calculated by BET method. The structural parameters of the samples are listed in Table 1. The noticeable change of the porous structure of such Ag/CeO2 samples as compared to CeO2 may be due to the Ag+–Ce3+ redox reaction during the microwave assisted hydrothermal reaction.38 The comparison of the porous structure of these catalysts allows the conclusion that Ag is predominantly localized in the pores. With the increase of Ag doping, Ag is accumulated and blocked in the pores, which leading to a considerable decrease of both SBET and Vp values. The specific surface area of 0.4-Ag/CeO2 is larger than that of 0.8-Ag/CeO2. Moreover, low Ag loading can reduce the cost of catalyst. In general, Ag/CeO2 synthesized by microwave-assisted synthesis has large specific surface area and relatively large pore size.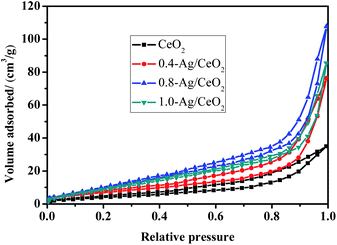 | ||
| Fig. 2 The type IV N2 adsorption–desorption isotherms H2 hysteresis loops for CeO2, 0.4-Ag/CeO2, 0.8-Ag/CeO2 and 1.0-Ag/CeO2. | ||
| Samples | Ag![[thin space (1/6-em)]](https://www.rsc.org/images/entities/char_2009.gif) : :![[thin space (1/6-em)]](https://www.rsc.org/images/entities/char_2009.gif) Ce (molar ratio) Ce (molar ratio) |
Dp (nm) | Vp (cm3 g−1) | SBET (m2 g−1) |
|---|---|---|---|---|
| CeO2 | — | 12.72 | 0.06 | 46.51 |
| 0.4-Ag/CeO2 | 0.4![[thin space (1/6-em)]](https://www.rsc.org/images/entities/char_2009.gif) : :![[thin space (1/6-em)]](https://www.rsc.org/images/entities/char_2009.gif) 1 1 |
16.86 | 0.13 | 118.2 |
| 0.8-Ag/CeO2 | 0.8![[thin space (1/6-em)]](https://www.rsc.org/images/entities/char_2009.gif) : :![[thin space (1/6-em)]](https://www.rsc.org/images/entities/char_2009.gif) 1 1 |
14.19 | 0.18 | 104.2 |
| 1.0-Ag/CeO2 | 1.0![[thin space (1/6-em)]](https://www.rsc.org/images/entities/char_2009.gif) : :![[thin space (1/6-em)]](https://www.rsc.org/images/entities/char_2009.gif) 1 1 |
12.63 | 0.14 | 91.4 |
Microstructural analysis
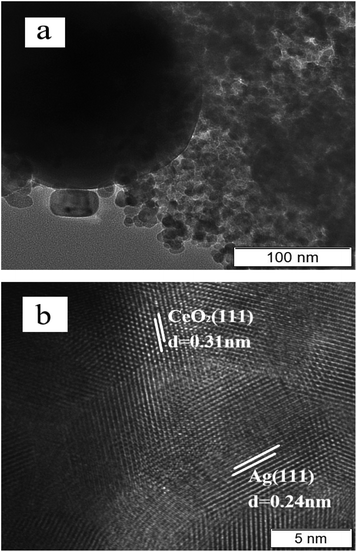
The morphology and element mapping analysis of 0.4-Ag/CeO2 by SEM and EDS are shown in Fig. 3. The Fig. 3a reveals that the mesoporous Ag/CeO2 consists of spheres with diameter of 10–20 nm. The Ag nanoparticles are encapsulated by CeO2 meso-structure and randomly distributed throughout the entire mesoporous CeO2 framework. Fig. 3b–d shows that Ce, O and Ag are uniformly distributed in the samples.The TEM characterization results of 0.4-Ag/CeO2 is shown in Fig. 4. Fig. 4a clearly reveals that the prepared Ag/CeO2 is composed of nanospheres with 10–20 nm, and the dark parts are Ag particles. Many different lattice fringes can be seen from Fig. 4b, the lattice spacing of CeO2 and Ag can be identified. The fringes with d = 0.31 nm matches the CeO2(111) facet, and the fringes with d = 0.24 nm matches the Ag(111) facet. In the channel of mesoporous CeO2, Ag+ precursors are reduced to silver atoms, which nucleate and grow into silver nanostructures. Ag nanoparticles are encapsulated by CeO2 mesoporous structure and distributed in the whole mesoporous CeO2 framework randomly. The mesoscopic structure of CeO2 avoids the destruction of the framework during the doping process of Ag nanoparticles.
XPS spectra analysis
The XPS analysis results are shown in Fig. 5. As shown in Fig. 5a, Ce, O and Ag are contained in the 0.4-Ag/CeO2, which is consistent with the scanning results of EDS. From Fig. 5b, the two characteristic peaks of Ag 3d3/2 and Ag 3d5/2 are symmetrically distributed at the binding energies of 374.1 eV and 368.3 eV, respectively.46,47 This is due to the shift of the peak caused by the charge transfer of Ag, which proves that the formation of metallic Ag NPs (Ag0). From Fig. 5c, the characteristic peaks of Ce4+ 3d3/2 and Ce4+ 3d5/2 appeared at 916.3 eV and 897.8 eV, and the characteristic peaks of Ce3+ 3d3/2 and Ce3+ 3d5/2 appeared at 901.3 eV and 882.6 eV, respectively.48 Since the oxygen defect structure of cerium compounds is dynamic and may change spontaneously with changes in physical parameters such as oxygen partial pressure, temperature and the presence of other ions, it is reasonable that Ce3+ and Ce4+ exist in Ag/CeO2 at the same time.49,50 Fig. 5d shows the O1s spectrum of the sample with a wide spectrum. The characteristic O1s peaks caused by Ce–O bond and H–O bond are located at 529.6 eV and 531.9 eV, respectively. The binding energy of 529.6 eV is lattice oxygen O2− – Ce4+ in Ag/CeO2 sample. With the reduction of CeO2, the binding energy of lattice oxygen moves to higher position. The binding energy of 531.9 eV is caused by the adsorption of H2O. The interaction between Ag and CeO2 is that Ag species contribute valence electrons to CeO2 as electron donors, and CeO2 is reduced by electron acceptor, and oxygen on CeO2 surface will also reverse flow to Ag nanoparticles. Ag doping increases the oxygen defects in CeO2 lattice and increases the concentration of adsorbed oxygen on the surface.51 The oxygen defect of CeO2 can stabilize the oxidation state of Ag species and improve the redox ability of Ag/CeO2.Catalytic wet peroxide performance
0.4-Ag/CeO2, 0.8-Ag/CeO2, 1.0-Ag/CeO2 and CeO2 were selected as catalyst to compare their catalytic performance. The dosage of catalyst was 0.25 g, acrylonitrile wastewater was diluted to COD concentration of 500 mg L−1, pH value was 6, H2O2 (30 wt%) dosage was 8 mL, reaction temperature was 100 °C, reaction time was 20, 40, 60, 80, 100 and 120 min respectively. The COD removal rate is shown in Fig. 6.It can be seen from Fig. 6 that CeO2 based catalysts exhibit good catalytic performance, among which 0.4-Ag/CeO2 has the best performance. The COD removal rate reaches 94.6%, which is about 30% higher than that of CeO2 alone. With the increase of Ag doping, the COD removal rate decreases. This is because too much Ag will lead to the reduction of Ag/CeO2 particle size and the formation of aggregates. The aggregates are heavy and dense, which leads to the reduction of active sites on catalyst surface. This is consistent with the N2 adsorption–desorption characterization results.
The circulation of Ce3+/Ce4+ in CeO2/H2O2 system promotes H2O2 to decompostion of ˙OH and O2− active species to degrade organic compounds.52,53 The doping of noble metal Ag makes Ag ions enter the lattice of CeO2 and replace the original cerium atom, resulting in new oxygen vacancies or local lattice distortion.54 These effects will cause the transformation of crystal form, which is consistent with the results of XPS analysis. The oxygen vacancy and Ce4+ reduction center can be used as the active sites of the reaction, and the increase of oxygen vacancy improves the catalytic activity of the catalyst.
Catalyst reusability study
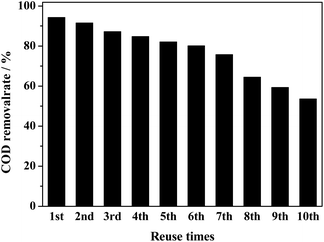
It is very necessary to evalutate the activity and stability of the catalyst for practical application. The reusability of the catalyst was studied under optimized operating conditions (i.e., dosage of 0.4-Ag/CeO2 was 0.25 g, pH = 6, H2O2 (30 wt%) dosage was 8 mL, temperature was 100 °C, reaction time 120 min and acrylonitrile wastewater was diluted to COD concentration of 500 mg L−1). The results are shown in Fig. 7. In the first cycle, maximum removal of COD was reached 94.3%. Herein, after each cycle used catalyst was separated by centrifugation and then washed with deionized water subsequently, catalyst was dried at 120 °C for 6 h, and then the catalyst was calcined in muffle furnace for 2 h in order to remove the adsorbed refractory organic matter. The obtained catalyst was further reused in the next experiment. So as compared with 1st cycle removal efficiency of COD dropped gradually, i.e.,91.5%, 87.2%, 84.8%, 82.3% and 80.1% in 2nd to 6th cycle, respectively. Then, the removal rate dropped further, only 53.6% for the tenth time. Kumar A's team reported perovskite-like catalyst La0.5Ce0.5FeO3 synthesized by sol–gel method and peroxide acrylonitrile from aqueous solution showed the acrylonitrile removal efficiency gradually dropped from 90.11% to 69.92% during four cycles.55 The drop of COD removal efficiency in each cycle could be attributed to various reasons: such as leaching of active metal ions (Ag or Ce) from the catalyst surface leads to suppress the active sites,36 carbon deposition on the catalyst surface that causes inhibited ˙OH radicals production46 and the collapse of mesoporous structure reduces the active sites.24Reaction kinetics
Due to the complex composition of acrylonitrile wastewater and a variety of intermediate products during the degradation process, it is impossible to analyze the degradation kinetics of each organic matter separately. Therefore, the degradation kinetics of organic matter was studied by the monitoring the change of COD concentration of acrylonitrile wastewater. The Arrhenius empirical model and Langmuir–Hinshelwood model were used to analyze the degradation process of organic compounds.Arrhenius empirical model
According to the relevant literature,56 Arrhenius empirical model was adopt, which was assumed that the degradation process of acrylonitrile wastewater by 0.4-Ag/CeO2 conforms to the second-order kinetic equation, then the reaction rate equation is as follow (1):
 | (1) |
The oxidation process is only controlled by the concentration of reactants and reaction temperature. It is assumed that the oxidant H2O2 is excessive and can be approximately regarded as a constant. Then eqn (1) can be simplified as follow (2):
 | (2) |
For a continuous reactor, the two sides of the equation can be integrated between t1 = 0, t2 = t, then eqn (3) obtained.
 | (3) |
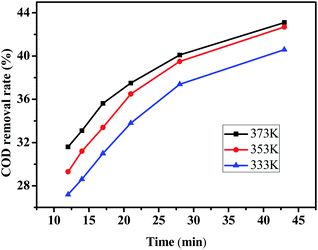
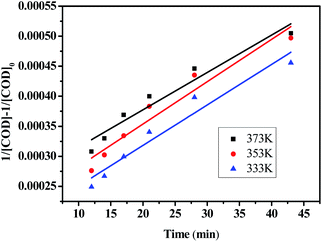
The relationship between COD removal rate and reaction time is shown in Fig. 8, Which the experimental were taken at 333, 353 and 373 K, pH = 6, H2O2 dosage was 30 mL L−1. According to the test data, plot T with (1/[COD] − 1/[COD]0), and the results are shown in Fig. 9. The reaction time was controlled by adjusting the wastewater flow rate, when the flow rate of 10, 15, 20, 25, 30 and 35 mL min−1 corresponding to the reaction time of 43, 26, 21, 17, 14 and 12 min respectively.
The relevant parameters after linear fitting at different temperatures are shown in Table 2.
| Model | Temperature/K | R2 | Linear equation |
|---|---|---|---|
| Arrhenius empirical model | 373 | 0.9326 | y = 7.221 × 10⁻⁶x − 2.530 × 10⁻⁴ |
| 353 | 0.9279 | y = 7.053 × 10⁻⁶x − 2.127 × 10⁻⁴ | |
| 333 | 0.938 | y = 6.745 × 10⁻⁶x − 1.832 × 10⁻⁴ | |
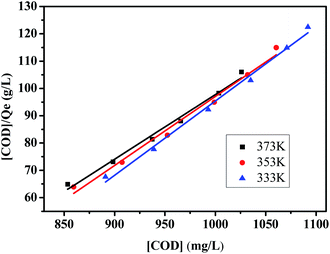
| Langmuir–Hinshelwood model | 373 | 0.9859 | y = 0.2367x − 138.96 |
| 353 | 0.9861 | y = 0.2525x − 155.49 | |
| 333 | 0.9921 | y = 0.2719x − 176.57 |
It can be seen from Table 2 that the linear correlation coefficient R2 of the reaction kinetic equation at different temperatures is more than 0.92, which indicates that the process of CWPO degradation of organic matters in acrylonitrile wastewater by mesoporous Ag/CeO2 conforms to the second-order reaction kinetics of empirical model. The reaction rate constants increase with the increase of temperature, which is consistent with the change of COD removal rate under the same conditions.
Langmuir–Hinshelwood model
The reaction kinetics analysis was also carried out through Langmuir–Hinshelwood mechanism of heterogeneous catalytic oxidation, which assumes that the reaction between organic matter and hydrogen peroxide is initiated on the surface of catalyst.3 Many researchers have performed Langmuir–Hinshelwood, Freundlich and Temkin isotherms for heterogeneous catalytic oxidation.57–61According to the Langmuir–Hinshelwood mechanism, the heterogeneous catalytic reaction process can be divided into three steps: first, organics and H2O2 molecules are adsorbed on the surface of the catalyst; second, the reaction between reactants to form products; third, the product desorbed from the catalyst surface.62 Based on the Langmuir–Hinshelwood reaction kinetic model, it is assumed that the organic matter in acrylonitrile wastewater reacted with H2O2 on the surface of the catalyst.
As shown in formula (4), the rate R of heterogeneous catalytic reaction is directly proportional to the surface fraction covered by organic matter and H2O2 molecule in acrylonitrile wastewater.
 | (4) |
The competitive and noncompetitive adsorption rates of organics in acrylonitrile wastewater and H2O2 on the catalyst surface can be expressed as formula (5).
 | (5) |
In heterogeneous catalytic reactions, adsorption and desorption occur faster at equilibrium. Therefore, the concentration of product formation [P] in formula (5) is ignored, and the above equation is simplified to obtain formula (6):
 | (6) |
Because of the H2O2 is excessive, it can be considered as a constant. Eqn (6) can be simplified by arranging the constant terms together to obtain eqn (7).
 | (7) |
For the non competitive adsorption process of organics and H2O2, the expression of reaction rate can be written as formula (8).
 | (8) |
For a constant concentration of H2O2, expression (8) can be written as a linear Langmuir isotherm as formula (9).
 | (9) |
 | (10) |
The Langmuir equilibrium constant KACN is derived from the curves of [COD]/Qe and [COD] at 333 K, 353 K and 373 K, as shown in Fig. 10. The isotherm constants and R2 values are listed in Table 2. It can be seen from Table 2 that the linear correlation coefficient R2 is above 0.98. By comparing the linear correlation coefficient R2 between Langmuir–Hinshelwood model and Arrhenius model, it is concluded that Langmuir–Hinshelwood model is more consistent with the CWPO reaction process. In the Ag/CeO2/H2O2 system, Ce3+ reacts with H2O2 to produce ˙OH and peroxide species, which degrade the organic compounds adsorbed on the surface of CeO2.
Degradation pathway and mechanism
Under the premise of catalyst adsorption equilibrium, the water samples with reaction time of 0 (raw water), 17, 21, 28 and 43 min weretaken for GC/MS determination respectively. The cluster analysis of the determination results is shown in Table 3.| Reaction time/min | Organics | Nitriles | Phenols | N-containing heterocycles | Amino compounds | Alcohol ketone ethers | Alkanes | Organic acids and esters | Sulfur compounds |
|---|---|---|---|---|---|---|---|---|---|
| 0 | Number | 13 | 3 | 6 | 4 | 2 | 5 | 4 | 3 |
| Content/% | 47.57 | 33.01 | 4.51 | 5.04 | 1.33 | 0.9 | 0.57 | 7.07 | |
| 17 | Number | 12 | 2 | 3 | 2 | 4 | 10 | 1 | 0 |
| Content/% | 41.52 | 40.83 | 4.97 | 0.84 | 4.71 | 6.9 | 0.24 | 0 | |
| 21 | Number | 7 | 4 | 2 | 3 | 1 | 6 | 3 | 0 |
| Content/% | 23.76 | 15.80 | 4.48 | 10.64 | 8.37 | 26.96 | 9.98 | 0 | |
| 28 | Number | 9 | 1 | 8 | 3 | 0 | 8 | 3 | 0 |
| Content/% | 22.29 | 1.51 | 28.01 | 13.19 | 0 | 27.01 | 7.97 | 0 | |
| 43 | Number | 4 | 2 | 4 | 4 | 2 | 6 | 6 | 0 |
| Content/% | 6.23 | 1.90 | 7.51 | 19.91 | 1.12 | 35.26 | 28.07 | 0 |
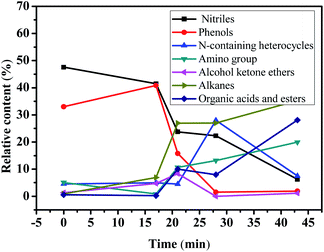
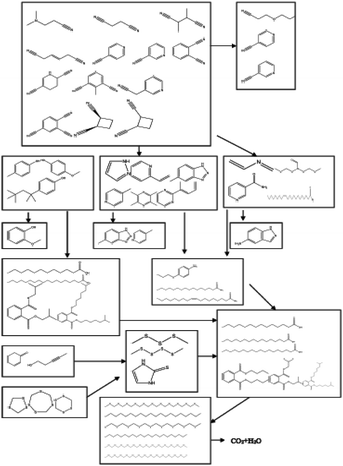
According to the GC/MS analysis results, 40 kinds of organic matter were detected, the main organic compounds in acrylonitrile wastewater are nitriles, such as 3-cyanopyridine, cis-1,2-dicyanitrile cyclobutane and succinonitrile; phenolic compounds, such as 4-methylphenol, 4-methoxyphenol, 4-(1,1,3,3-tetramethylbutyl) phenol, etc. Nitriles and phenols accounted for about 80% of the organic matter content in the raw wastewater. According to the changes of the number and content of various kinds of organic matter in Table 3, the degradation trend diagram of organic matter is shown in Fig. 11 and transformation paths of various organic matter is shown in Fig. 12.
According to Fig. 11, the content of nitriles and phenolic compounds decreased significantly, the degradation rate of nitrile compounds is 86.9%, and the degradation rate of phenolic compounds is 94.2%. The results show that Ag/CeO2 catalyst can effectively degrade nitriles and phenols in CWPO system. The degradation trends of amino compounds, alkanes, organic acids and esters are generally opposite to that of nitriles and phenols. It is possible that phenol may be converted to alkanes and organic esters, while nitrile may be converted to amino compounds during CWPO degradation. Combined with the data in Table 3, it can be seen that after 43 minutes of reaction, the content of alkanes gradually increased to 39 times of raw water, and the content of organic acids and esters reached 49 times of raw water. The content of N-containing heterocycles increased sharply at 28 min, while the content of nitriles is very low at this time, indicating that N-containing heterocycles are transformed from nitriles. The low content of alcohols, ketones and ethers may be due to the fact that they are converted from phenols and then oxidized to acids by ˙OH. A small amount of sulfur compounds in raw water were oxidized to thioether. It can be inferred that, under the catalysis of Ag/CeO2, the organic matter undergoes a chemical reaction in the CWPO system.63 These organic compounds oxidized into intermediate compounds and other small compounds, then these intermediate compounds get further oxidized into carbon dioxide and water, which is consistent with the conclusion of Kumar A's study.55
The Ag/CeO2 exhibits strong catalytic activity, which is due to the activation of electrophilic and nucleophilic by Lewis acid center (Ce4+) and acid–base pair (Ce–O), respectively. However, 3-cyanopyridine and 4-cyanopyridine did not transform during the degradation and transformation of nitriles, indicating that Ag/CeO2 has no activity against these two compounds. The above analysis shows that Ag/CeO2 catalyst not only promotes H2O2 to produce more ˙OH, but also promotes the chemical conversion between organic compounds in acrylonitrile wastewater. The catalytic activity of Ag/CeO2 is the result of weak Lewis acid, strong basicity and unique redox properties of CeO2.
Conclusions
In summary, the ordered mesoporous Ag/CeO2 with specific surface area of 91.4–118.2 m2 g−1 and pore diameter of 12.63–16.86 nm was successfully prepared by microwave-assisted soft template method. The CWPO degradation test was carried out with 0.4-Ag/CeO2 as the catalyst, and the COD removal rate reached 94.6%. Ag doping improved the catalytic activity of CeO2 and achieved good stability. The degradation process of organic matter with Ag/CeO2 as catalyst conformed to the Langmuir–Hinshelwood kinetic model, which describes the adsorption catalytic mechanism of Ag/CeO2 in detail. The catalytic activity of Ag/CeO2 is the result of the interaction of weak Lewis acid, strong alkalinity and unique redox properties of CeO2, which provides theoretical basis for the application of CeO2 based catalyst in CWPO system of other complex organic industrial wastewater.Conflicts of interest
The authors declare that they have no conflict of interest.Acknowledgements
The project was supported by China National Key Project of Science and Technology “Water Pollution Control and Governance” (2012ZX07202-002); Science and Technology research project of Liaoning Provincial Department of Education (L2020020).References
- A. Kumar, B. Prasad and K. K. Garg, Process Saf. Environ. Prot., 2021, 147, 162–180 CrossRef CAS.
- A. Kumar, B. Prasad, V. K. Sandhwar and K. K. Garg, J. Environ. Chem. Eng., 2021, 9(3), 105177 CrossRef CAS.
- A. Kumar and B. Prasad, Int. J. Environ. Sci. Technol., 2020, 17(3), 1809–1824 CrossRef CAS.
- P. C. Zhang, Z. L. Xu, W. Xia and M. Y. Lu, Saf. Health Environ., 2010, 2, 24–27 Search PubMed.
- C. Y. Chang, S. H. Chen, J. S. Chang and C. C. Wang, Water Sci. Technol., 2000, 41(10–11), 143–148 CrossRef CAS.
- R. S. Ribeiro, A. M. T. Silva, J. L. Figueiredo, J. L. Faria and H. T. Gomes, Appl. Catal., B, 2016, 187, 428–460 CrossRef CAS.
- A. D. Liyanage, S. D. Perera, K. Tan, Y. Chabal and K. J. Balkus, ACS Catal., 2014, 4(2), 577–584 CrossRef CAS.
- K. M. Dunnick, R. Pillai, K. L. Pisane, A. B. Stefaniak, E. M. Sabolsky and S. S. Leonard, Biol. Trace Elem. Res., 2015, 166(1), 96–107 CrossRef CAS PubMed.
- Y. J. Acosta-Silva, M. Toledano-Ayala, G. Torres-Delgado and I. Torres-Pacheco, J. Nanomater., 2019, 1–8 Search PubMed.
- C. J. Zang, X. S. Zhang, S. Y. Hu and F. Chen, Appl. Catal., B, 2017, 216, 106–113 CrossRef CAS.
- X. X. Hu, R. Li, S. Y. Zhao and Y. J. Xing, Appl. Surf. Sci., 2017, 396(28), 1393–1402 CrossRef CAS.
- H. P. Li, R. Q. Cheng, Z. L. Liu and C. F. Du, Sci. Total Environ., 2019, 683(15), 638–647 CrossRef CAS PubMed.
- X. N. Ren, Z. X. Zhang, Y. H. Wang, J. M. Lu, J. H. An and J. Zhang, et al., RSC Adv., 2019, 27(9), 15229–15237 RSC.
- M. Greluk, W. Gac, M. Rotko, G. Sowik and S. Turczyniak-Surdackab, J. Catal., 2020, 393, 159–178 CrossRef.
- N. Rui, X. S. Zhang, F. Zhang, Z. Y. Liu, X. X. Cao and Z. H. Xie, et al., Appl. Catal., 2020, 282, 119581 CrossRef.
- R. Palacio, D. López and D. Hernández, J. Nanopart. Res., 2019, 21(7), 1–13 CrossRef CAS.
- N. J. Feng, Z. J. Zhu, P. Zhao, L. Wang, H. Wan and G. F. Guan, Appl. Surf. Sci., 2020, 515, 146013 CrossRef CAS.
- Y. Q. Zeng, K. Haw, Z. G. Wang, Y. N. Wang, S. L. Zhang and P. Hongmanorom, et al., J. Hazard. Mater., 2020, 404, 124088 CrossRef PubMed.
- E. J. S. Christy, A. Rajeswari, M. Dhanu and A. Pius, Environ. Nanotechnol. Monit. Manage., 2020, 14, 100365 Search PubMed.
- D. Barathi, N. Rajalakshmi, R. Ranjith, R. Sangeetha and S. Meyveld, Diamond Relat. Mater., 2020, 111, 108161 CrossRef.
- X. Y. Yang, X. X. Lei and S. K. Tang, Ceram. Int., 2020, 47(4), 5446–5455 CrossRef.
- S. Moogi, I. Lee and K. Hwang, Int. J. Hydrogen Energy, 2020, 45(53), 28462–28475 CrossRef CAS.
- Q. L. Yao, Z. H. Lu, Y. W. Yang, Y. Z. Chen, X. S. Chen and H. L. Jiang, Nano Res., 2018, 11(8), 4412–4422 CrossRef CAS.
- C. W. Sun, H. Li and L. Q. Chen, Energy Environ. Sci., 2012, 5(44), 8475–8505 RSC.
- A. D. Verma, N. Jain, S. K. Singha, M. A. Quraishi and I. Sinha, J. Chem. Sci., 2016, 128(12), 1871–1878 CrossRef CAS.
- J. Akil, S. Siffert, L. Pirault-Roy, S. Royer, F. J. Shen and W. D. Chen, et al., Environ. Sci. Pollut. Res. Int., 2020, 10(2), 1–12 Search PubMed.
- L. Zeng, L. Cui, C. Y. Wang, W. Guo and C. Gong, Front. Mater. Sci. Chin., 2019, 13(2), 288–295 CrossRef.
- W. J. Zhao, Z. C. Zhang, J. Zhang, H. G. Wu, L. M. Xi and C. H. Ruan, Mater. Lett., 2016, 171, 182–186 CrossRef CAS.
- M. Hosseini-Sarvari and Z. Hosseinpour, Res. Chem. Intermed., 2019, 45(4), 1829–1840 CrossRef CAS.
- H. Guerba, B. Djellouli, C. Petit and V. Pitchon, C. R. Chim., 2014, 17(7–8), 775–784 CrossRef CAS.
- Y. Qin, Z. P. Qu, C. Dong and N. Huang, Chin. J. Catal., 2017, 38(9), 1603–1612 CrossRef CAS.
- M. Nasrollahzadeh, Z. Issaabadi and S. M Sajadi, J. Mater. Sci.: Mater. Electron., 2019, 30(4), 3847–3859 CrossRef CAS.
- P. M. More, J. Environ. Manage., 2017, 188(3), 43–48 CrossRef CAS PubMed.
- B. Tahir, M. Tahir and S. A. Nor Aishah, Appl. Surf. Sci., 2019, 493, 18–31 CrossRef CAS.
- J. B. Xue, T. Ma, Q. Q. Shen, R. F. Guan, H. S. Jia and X. G. Liu, et al., J. Mater. Sci.: Mater. Electron., 2019, 30(410), 15636–15645 CrossRef CAS.
- Z. Y. Ji, X. P. Shen, J. L. Yang, G. X. Zhu and K. M. Chen, Appl. Catal., B, 2014, 144, 454–461 CrossRef CAS.
- M. V. Grabchenko, N. N. Mikheeva, G. V. Mamontov, M. A. Salaev, L. F. Liotta and O. V. Vodyankina, Catalysts, 2018, 8(7), 285–326 CrossRef.
- M. Chernykh, N. Mikheeva, V. Zaikovskii, M. Salaev, L. F. Liotta and G. Mamontov, Catalysts, 2020, 10(5), 580–592 CrossRef CAS.
- M. H. Liu, X. D. Wu, S. Liu, Y. X. Gao, Z. Chen and Y. Ma, et al., Appl. Catal., B, 2017, 219, 231–240 CrossRef CAS.
- L. Ma, D. S. Wang, J. H. Li, B. Y. Bai, L. X. Fu and Y. D. Li, Appl. Catal., B, 2014, 148–149, 36–43 CAS.
- M. Skaf, S. Aouad, S. Hany, R. Cousin, E. Abi-Aad and A. Aboukais, J. Catal., 2014, 320, 137–146 CrossRef CAS.
- L. J. Niu, T. Wei, Q. G. Li, G. M. Zhang, G. Xian and Z. Q. Long, et al., J. Environ. Sci., 2020, 96(10), 109–116 CrossRef PubMed.
- B. Matovic, S. Butulija, Z. Dohcevic-Mitrovic, T. M. Arsic, J. Lukovic and S. Boskovic, et al., J. Eur. Ceram. Soc., 2020, 40(5), 1983–1988 CrossRef CAS.
- M. M. Khan, S. A. Ansari, D. Pradhan, D. H. Han, J. Lee and M. H. Cho, Ind. Eng. Chem. Res., 2014, 53, 9754–9763 CrossRef CAS.
- K. Sing, D. Everett, R. Haul, L. Moscou, R. Pierotti and J. Rouquerol, et al., Pure Appl. Chem., 1985, 57(4), 603–619 CAS.
- T. Montini, M. Melchionna, M. Monai and P. Fornasiero, Chem. Rev., 2016, 116(10), 5987–6041 CrossRef CAS PubMed.
- S. Issarapanacheewin, K. Wetchakun, S. Phanichphant, W. Kangwansupamonkon and N. Wetchakun, Mater. Lett., 2015, 156, 28–31 CrossRef CAS.
- H. H. Ji, L. Lyu, L. L. Zhang, X. Q. An and C. Hu, Appl. Catal., B, 2016, 199, 230–240 CrossRef CAS.
- Y. Shi, X. L. Zhang, Y. M. Zhu, H. L. Tan, X. S. Chen and Z. H. Lu, RSC Adv., 2016, 6, 47966–47973 RSC.
- Q. L. Yao, Y. Shi, X. L. Zhang, X. S. Chen and Z. H. Lu, Chem.–Asian J., 2016, 11(22), 3251–3257 CrossRef CAS PubMed.
- M. Chernykh, N. Mikheeva, V. Zaikovskii, M. Salaev, L. F. Liotta and G. Mamontov, Catalysts, 2020, 10(5), 580–591 CrossRef CAS.
- H. J. H. Fenton, J. Chem. Soc., Trans., 1894, 65, 899–910 RSC.
- E. G. Heckert, S. Seal and W. T. Self, Environ. Sci. Technol., 2008, 42(13), 5014–5019 CrossRef CAS PubMed.
- S. J. Wu, Y. Yang, C. X. Lu, Y. Y. Ma, S. X. Yuan and G. R. Qian, Eur. J. Inorg. Chem., 2018, 25(6), 2944–2951 CrossRef.
- A. Kumar, B. Prasad and K. K. Garg, J. Water Process Eng., 2020, 36, 101314 CrossRef.
- M. A. Prieto, J. A. Vázquez and M. A. Murado, Biotechnol. Prog., 2012, 28(2), 372–381 CrossRef CAS PubMed.
- M. Saeed, M. Ilyas, M. Siddique and A. Ahmad, Arabian J. Sci. Eng., 2013, 38, 1739–1748 CrossRef CAS.
- M. Saeed and M. Ilyas, Appl. Catal., B, 2013, 129(11), 247–254 CrossRef CAS.
- M. Saeed, S. Adeel, M. Ilyas, M. A. Shahzad, M. Usman and E. . U. Haq, et al., Desalin., Water Treat., 2016, 57(27), 12804–12813 CrossRef CAS.
- M. Ilyas and M. Sadiq, Chem. Eng. Technol., 2007, 30, 1391–1397 CrossRef CAS.
- V. D. Makwana, Y. C. Son, A. R. Howell and S. L. Suib, J. Catal., 2002, 210, 46–52 CrossRef CAS.
- D. Z. Wang, Chin. J. Catal., 2010, 31(8), 972–978 CrossRef CAS.
- M. Tamura, A. Satsuma and K. I. Shimizu, Catal. Sci. Technol., 2013, 3(5), 1386–1393 RSC.
| This journal is © The Royal Society of Chemistry 2021 |


