 Open Access Article
Investigation on the promotional role of Ga2O3 on the CuO–ZnO/HZSM-5 catalyst for CO2 hydrogenation†
Jie Du,
Yajing Zhang *,
Kangjun Wang*,
Fu Ding,
Songyan Jia
 ,
Guoguo Liu and
Limei Tan
College of Chemical Engineering, Shenyang University of Chemical Technology, Shenyang 110142, PR China. E-mail: yjzhang2009@163.com; angle_79@163.com; Tel: +86-24-89383902
First published on 16th April 2021
Abstract
Dimethyl ether (DME) can be directly synthesized from carbon dioxide and hydrogen by mixing methanol synthesis catalysts and methanol dehydration catalysts. The activity and selectivity of the catalyst can be greatly affected by the promoter; herein, we presented a series of CuO–ZnO–Ga2O3/HZSM-5 hybrid catalysts, which were prepared by the coprecipitation method. The effect of the Ga2O3 content on the structure and performance of the Ga-promoted Cu–ZnO/HZSM-5 based catalysts was thoroughly investigated. The results showed that the addition of Ga2O3 significantly increased specific surface areas and Cu areas, decreased the size of Cu particles, maintained the proportion of Cu+/Cu0 on the surface of the catalyst, and strengthened the metal–support interaction, resulting in high catalytic performance.
1. Introduction
Recently, human beings mainly have two concerns, global warming and energy shortage.1 CO2 is one of the main greenhouse gases and is considered the main contributor to global warming.2 The hydrogenation of CO2 to other chemicals (hydrocarbons, methanol, and dimethyl ether (DME)) can effectively solve these problems. Particular attention has been paid to the synthesis of DME. DME may be used as an alternative fuel and is widely used as feedstock for the production of aerosols, refrigerants, foaming agents, etc.3,4One-step CO2 hydrogenation to dimethyl ether combines two successive steps of methanol synthesis and methanol dehydration over a hybrid catalyst in a single reactor. The catalyst is composed of a methanol synthesis component5 and methanol dehydration component together;6 in some cases, the catalyst is also called a bifunctional/hybrid catalyst.7,8 The Cu–ZnO/HZSM-5 based catalyst has been considered as an optimum combination of the two components, and the active temperature of both components is within the same temperature range.9,10 At present, however, the hydrogenation of CO2 to DME still has a low CO2 conversion and a low selectivity to DME over the catalyst. Various methods were employed to modify its composition and structure, aiming to enhance the performance. For example, optimization methods include modifying methanol dehydration catalysts,11 changing the preparation process of catalysts,12 adopting a core–shell structure13 and mixing with new catalysts.14
Previous studies have shown that appropriate promoters can effectively improve the performance of Cu–ZnO/HZSM-5 with optimized composition. Many studies have been performed on catalysts for the hydrogenation of CO2 to dimethyl ether, with carriers,15 promoters,7,16 etc., aiming to increase the catalytic performance of catalysts.
Ga2O3, as a promoter, has been used by some researchers in CO2 conversion catalysts.17–19 In comparison, research has rarely been reported on dimethyl ether catalysts20,21 and there are fewer researchers who have studied the influence of Ga2O3 content changes on catalysts. In the present work, we found that Ga2O3 can significantly improve the selectivity and yield of dimethyl ether; the effects of Ga2O3 content on the performance and structure of the CuO–ZnO/HZSM-5 catalyst were carefully investigated in direct DME synthesis from a CO2 and H2 mixture.
2. Experimental section
2.1 Catalyst preparation
The catalysts were prepared by the oxalate co-precipitation method, and the mass ratio of the CuO–ZnO–Ga2O3 component to HZSM-5 (Catalyst Plant of Nankai University, SiO2/Al2O3 = 38, molar ratio) was 2![[thin space (1/6-em)]](https://www.rsc.org/images/entities/char_2009.gif) :
:![[thin space (1/6-em)]](https://www.rsc.org/images/entities/char_2009.gif) 1.16 First, a certain amount of analytically pure nitrate precursors Cu(NO3)2, Zn(NO3)2, and Ga(NO3)3 was dissolved into a certain amount of ethanol (denoted as solution A; the total molar concentration is 1 mol L−1); H2C2O4·2H2O (200 wt% of metal nitrate) was also dissolved into ethanol (solution B, 1 mol L−1). Second, parallel solutions A and B were slowly dropped into a beaker containing HZSM-5 ethanol solution and kept under stirring at 60 °C. The suspension was sealed and aged for 2 hours and then the ethanol was evaporated at 80 °C to get a precipitate. Finally, the precipitate was dried at 120 °C for 12 hours and calcined in air at 400 °C for 4 hours. The powder of the CZGxH catalyst was ground, pressed, pulverized and sieved to obtain particles of 20 to 40 mesh before the activity was tested. The Ga2O3 modified CuO–ZnO/HZSM-5 (CuO
1.16 First, a certain amount of analytically pure nitrate precursors Cu(NO3)2, Zn(NO3)2, and Ga(NO3)3 was dissolved into a certain amount of ethanol (denoted as solution A; the total molar concentration is 1 mol L−1); H2C2O4·2H2O (200 wt% of metal nitrate) was also dissolved into ethanol (solution B, 1 mol L−1). Second, parallel solutions A and B were slowly dropped into a beaker containing HZSM-5 ethanol solution and kept under stirring at 60 °C. The suspension was sealed and aged for 2 hours and then the ethanol was evaporated at 80 °C to get a precipitate. Finally, the precipitate was dried at 120 °C for 12 hours and calcined in air at 400 °C for 4 hours. The powder of the CZGxH catalyst was ground, pressed, pulverized and sieved to obtain particles of 20 to 40 mesh before the activity was tested. The Ga2O3 modified CuO–ZnO/HZSM-5 (CuO![[thin space (1/6-em)]](https://www.rsc.org/images/entities/char_2009.gif) :
:![[thin space (1/6-em)]](https://www.rsc.org/images/entities/char_2009.gif) ZnO = 7
ZnO = 7![[thin space (1/6-em)]](https://www.rsc.org/images/entities/char_2009.gif) :
:![[thin space (1/6-em)]](https://www.rsc.org/images/entities/char_2009.gif) 3, mass ratio) catalysts were abbreviated as CZGxH (x stands for theoretical Ga2O3/CZ wt%).
3, mass ratio) catalysts were abbreviated as CZGxH (x stands for theoretical Ga2O3/CZ wt%).
2.2 Catalyst testing
Catalyst testing was carried out in a continuous-flow fixed-bed reactor made of stainless steel (i.d. = 10 mm). First, the catalyst was reduced with 10% H2/N2 at 300 °C for 3 h under atmospheric pressure. Then it was cooled to 50 °C and reactant gas flow was introduced, raising the pressure to 3.0 MPa, and the reaction temperature was 260 °C. The exit line was heated to prevent condensation. The products were analyzed on line with a gas chromatograph (SP-3420) equipped with both a TCD (for CO and CO2, GDX-101 connected with Porapak T column) and a FID (for CH4, CH3OH and CH3OCH3, Porapak Q column). Conversion and selectivity values were calculated by the internal standard and mass conservation method.2.3 Catalyst characterization
XRD measurements were performed on a Rigaku D/max 2500pc X-ray diffractometer with Cu-Kα radiation (l = 1.54156 Å) at a scan rate of 4° min−1 at 50 kV and 250 mA. The crystallite size was calculated using Scherrer's equation. Copper surface areas (SCu) were measured by a nitrous oxide titration method as described elsewhere.22BET surface areas were measured by N2 adsorption at −196 °C using a Quantachrome Autosorb 1-C. Before the absorption–desorption measurements, samples were degassed under vacuum at 300 °C for 3 h. The specific BET (SBET) was estimated from the linear part of the Brunauer–Emmett–Teller (BET) plot.
H2-TPR of catalysts was performed on a chemisorption analyser (ChemBET 3000). Before reduction, 0.02 g of sample was preheated with flowing He at 400 °C for 60 min, and then cooled down to room temperature. Subsequently, the temperature was raised in 10% H2/Ar (50 mL min−1) at a ramp rate of 10 °C min−1 to 400 °C. H2 consumption was detected with a TCD.
NH3-TPD was conducted on a ChemBET 3000. 300 mg catalyst was heated to 400 °C for 30 min, and then cooled to 50 °C; following that 6 vol% NH3/Ar was introduced for adsorption (60 min). Then, the catalyst was flushed with a He stream (30 mL min−1) for 60 min to remove the weakly adsorbed NH3, and finally it was heated from 50 to 800 °C at a rate of 10 °C min−1. The NH3-TPD signal was recorded.
CO2-TPD was also conducted on a ChemBET 3000. 50 mg catalyst was first reduced at 300 °C in a H2 flow of 30 mL min−1 for 1 h, purged with purified Ar, and further treated at 450 °C for 0.5 h in Ar. After cooling to 40 °C, CO2 adsorption was switched to saturation, and then the catalyst was flushed with a He stream (30 mL min−1) for 60 min, and finally it was heated from 50 to 900 °C at a rate of 10 °C min−1. The CO2-TPD signal was recorded.
X-ray photoelectron spectroscopy (XPS) and X-ray-induced Auger electron spectroscopy were performed on an ESCALAB 250Xi spectrometer. The monochromatized Al-Kα beam (1486.8 eV) was used as an X-ray source to confirm the characteristic peaks of Cu 2p, Zn 2p, Ga 2p, and C 1s with a beam resolution of 0.1 eV. The characteristic C–C peak at 284.6 eV assigned to C 1s was further used as a reference peak.
3. Results and discussion
3.1 Catalytic performance of the catalysts
In Table 1, the catalytic performances of the CZGxH catalysts are displayed, along with the behaviour of a Ga2O3-free sample (CZG0H) taken as a reference. In this reaction, DME was the main product, while methanol, CO and trace hydrocarbons (methane, ethane, etc.) were identified as by-products. Apparently, the catalytic performance is significantly improved with the addition of Ga2O3 compared to the Ga2O3-free catalyst under the same reaction conditions. All the Ga2O3-added catalysts exhibited higher CO2 conversion (Fig. S1†) and higher selectivity to DME (Fig. S2†). On the other hand, it is also observed that the CO2 conversion, DME selectivity and DME yield show a trend of increase initially, followed by a decrease with Ga2O3 addition; the attained better catalytic performances were respectively 22.3%, 62.6% and 14.0% over the CZG5H catalyst. By comparing the catalysts in this paper with similar material catalysts with similar ratios in other literature under almost the same test conditions,23 although there is no significant difference between the catalysts with promoters Ga2O3 and ZrO2 in terms of the carbon dioxide conversion, the selectivity to dimethyl ether of the Ga2O3 modified catalyst was significantly higher than that of the ZrO2 modified catalyst, so the yield of dimethyl ether is improved accordingly. The catalytic performance results showed that an appropriate amount of Ga2O3 could effectively convert CO2 into dimethyl ether, but not in excess. In order to evaluate the influence of Ga2O3 on the catalysts, the catalysts were further characterized in the following sections.| Catalyst | SBET (m2 g−1) | Dispersiona (%) | SCua (m2 g−1) | dCua (nm) | CO2 conversionb (%) | Selectivityb (%) | DME yieldb (%) | |||
|---|---|---|---|---|---|---|---|---|---|---|
| CO | C2H4 | MOH | DME | |||||||
a Determined by the nitrous oxide titration method.b Reaction conditions: T = 260 °C, P = 3.0 MPa, weight = 1 g, CO2![[thin space (1/6-em)]](https://www.rsc.org/images/entities/char_2009.gif) : :![[thin space (1/6-em)]](https://www.rsc.org/images/entities/char_2009.gif) H2 H2![[thin space (1/6-em)]](https://www.rsc.org/images/entities/char_2009.gif) : :![[thin space (1/6-em)]](https://www.rsc.org/images/entities/char_2009.gif) N2 = 3 N2 = 3![[thin space (1/6-em)]](https://www.rsc.org/images/entities/char_2009.gif) : :![[thin space (1/6-em)]](https://www.rsc.org/images/entities/char_2009.gif) 9 9![[thin space (1/6-em)]](https://www.rsc.org/images/entities/char_2009.gif) : :![[thin space (1/6-em)]](https://www.rsc.org/images/entities/char_2009.gif) 1, GHSV = 1500 h−1. 1, GHSV = 1500 h−1. |
||||||||||
| CZG0H | 123.7 | 13.2 | 33.4 | 7.6 | 18.6 | 49.5 | 1.9 | 5.0 | 43.7 | 8.1 |
| CZG1H | 146.1 | 14.5 | 36.6 | 6.9 | 19.9 | 41.4 | 2.1 | 3.7 | 52.8 | 10.5 |
| CZG3H | 154.2 | 15.0 | 37.9 | 6.7 | 20.8 | 34.8 | 2.0 | 4.9 | 58.3 | 12.1 |
| CZG5H | 163.8 | 15.5 | 39.1 | 6.5 | 22.3 | 30.0 | 2.0 | 5.5 | 62.6 | 14.0 |
| CZG10H | 164.2 | 15.3 | 38.5 | 6.6 | 21.3 | 31.5 | 2.1 | 5.8 | 60.7 | 13.0 |
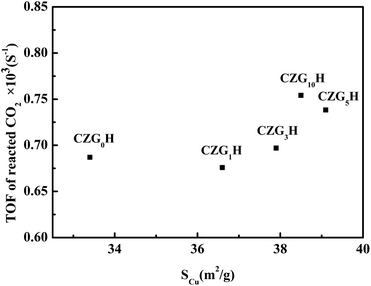
Turnover frequency (TOF) of CO2, which represents the molecular number of the transferred CO2 per second per surface Cu atom, has been calculated from the SCu for various catalysts. As shown in Fig. 1, to better understand the role of metallic Cu in the process of hydrogenation of CO2, TOF is also plotted versus SCu of the CZGxH catalysts. It can be seen that the values of TOF varied in the range of 0.67–0.75 × 10⁻³ s−1. TOF is not a fixed value, which indicates that the catalytic activity is not only related to SCu, but also affected by such factors as the interaction between copper and zinc oxide.24 This observation indicates a good correlation of structure sensitive characters of DME from CO2.25 In addition, combining the values of TOF with the results of Ga2O3 content in Table 1 indicates that the addition of Ga2O3 can increase the value of TOF.
3.2 The structure of the catalysts
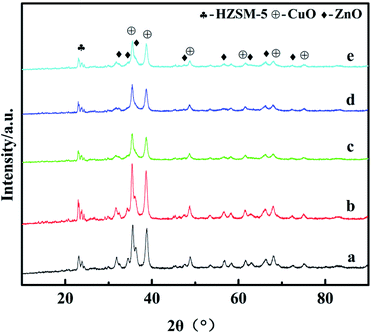
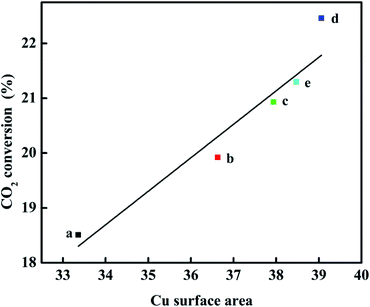
The X-ray diffraction results are shown in Fig. 2. For all the catalysts, the diffraction peaks at 2θ = 35.5°, 38.7°, 48.6°, 58.3°, 68.1°, and 75.2° can be indexed to the CuO phase (tenorite, JCPDS 48-1548), the peaks at 2θ = 31.8°, 34.4°, 36.3°, 47.6°, 56.6°, 62.9°, 66.4°, and 72.6° can be ascribed to the ZnO phase (JCPDS 65-3411), and the diffraction peaks observed in the 2θ range of 21–25° can be attributed to HZSM-5 (JCPDS 44-0003). However, diffraction peaks belonging to Ga2O3 or other new binding products are not observed for the catalysts with the promoter of Ga2O3 added, indicating that Ga2O3 species are present in either the amorphous state or highly dispersed in the catalysts and cannot be detected by XRD.26 Strong CuO peak intensities were detected in all the catalysts, which confirmed that they had been completely crystallized. With the increase of Ga2O3 content to 5%, the intensities of the CuO diffraction peaks decreased gradually, whereas the peak width broadened slightly; it can be inferred from Scherrer's formula that the average particle size of CuO decreases, indicating that the crystallinity of CuO decreased and the dispersion of copper increased with the addition of Ga2O3. Some diffraction peaks of CuO (2θ = 35.5°) and ZnO (2θ = 34.4° and 36.3°) were severely superimposed on each other, and similar phenomena had appeared in other works,27 which shows that the embedded dispersion of CuO and ZnO are relatively uniform. The fine particles of CuO and ZnO which may exist in an amorphous or more disordered form, this will promote the synergistic effect, thus resulting in the intensified CuO–ZnO interaction.28 This interaction between CuO and ZnO is beneficial to the increases in the activity for CO2 conversion, which exactly coincides with catalytic performance results.The Cu surface area, Cu dispersion, and Cu particle sizes are greatly affected by the concentrations of Ga2O3, as listed in Table 1. When the content of Ga2O3 increased, the change of the peak shape first increased and then decreased appeared in the Cu surface area and Cu dispersion. The Cu surface area correlated well with the copper dispersion; the results showed higher values of SCu and DCu for CZG5H than other catalysts, and the maximum values were found to 39.1 (m2 g−1) and 15.5%, respectively, while the particle size trend was opposite. The small CuO particles and improved copper dispersion can be ascribed to the character of the structural promoter of Ga2O3 increasing the resistance of CuO to sinter during the thermal treatment,30 which consequently results in a larger Cu surface area of the CZGxH catalysts. Decreasing the Ga2O3 loading below 5% or increasing the Ga2O3 loading over 5% also resulted in a decrease in Cu surface area and Cu dispersion, and an increase in Cu particle size, which is consistent with the XRD results. The results confirmed the conclusion that adding excessive Ga2O3 is no longer beneficial to improve the dispersion of Cu on the catalyst surface. As displayed in Fig. 3, a plot of CO2 conversion as a function of Cu surface area is depicted, and there is a linear relationship between them. Perhaps an increase in the SCu resulted in more dissociatively adsorbed hydrogen and its migration to ZnO or Ga2O3 through hydrogen spillover, which improved the activity of the catalyst. Therefore, Cu surface area is a crucial factor for the high yield of DME by hydrogenation of CO2.
3.3 The reducibility of the catalysts
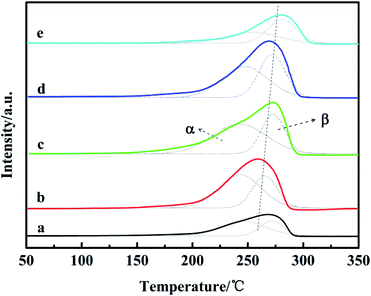
It has been reported that ZnO and Ga2O3 are not reduced under the H2-TPR conditions; therefore, the H2 reduction peaks observed were only related to the CuO reduction. The H2-TPR results are presented in Fig. 4. The occurrence of two Gaussian fitting peaks (α and β) is observed for all of the H2-TPR profiles, which has been related to the reduction of different CuO species in the catalysts. Previous authors have observed similar reduction peaks for Cu based catalysts and have regarded the α reduction peak at about 220–250 °C as the surface reduction peak of dispersed amorphous CuO, whereas the β reduction peaks around 270–300 °C can be classified as the reduction peaks of CuO in the bulk phase with large grains.31In Table 2, it is notable that the reduction peaks of all Ga2O3-added catalysts shifted to the higher temperature region, consistent with other literature studies.32 This is due to the existence of CuO particles with different sizes and the different interaction strength between CuO particles and other oxides in the catalyst.17 As the content of Ga2O3 changes, the area ratio of the two Gaussian peaks also changes. Among them, Aα/(Aα + Aβ) of CZG5H is the largest, the proportion of easily reduced CuO on the surface is up to 69% in this catalyst system, and the more CuO on the surface is beneficial to the hydrogenation of CO2. Whether the amount of Ga2O3 is too large or too small, the value of Aα/(Aα + Aβ) will decrease. Moreover, it could be observed that the addition of Ga2O3 (<5%) significantly increased the peak areas as compared to the reduction peak area of the Ga2O3-free catalyst, indicating that more CuO in the catalysts is reduced to produce more hydrogen consumption. However, adding excess Ga2O3 (10%) leads to a lower peak area; this suggests that Ga2O3 species may be incorporated into CuO or may be deposited on the surface of CuO, in accordance with previous observations.
| Catalyst | Tα | Tβ | Aα + Aβ | Aα/(Aα + Aβ) (%) |
|---|---|---|---|---|
| CZG0H | 236 | 269 | 6282 | 53 |
| CZG1H | 238 | 264 | 14463 | 57 |
| CZG3H | 241 | 270 | 15694 | 63 |
| CZG5H | 246 | 272 | 15849 | 69 |
| CZG10H | 248 | 277 | 8107 | 30 |
3.4 Surface acidity of the catalysts
Fig. 5 shows the NH3-TPD profiles of the catalysts. There are three desorption peaks near 110–150 °C (peak α), 330–400 °C (peak β) and 400–500 °C (peak γ) on the surface of each catalyst, which respectively correspond to the weak acid center, medium acid center and strong acid center on the surface of the catalyst.33 In Table 3, compared with the Ga2O3-free catalyst, peak α moves slightly to higher temperature, while peaks β and γ shift to higher temperature more obviously, suggesting the increased strength, implying that Ga2O3 modification increased the catalyst medium and strong acidity obviously. During the preparation process, the amount of oxalic acid as a precipitator will be changed with the addition of Ga2O3, which may modify the medium and strong acid sites. Comparing the total amount of acid with the increase of Ga2O3 content in the catalyst, the peak areas of NH3 desorption peaks first increase and then decrease, indicating that the surface acid amounts change correspondingly.34 It can be seen that the peak area of CZG5H is the largest, and the content of weak acids is large, which is beneficial to the improvement of DME selectivity.17,33 Comparing the NH3-TPD and the previous catalytic performance results (Table 1), the CZGxH with different Ga2O3 contents has similar methanol selectivity, which indicates that the acidity of the catalyst is enough to convert the generated methanol to DME. The dimethyl ether selectivity is significantly different. The results suggest that an appropriate acid content and acid strength of the catalyst are favorable for the selectivity to DME in the reaction of CO2 hydrogenation to dimethyl ether.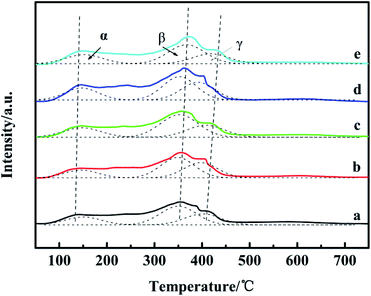 | ||
| Fig. 5 NH3-TPD spectrum of catalysts with different Ga2O3 contents: (a) CZG0H; (b) CZG1H; (c) CZG3H; (d) CZG5H; (e) CZG10H. | ||
| Catalyst | Weak acidic amount | Medium acidic amount | Strong acidic amount | Total acidic amount |
|---|---|---|---|---|
| a The amount of acidity of CZG5H was assigned as 1.0, and compared with that of the other samples. The temperature in parentheses is Tmax. | ||||
| CZG0H | 0.13 (140 °C) | 0.32 (354 °C) | 0.19 (407 °C) | 0.64 |
| CZG1H | 0.13 (144 °C) | 0.34 (355 °C) | 0.25 (409 °C) | 0.71 |
| CZG3H | 0.20 (148 °C) | 0.47 (356 °C) | 0.25 (415 °C) | 0.92 |
| CZG5H | 0.22 (146 °C) | 0.44 (362 °C) | 0.34 (415 °C) | 1.00 |
| CZG10H | 0.19 (152 °C) | 0.39 (373 °C) | 0.21 (425 °C) | 0.79 |
3.5 Adsorption and desorption performance of catalysts for CO2
CO2 TPD profiles of reduced CZG0H and CZG5H catalysts are shown in Fig. S3.† There are three CO2 desorption peaks. With Ga2O3 addition, the proportion of weak CO2 adsorption (<300 °C) and strong CO2 adsorption (>500 °C) increased, while the proportion of medium adsorption (300–450 °C) decreased. It can be seen that the addition of Ga2O3 did not promote the absorption of CO2 (Fig. S3 and Table S5†).3.6 X-ray photoelectron spectroscopy analysis
As shown in Fig. 6, the surface chemical states of the Cu, Zn and Ga on the prepared catalysts were analyzed by X-ray photoelectron spectroscopy (XPS). As representative results, the XPS spectra of Cu 2p for the ex situ prepared catalysts of CZG0H and CZG5H are shown in Fig. 6A. It can be observed that the binding energies (BE) of the main characteristics peaks at about 932.9 eV and 953.0 eV are assigned to Cu 2p3/2 and Cu 2p1/2, respectively,35 and two shake-up satellite peaks appeared at 940–945 eV, indicating that the copper species in the catalyst surface existed in the form of CuO.36 In addition, the binding energy values of Cu 2p3/2 and cu 2p1/2 increased slightly with the addition of Ga2O3, indicating that the interaction between Cu and Ga was enhanced,37 which was consistent with the results of H2-TPR. Both of the spectra contained two peaks at about 1022 and 1045 eV (Fig. 6B), which are assigned to Zn 2p3/2 and Zn 2p1/2 peaks of ZnO,38 respectively, with a spin energy separation of 23 eV. This shows that zinc atoms are present in the catalyst in the form of ZnO.39 The binding energies of Zn 2p1/2 and Zn 2p3/2 become larger with the addition of Ga2O3. Similarly, as shown in Fig. 6C, the double peaks of 1117.4 eV and 1144.5 eV correspond to the binding energies of Ga 2p3/2 and Ga 2p1/2 of reduced CZG5H, respectively, indicating that Ga2O3 is in the oxidation state of Ga3+.40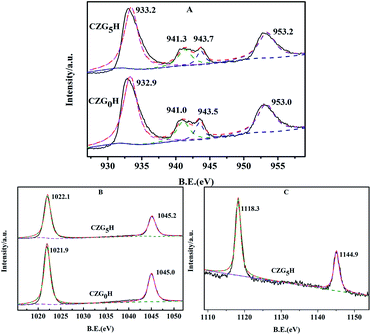 | ||
| Fig. 6 Spectra of the prepared hybrid catalysts of CZG0H and CZG5H: (A) Cu 2p; (B) Zn 2p; (C) Ga 2p. | ||
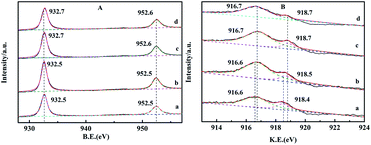
The XPS spectra of reduced and recovered CZG0H and CZG5H hybrid catalysts are shown in Fig. 7. The signal peaks of Cu that appeared at 933 eV and 952 eV are assigned to Cu 2p3/2 and Cu 2p1/2, respectively, which correspond to the reduction sites (Cu0 and/or Cu+)41 (Fig. 7A). Compared with Fig. 6A, the Cu 2p XPS spectra of the catalyst after H2 reduction show that the satellite peak disappeared and the Cu 2p peak moved to lower binding energy at the same time, indicating that copper was almost reduced to Cu+ or Cu0.42 The enhanced peak intensity indicates that the copper part of the bulk phase migrates to the surface during reduction. Sun et al. proposed that the electronic interaction between Cu and Zn will produce the active center Cu+–O–Zn, which provides a synergistic effect between Cu and ZnO for the production of dimethyl ether.43 After the reaction, the XPS intensity of Cu 2p changed slightly, but no obvious changes in the position and shape were observed. It can be seen that the valence state of copper has not changed after the catalyst is used (10 hours). The comparison shows that the valence states of Cu at the main Cu 2p3/2 and Cu 2p1/2 on the catalyst surface are basically unchanged after reduction and reaction, indicating that the catalyst has good chemical stability as a whole. In the XPS spectra of Cu 2p3/2, the binding energies of Cu+ and Cu0 are almost the same, and those of Cu2O and Cu metal are 932.2 eV and 932.4 eV, respectively. Therefore, the kinetic energies (KE) of the reduced catalyst were studied by Cu LMM X-ray auger electron spectroscopy (XAES) spectrum analysis to further distinguish the valence state of Cu on the catalyst surface. The line positions in the Cu (LMM) Auger spectra of the reduced and recovered CZG0H and CZG5H catalysts indicate that the two asymmetrically located peaks near 916.5 eV and 918.7 eV correspond to Cu+ and Cu0 species,18 respectively, and Cu+ is the main copper species detected on the catalyst surface (Fig. 7B). Based on the corresponding Cu LMM peaks, the Cu+/Cu0 area ratios of the two reduction catalysts are obtained by calculation. The area ratio of the CZG5H catalyst was higher than that of the CZG0H catalyst, which indicated that the ratio of Cu+/Cu0 can be maintained better with the addition of Ga2O3 and the activity of the catalyst may be determined by Cu+ species rather than Cu0 species.44 It is worth noting that this XPS test is not performed in situ, and this may be subject to some errors. Although there is still controversy about the active center of copper-based catalysts in the process of CO2 hydrogenation to methanol, it is generally believed that Cu+ and Cu0 contribute to the catalytic activity.19
3.7 Effect of reaction temperature on the catalysts
Reaction temperature also has a significant effect on CO2 conversion, product selectivity and yield. Under different temperature conditions, the changes of conversion and yield are shown in Fig. 8. It has been reported in the literature that Cu/ZnO-based catalyst activity will be reduced when the temperature exceeds 300 °C; the deactivation is caused by the aggregation of Cu crystals.45 Therefore, the maximum temperature we tested was controlled at 300 °C. Comparing the curves at different temperatures, it is concluded that the optimal reaction temperature is 260 °C. At low temperature, there is competitive adsorption of the reaction product CO and reactant CO2 on metal active sites. Methanol is mainly prepared by hydrogenation of CO produced by the reverse reaction of water vapor, so the conversion of carbon dioxide is low. Since the reaction is exothermic, with the increased temperature and reaction time of HZSM-5, there will be carbon deposition on the outer surface and in the channel, leading to a decrease in the DME selectivity. In addition, higher temperatures will cause sintering and crystallization of copper species, causing catalyst coking and thereby reducing the conversion rate of carbon dioxide.15 The yield of DME reached the maximum at 260 °C, which means that due to the exothermic reaction, the conversion of CO2 is thermodynamically restricted, or may be Cu sintering.46 Relatively the selectivity of CO gradually increased, which is due to the reverse water vapor reaction (RWGS) of CO2.47 In view of these results, we investigated the CO2 hydrogenation activity of the CuO–ZnO–Ga2O3/HZSM-5 catalyst at the optimal temperature of 260 °C.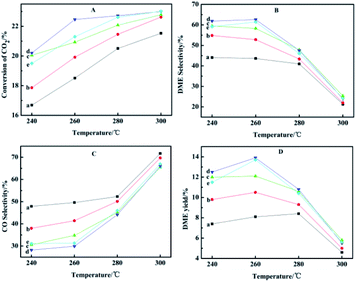 | ||
| Fig. 8 Effect of reaction temperature on the catalytic performance: (a) CZG0H; (b) CZG1H; (c) CZG3H; (d) CZG5H; (e) CZG10H. | ||
In view of these observations, each metal component has a unique effect on the system studied in this paper. As stated above, CuO is the active center of methanol reaction in the catalyst of carbon dioxide hydrogenation to dimethyl ether, which causes carbon dioxide hydrogenation to form methanol.48 ZnO can effectively improve the degree of copper dispersion to increase the specific surface area of Cu and increase the stability of the catalyst.49 The formation of the Zn–CuO alloy from ZnO and CuO is the main active point of methanol synthesis, thus increasing the conversion rate of CO2.50 The Ga2O3 promoted bifunctional catalyst shows a good dispersion of copper with a small particle size, which leads to a high surface area of copper and an increase in the acidity of dehydrated components. Ga2O3 as is used as an electronic promoter to adjust the optimal ratio of Cu+/Cu0 in the catalyst.29 All of these lead to a high rate of methanol formation and continuous dehydration to DME, thus increasing the selectivity to DME.51
4. Conclusions
In conclusion, Ga2O3 promoted CuO–ZnO–Ga2O3/HZSM-5 catalysts for dimethyl ether synthesis from CO2 hydrogenation were prepared and the catalytic performances were evaluated. An appropriate amount of Ga2O3 benefited smaller Cu particles, higher copper surface areas, intensified CuO–ZnO interaction, and proper acid amounts, maintained the proportion of Cu+/Cu0 on the surface of the catalyst and acid site distribution, therefore leading to higher CO2 conversion and DME selectivity. Among the investigated catalysts, the hybrid system CuO–ZnO–Ga2O3/HZSM-5 showed the best performance when the content of Ga2O3 was 5 wt% in the direct conversion of CO2 to DME. The CZG5H catalyst showed the maximum CO2 conversion, DME selectivity and DME yields of 22.3%, 62.6% and 14.0%, respectively, under the reaction conditions of the optimal reaction temperature of 260 °C, the space velocity of GHSV 1500 h−1 and the reaction pressure of 3.0 MPa.Conflicts of interest
The authors declare no conflict of interest.Acknowledgements
This work was supported by the National Natural Science Foundation of China (51301114), Natural Science Foundation of Liaoning Province (2019-ZD-0077), Natural Science Foundation of Shenyang University of Chemical Technology (XXLQ2019002), Science Research Foundation of Education Department of Liaoning Province (LZ2019003), and Liaoning Revitalization Talents Program (XLYC1907029).References
- O. I. Awad, O. M. Ali, R. Mamat, A. A. Abdullah, G. Najafi, M. K. Kamarulzaman, I. M. Yusri and M. M. Noor, Renewable Sustainable Energy Rev., 2017, 69, 1232–1242 CrossRef CAS.
- F. A. Rahman, M. M. A. Aziz, R. Saidur, W. A. W. A. Bakar, M. R. Hainin, R. Putrajaya and N. A. Hassan, Renewable Sustainable Energy Rev., 2017, 71, 112–126 CrossRef.
- Z. Azizi, M. Rezaeimanesh, T. Tohidian and M. R. Rahimpour, Chem. Eng. Process., 2014, 82, 150–172 CrossRef CAS.
- T. H. Fleisch, A. Basu and R. A. Sills, J. Nat. Gas Sci. Eng., 2012, 9, 94–107 CrossRef CAS.
- V. N. Ipatieff and G. S. Monroe, J. Am. Chem. Soc., 1945, 67, 2168–2171 CrossRef CAS.
- D. M. Sung, Y. H. Kim, E. D. Park and J. E. Yie, Catal. Commun., 2012, 20, 63–67 CrossRef CAS.
- S. J. Ren, X. Fan, Z. Y. Shang, W. R. Shoemaker, L. Ma, T. P. Wu, S. G. Li, N. B. Klinghoffer, M. Yu and X. H. Liang, J. CO2 Util., 2020, 36, 82–95 CrossRef CAS.
- I. Miletto, E. Catizzone, G. Bonura, C. Ivaldi, M. Migliori, E. Gianotti, L. Marchese, F. Frusteri and G. Giordano, Materials, 2018, 11, 2275 CrossRef PubMed.
- J. Abu-Dahrieh, D. Rooney, A. Goguet and Y. Saih, Chem. Eng. J., 2012, 203, 201–211 CrossRef CAS.
- S. Hassanpour, F. Yaripour and M. Taghizadeh, Fuel Process. Technol., 2010, 91, 1212–1221 CrossRef CAS.
- H. Bahruji, R. D. Armstrong, J. R. Esquius, W. Jones, M. Bowker and G. J. Hutchings, Ind. Eng. Chem. Res., 2018, 57, 6821–6829 CrossRef CAS.
- R. Khoshbin, M. Haghighi and P. Margan, Energy Convers. Manage., 2016, 120, 1–12 CrossRef CAS.
- M. Sanchez-Contador, A. Ateka, A. T. Aguayo and J. Bilbao, Fuel Process. Technol., 2018, 179, 258–268 CrossRef CAS.
- T. Witoon, P. Kidkhunthod, M. Chareonpanich and J. Limtrakul, Chem. Eng. J., 2018, 348, 713–722 CrossRef CAS.
- Q. Zhang, Y. Z. Zuo, M. H. Han, J. F. Wang, Y. Jin and F. Wei, Catal. Today, 2010, 150, 55–60 CrossRef CAS.
- Y. B. Hu, Y. J. Zhang, J. Du, C. Y. Li, K. J. Wang, L. D. liu, X. R. Yu, K. Wang and N. Liu, RSC Adv., 2018, 8, 30387–30395 RSC.
- W. J. Cai, Q. Chen, F. G. Wang, Z. C. Li, H. Yu, S. Y. Zhang, L. Cui and C. M. Li, Catal. Lett., 2019, 149, 2508–2518 CrossRef CAS.
- J. Słoczyński, R. Grabowski, P. Olszewski, A. Kozłowska, J. Stoch, M. Lachowska and J. Skrzypek, Appl. Catal., A, 2006, 310, 127–137 CrossRef.
- S. Natesakhawat, J. W. Lekse, J. P. Baltrus, P. R. Ohodnicki, B. H. Howard, X. Y. Deng and C. Matranga, ACS Catal., 2012, 2, 1667–1676 CrossRef CAS.
- G. Bonura, C. Cannilla, L. Frusteri and F. Frusteri, Appl. Catal., A, 2017, 544, 21–29 CrossRef CAS.
- H. Ham, S. W. Baek, C. H. Shin and J. W. Bae, ACS Catal., 2019, 9, 679–690 CrossRef CAS.
- Q. Jiang, Y. F. Liu, T. Dintzer, J. J. Luo, K. Parkhomenko and A. C. Roger, Appl. Catal., B, 2020, 269, 118804 CrossRef.
- Y. Q. Zhao, J. X. Chen and J. Y. Zhang, J. Nat. Gas Chem., 2007, 16, 389–392 CrossRef CAS.
- Q. Sun, Y. L. Zhang, H. Y. Chen, J. F. Deng, D. Wu and S. Y. Chen, J. Catal., 1997, 167, 92–105 CrossRef CAS.
- Y. J. Lee, M. H. Jung, J. B. Lee, K. E. Jeong, H. S. Roh, Y. W. Suh and J. W. Bae, Catal. Today, 2014, 228, 175–182 CrossRef CAS.
- J. Toyir, P. R. de la Piscina, J. L. G. Fierro and N. Homs, Appl. Catal., B, 2001, 29, 207–215 CrossRef CAS.
- K. W. Jun, W. J. Shen, K. S. R. Rao and K. W. Lee, Appl. Catal., A, 1998, 174, 231–238 CrossRef CAS.
- Y. Q. Sun, X. H. Han and Z. K. Zhao, Catal. Sci. Technol., 2019, 9, 3763–3770 RSC.
- J. Toyir, P. R. de la Piscina, J. L. G. Fierro and N. Homs, Appl. Catal., B, 2001, 34, 255–266 CrossRef CAS.
- P. B. Sanguineti, M. A. Baltanas and A. L. Bonivardi, Appl. Catal., A, 2015, 504, 476–481 CrossRef CAS.
- C. J. Xu, X. Y. Hao, M. Y. Gao, H. Q. Su and S. H. Zeng, Catal. Commun., 2016, 73, 113–117 CrossRef CAS.
- S. Kuhl, J. Schumann, I. Kasatkin, M. Havecker, R. Schlogl and M. Behrens, Catal. Today, 2015, 246, 92–100 CrossRef.
- S. Asthana, C. Samanta, R. K. Voolapalli and B. Saha, J. Mater. Chem. A, 2017, 5, 2649–2663 RSC.
- L. Y. Li, D. S. Mao, J. Xiao, L. Li, X. M. Guo and J. Yu, Chem. Eng. Res. Des., 2016, 111, 100–108 CrossRef CAS.
- R. W. Liu, Z. Z. Qin, H. B. Ji and T. M. Su, Ind. Eng. Chem. Res., 2013, 52, 16648–16655 CrossRef CAS.
- C. M. Li, X. D. Yuan and K. R. Fujimoto, Appl. Catal., A, 2014, 469, 306–311 CrossRef CAS.
- F. C. F. Marcos, J. M. Assaf and E. M. Assaf, Mol. Catal., 2018, 458, 297–306 CrossRef CAS.
- F. P. Li, M. Ao, G. H. Pham, J. Sunarso, Y. P. Chen, J. Liu, K. Wang and S. M. Liu, Small, 2020, 16, 1906276 CrossRef CAS PubMed.
- V. Deerattrakul, P. Dittanet, M. Sawangphruk and P. Kongkachuichay, J. CO2 Util., 2016, 16, 104–113 CrossRef CAS.
- A. M. Hengne, D. J. Yuan, N. S. Date, Y. Saih, S. P. Kamble, C. V. Rode and K. W. Huang, Ind. Eng. Chem. Res., 2019, 58, 21331–21340 CrossRef CAS.
- L. M. He, X. R. Li, W. W. Lin, W. Li, H. Y. Cheng, Y. C. Yu, S. I. Fujita, M. Arai and F. Y. Zhao, J. Mol. Catal. A: Chem., 2014, 39, 143–149 CrossRef.
- P. H. Matter, D. J. Braden and U. S. Ozkan, J. Catal., 2004, 223, 340–351 CrossRef CAS.
- K. P. Sun, W. W. Lu, F. Y. Qiu, S. W. Liu and X. L. Xu, Appl. Catal., A, 2003, 252, 243–249 CrossRef CAS.
- K. Klier, Adv. Catal., 1982, 31, 243–313 CAS.
- G. Celik, A. Arinan, A. Bayat, H. O. Ozbelge, T. Dogu and D. Varisli, Top. Catal., 2013, 56, 1764–1774 CrossRef CAS.
- S. J. Ren, W. R. Shoemaker, X. F. Wang, Z. Y. Shang, N. Klinghoffer, S. G. Li, M. Yu, X. Q. He, T. A. White and X. H. Liang, Fuel, 2019, 239, 1125–1133 CrossRef CAS.
- G. Bonura, M. Migliori, L. Frusteri, C. Cannilla, E. Catizzone, G. Giordano and F. Frusteri, J. CO2 Util., 2018, 24, 398–406 CrossRef CAS.
- S. Kattel, P. J. Ramírez, J. G. Chen, J. A. Rodriguez and P. Liu, Science, 2017, 355, 1296–1299 CrossRef CAS PubMed.
- J. Nakamura, T. Uchijima, Y. Kanai and T. Fujitani, Catal. Today, 1996, 28, 223–230 CrossRef CAS.
- T. Fujitani and J. Nakamura, Appl. Catal., A, 2000, 191, 111–129 CrossRef CAS.
- S. H. Kang, J. W. Bae, H. S. Kim, G. M. Dhar and K. W. Jun, Energy Fuels, 2010, 24, 804–810 CrossRef CAS.
Footnote |
| † Electronic supplementary information (ESI) available: Experimental section, figures and tables given in the Results and discussion section. See DOI: 10.1039/d0ra10849a |
| This journal is © The Royal Society of Chemistry 2021 |

