 Open Access Article
Ligand-based pharmacophore modeling, virtual screening and biological evaluation to identify novel TGR5 agonists†
Shizhen Zhao a,
Xinping Lia,
Wenjing Penga,
Le Wanga,
Wenling Yea,
Yang Zhaoa,
Wenbo Yinc,
Wei-Dong Chenab,
Weiguo Li*a and
Yan-Dong Wang*d
aKey Laboratory of Receptors-Mediated Gene Regulation and Drug Discovery, People's Hospital of Hebi, School of Medicine, Henan University, Henan, China. E-mail: hb_lwg@163.com
bKey Laboratory of Molecular Pathology, School of Basic Medical Science, Inner Mongolia Medical University, Hohhot, China
cKey Laboratory of Structure-Based Drug Design and Discovery, Ministry of Education, School of Pharmaceutical Engineering, Shenyang Pharmaceutical University, 103 Wenhua Road, Shenhe District, Shenyang 110016, PR China
dState Key Laboratory of Chemical Resource Engineering, College of Life Science and Technology, Beijing University of Chemical Technology, Beijing, China. E-mail: ydwangbuct2009@163.com
First published on 2nd March 2021
Abstract
Takeda G-protein-coupled receptor 5 (TGR5) is emerging as an important and promising target for the development of anti-diabetic drugs. To understand the structural characteristics of TGR5 agonists, the common feature pharmacophore models were generated and molecular docking was performed. The ligand-based virtual screening combined with pharmacophore mapping and molecular docking was performed to identify novel nonsteroidal TGR5 agonists. Finally, 20 compounds were screened for in vitro TGR5 agonistic activity assay, and results showed most compounds exhibiting TGR5 agonistic activity at 40 μM. Among these compounds, V12 and V14 displayed obvious TGR5 agonist activity, with the EC50 values of 19.5 μM and 7.7 μM, respectively. Compounds V12 and V14 could be considered potential TGR5 agonist candidates and also may be used as initial hits for developing novel TGR5 agonists.
1. Introduction
Takeda G-protein-coupled receptor 5 (TGR5) belongs to the G-protein coupled receptor family and was first identified as a bile acid receptor in 2002.1,2 TGR5 is widely expressed in the gallbladder, placenta, spleen, and intestine.3 The activation of TGR5 can cause an increase of glucagon-like peptide-1 (GLP-1), which activates intestinal cell secretion and plays a key role in glucose metabolism and energy homeostasis.4–6 In addition, TGR5 activation promotes energy expenditure in brown adipose tissue and muscle by increasing the basal metabolic rate.4,7 Therefore, TGR5 has emerged as an attractive therapeutic target for the treatment of metabolic disorders, such as non-alcoholic steatohepatitis, type 2 diabetes mellitus (T2DM), and obesity.8,9Medicinal chemistry approaches have discovered a variety of TGR5 agonists (Fig. 1). These agonists can be divided into two categories: steroidal and nonsteroidal agonists. The first series is structurally based on bile acids (BAs), including cholic acid (CA),10 lithocholic acid (LCA),11 and their semisynthetic derivatives such as 6α-ethyl-23(S)-methylcholic acid (INT-777, a).12 The second series of TGR5 agonists includes some small synthetic molecules, such as [2-(2,5-dichlorophenoxy)pyridin-3-yl]-(3,4-dihydro-2H-quinolin-1-yl)methanone (b) and 4-(3,5-bis(trifluoromethyl)benzyl)-6-(2-fluorophen-yl)-4,5-dihydropyrido[3,2-f][1,4] oxazepin-3(2H)-one (c).13,14 These compounds possess excellent agonistic properties and are effective in the treatment of nonalcoholic steatohepatitis, hypercholesterolemia, hypertriglyceridemia, and T2DM.15
The aim of this study is to identify novel nonsteroidal TGR5 agonists through a computer-aided drug discovery approach. The ligand-based pharmacophore modeling and molecular docking were performed to determine the structural characteristics and binding modalities of the TGR5 agonists. Then the selected pharmacophore hypotheses were used to screen the FDA approved database, Specs, TargetMol and in our library databases. Further screening of the retrieved compounds was performed using molecular docking. Finally, 20 commercially available hit compounds were selected by our virtual screening approach, and evaluated for their in vitro TGR5 agonistic activity assay. Overall, the results of our study are expected to be useful in the development of new TGR5 agonists.
2. Materials and methods
2.1. Common feature pharmacophore model
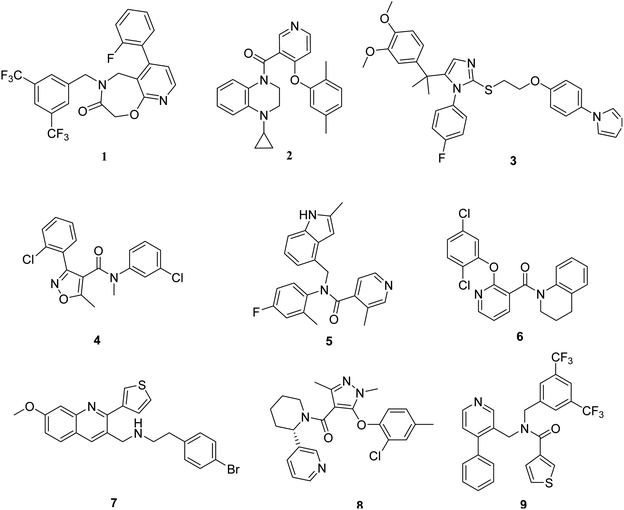
A pharmacophore is an abstract description of the structural features that are necessary for molecular recognition of a ligand by a biological macromolecule. In this study, the structures of the TGR5 agonists were selected in a manner that would ensure that they were bioassayed under similar conditions. Nine representative TGR5 agonists with diverse scaffolds were chosen to form a training set (Fig. 2). The diverse conformations within the training set were taken as the input ligands to create pharmacophore hypotheses by using the ‘Common Feature Pharmacophore Generation’ module in the Discovery Studio program package. The common feature pharmacophore analysis was carried out using the HipHop program of Discovery Studio 3.0.In this study, feature mapping revealed that hydrogen bond acceptor (A), hydrogen bond donor (D), hydrophobic group (H), and ring aromatic (R) could effectively map all agonists in the training set. The maximum pharmacophore hypotheses were set to ten. The minimum feature option was 4, and maximum feature option was 6. The principal and MaxOmit Feat values were assigned to these training set compounds (Table 1).The conformational models of the training set compounds were built using the “best conformer generation” method with a 10 kcal mol−1 energy threshold and the maximum conformation was set to 200. Maximum pharmacophore hypotheses was set to 10 and the minimum interfeature distance was set to 2.97 Å. All other parameters were set by default. Ten pharmacophore models were produced and the best one was selected for further study.
2.2. Pharmacophore validation
Decoy test method was used to evaluate the suitability of pharmacophore to identify TGR5 agonists. The decoy set consisted of 600 molecules which comprised of 30 known TGR5 agonists and 570 molecules with unknown activity randomly selected from the ZINC database. To compare a single pharmacophore to a set of ligands, we used the Ligand Pharmacophore Mapping protocol. Ligand Pharmacophore Mapping module with best conformation generation and flexible fitting sets was used. We then calculated parameters such as total hits (Ht), active hits (Ha), % yield of actives (%A), % ratio of actives (%Y), enrichment factor (EF), and goodness of hit score (GH).Here, D is number of compounds, A is number of active compounds, Ht is number of hits retrieved, Ha is number of actives in hit list, %A is a ratio of actives retrieved in hit list, %Y is a fractions of hits relative to size of database (hit rate or selectivity), EF is enrichment factor, and GH is Güner–Henry score.
2.3. Molecular docking model
In order to evaluate the ligand interaction into TGR5 binding pocket, the molecular docking was carried out using the Schrödinger suite. A published crystal structure of P395 bound within the active site cavity of TGR5 (PDB ID:7CFM) with the resolution of 3.00 Å served as a useful template for the docking.22 The TGR5 was prepared by the “protein preparation wizard” module in Maestro. Missing residues in the protein structure were reconstructed. Assigned bond orders to all bonds in the TGR5 structure including het groups and added hydrogens to all atoms. Remove the original hydrogens before adding hydrogens to the structure. The water molecules were removed and energy minimization was done using OPLS_2005 force field, restrained minimization with convergence of heavy atoms to an RMSD of 0.3 Å.The “Receptor Grid Generation” module in Maestro is used to specify a receptor structure and set up the grid generation job. The binding site was defined as the site sphere of 15 Å radius around the original ligand P395 in the co-crystal structures. Ligands were prepared using “LigPrep” module in Maestro were minimized with OPLS-2005 force field. Ionization states were assigned at pH 7.0 ± 2, the chirality was retained, and the tautomers were generated. Finally, the “ligand docking” was carried out using the maestro based on the grid using standard precision (SP) and extra precision (XP) docking precision with ligands docked flexibly. The docked conformers were evaluated using GlideScore. All compounds were docked flexibly into binding site. In molecular docking, 5000 poses per ligand were generated for the initial phase of docking, out of which 800 best poses were chosen for energy minimization.
2.4. Cell-based TGR5 agonism assay
A lentivirus expressing human TGR5 (NM_001077191.1) was obtained from Hanbio Biotechnology Co. Ltd. HEK293T cells were transfected with lentivirus and a stable cell line was isolated using drug selection following standard techniques. LCA was used as reference compounds. The test compounds and reference compounds were prepared in DMSO at stock solutions of 10 mM. TGR5-mediated cAMP generation was assayed using a HTRF (Homogeneous Time-Resolved Fluorescence) detection method (HTRF cAMP dynamic 2 Assay Kit; Cisbio cat #62AM4PEB) according to the manufacturer's protocol. For agonist tests, 5 μl of cells were mixed with 5 μl of the test compound and incubated 30 min at room temperature in the white 384-well microplates. Then, 5 μl cAMP-d2 and 5 μl anti cAMP-cryptate in lysis buffer were added to each well followed by 1 hour incubation at room temperature. Signal was quantified on a CLARIOstar Microplate Reader (BMG LABTECH) and calculated using the equation (665 nm/620 nm) × 10![[thin space (1/6-em)]](https://www.rsc.org/images/entities/char_2009.gif) 000.
000.
3. Results and discussion
3.1. Common feature pharmacophore model and validation
The top-ten pharmacophore hypotheses were generated using this training set with scores ranging from 112.114 to 114.816 (Table 2). These hypotheses could be classified into two groups according to the pharmacophore features: HHHHAA (01, 02, 03, 06, 07, 08) and RHHHHA (04, 05, 09, 10). The hypotheses were classified by their locations and the direction of their features.| Hypothesis | Featuresa | Rankb | Direct Hitc | Partial Hitd | Max Fit |
|---|---|---|---|---|---|
| a H, hydrophobic group; A, hydrogen bond acceptor; R, ring-aromatic.b The ranking score of training set compounds fitting the hypothesis.c Direct Hit indicates whether (“1”) or not (“0”) a molecule in the training set mapped every feature in the hypothesis.d Partial Hit indicates whether (“1”) or not (“0”) a particular molecule in the training set mapped all but one feature in the hypothesis. Numeration of molecules is from right to left in both Direct Hit and Partial Hit. | |||||
| 01 | HHHHAA | 114.816 | 111111111 | 000000000 | 6 |
| 02 | HHHHAA | 114.617 | 111111111 | 000000000 | 6 |
| 03 | HHHHAA | 114.425 | 111111111 | 000000000 | 6 |
| 04 | RHHHHA | 113.818 | 111111111 | 000000000 | 6 |
| 05 | RHHHHA | 113.251 | 111111111 | 000000000 | 6 |
| 06 | HHHHAA | 112.834 | 111111111 | 000000000 | 6 |
| 07 | HHHHAA | 112.513 | 111111111 | 000000000 | 6 |
| 08 | HHHHAA | 112.302 | 111111111 | 000000000 | 6 |
| 09 | RHHHHA | 112.286 | 110111111 | 001000000 | 6 |
| 10 | RHHHHA | 112.114 | 111111111 | 000000000 | 6 |
3.2. Pharmacophore validation
To further validate the final pharmacophore models, the Güner–Henry (GH) scoring method was used to identify the best pharmacophore model.23,24 The decoy set consisted of 600 molecules which comprised of 30 known TGR5 agonists20,25–31 and 570 molecules with unknown activity randomly selected from the ZINC database. The results of the decoy set validation are shown in Table 3. All of the 30 active molecules were successfully identified by hypothesis 02, hypothesis 04 and hypothesis 09, and the number of total hits were 56, 46 and 64, respectively. GH score higher than 0.7 suggests a very good and reliable model.32,33 Hypothesis 04 possess an excellent GH score of 0.72. Thus, it can be indicating that the hypothesis 04 is a reliable model which may be valuable in identifying diverse active TGR5 agonists from the database.| Hypothesis | D | A | Ht | Ha | %A | %Ya | EF | GH |
|---|---|---|---|---|---|---|---|---|
| a Here, D is number of compounds, A is number of active compounds, Ht is number of hits retrieved, Ha is number of actives in hit list, %A is a ratio of actives retrieved in hit list, %Y is a fractions of hits relative to size of database (hit rate or selectivity), EF is enrichment factor, and GH is Güner–Henry score. | ||||||||
| 01 | 600 | 30 | 72 | 28 | 93.3 | 38.9 | 7.78 | 0.47 |
| 02 | 600 | 30 | 56 | 30 | 100.0 | 53.6 | 10.71 | 0.62 |
| 03 | 600 | 30 | 76 | 24 | 0.8 | 31.6 | 6.32 | 0.35 |
| 04 | 600 | 30 | 46 | 30 | 100.0 | 65.2 | 13.04 | 0.72 |
| 05 | 600 | 30 | 66 | 28 | 93.3 | 42.4 | 8.48 | 0.49 |
| 06 | 600 | 30 | 80 | 26 | 86.7 | 32.5 | 6.50 | 0.39 |
| 07 | 600 | 30 | 76 | 26 | 86.7 | 34.2 | 6.84 | 0.40 |
| 08 | 600 | 30 | 74 | 26 | 86.7 | 35.1 | 7.03 | 0.41 |
| 09 | 600 | 30 | 64 | 30 | 100.0 | 46.9 | 9.38 | 0.57 |
| 10 | 600 | 30 | 69 | 28 | 93.3 | 40.6 | 8.12 | 0.48 |
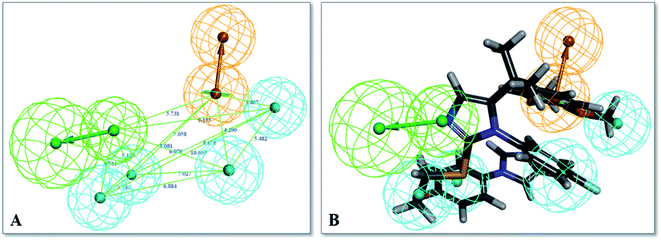
Finally, hypothesis model 04 was selected as the optimal pharmacophore model. As shown in Fig. 3, hypothesis model 04 contained a six point pharmacophore containing one ring aromatic (R), four hydrophobic groups (H), and one H-bond acceptor (A), which were represented as orange, cyan, and green, respectively. The training set compound 3 can be matched to the pharmacophore model 04 (Fig. 3B).
3.3. Virtual screening
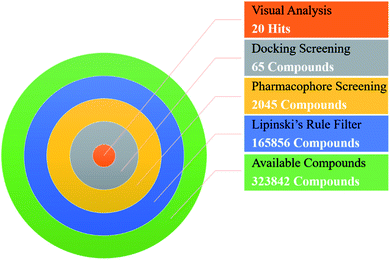
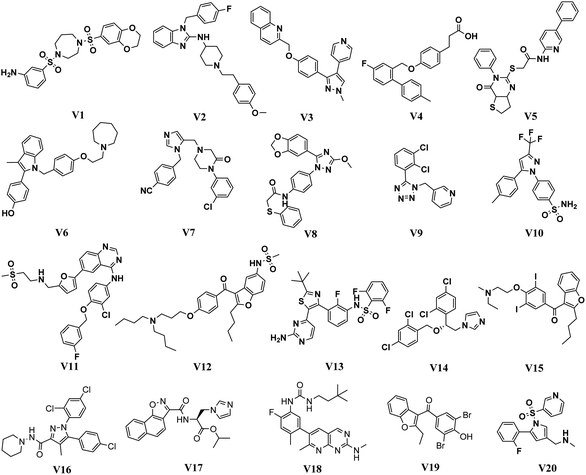
In order to identify novel TGR5 agonists, a multi-step virtual screening workflow including ligand-based pharmacophore screening, docking screening and finally a careful visual inspection of the molecules was performed. Firstly, the 323![[thin space (1/6-em)]](https://www.rsc.org/images/entities/char_2009.gif) 842 compounds of the DrugBank, Specs, TargetMol and in our library databases were screened by Lipinski's rule filter to remove unreasonable molecules using DruLiTo software. Secondly, the validated ligand-based pharmacophore model Hypo04 was used to screen. Based on the fit values (≥2) for a compound matching against pharmacophore, resulting in 2045 screening hits kept in the chemical library. Thirdly, the retrieved compounds from the pharmacophore search were saved as SD file and docked into the prepared receptor grid using standard precision (SP) and extra precision (XP) docking algorithm. The Glide XP scoring function was used to predict binding affinity between compounds and TGR5. According to the predicted binding energy (≤−6), top 65 compounds were picked out (see Tables S1 and S2†). The flowchart of the virtual screening is shown in Fig. 4. After careful visual inspection, 20 hit compounds (Fig. 5) were selected and purchased from Target Molecule Corp. for in vitro bioassay test.
842 compounds of the DrugBank, Specs, TargetMol and in our library databases were screened by Lipinski's rule filter to remove unreasonable molecules using DruLiTo software. Secondly, the validated ligand-based pharmacophore model Hypo04 was used to screen. Based on the fit values (≥2) for a compound matching against pharmacophore, resulting in 2045 screening hits kept in the chemical library. Thirdly, the retrieved compounds from the pharmacophore search were saved as SD file and docked into the prepared receptor grid using standard precision (SP) and extra precision (XP) docking algorithm. The Glide XP scoring function was used to predict binding affinity between compounds and TGR5. According to the predicted binding energy (≤−6), top 65 compounds were picked out (see Tables S1 and S2†). The flowchart of the virtual screening is shown in Fig. 4. After careful visual inspection, 20 hit compounds (Fig. 5) were selected and purchased from Target Molecule Corp. for in vitro bioassay test.
3.4. In vitro biological evaluation
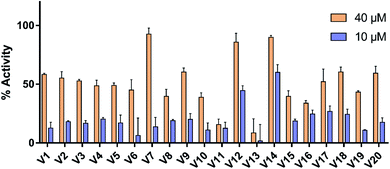
The selected compounds were evaluated for their ability to activate TGR5 by assessed for intracellular levels of cAMP. As reference compound, the response of LCA at 10 μM was defined as 100% TGR5 activation. Vehicle control with 0.1% DMSO was set to 0% TGR5 activation. As shown in Fig. 6, most compounds exhibited significant activity with more then 50% receptor activation at 40 μM. At 10 μM, only two compounds (V12 and V14) achieved more than 40% receptor activation, but the remaining compounds less then 30%. The most potent compounds V12 and V14 were further evaluated using a dose–response experiment (see Fig. S1†). Compounds V12 and V14 displayed obvious TGR5 agonist activity, with the EC50 values of 19.5 μM and 7.7 μM, respectively.3.5. Molecular docking analysis
In order to understand the binding mode, the most active compound V14 was docked into the active site of TGR5 by using the Glide XP. A published crystal structure of P395 bound within the active site cavity of TGR5 (PDB ID:7CFM) with the resolution of 3.00 Å served as a useful template for the docking. The docking conformations within the catalytic site of TGR5 are displayed in Fig. 7A.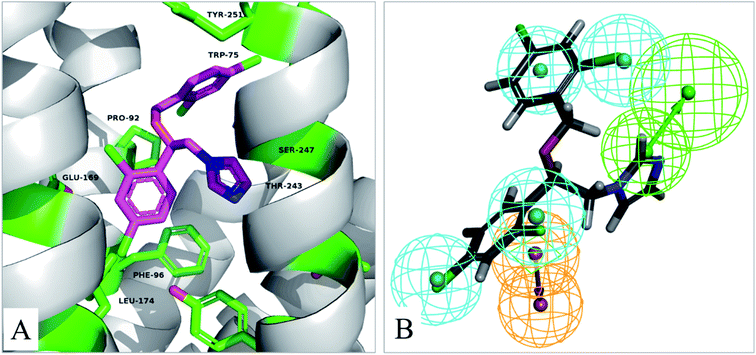 | ||
| Fig. 7 (A) The binding mode of compound V14 in the active site of TGR5 (PDB ID:7CFM). (B) Pharmacophore model 04 mapping with active compound V14. | ||
Compound V14 maps on the pharmacophore model 04 are shown in Fig. 7B. Compound V14 maps well on the pharmacophore feature hydrophobic feature (H), hydrogen bond acceptor (A), and aromatic ring (R). The imidazole group which mapped as hydrogen bond acceptor (A) was able to make hydrogen bond interactions with Thr243 and Ser247. The 2,4-dichloroaniline moiety which was mapped as aromatic ring (R) made pi–pi interactions with Phe96 and hydrophobic feature (H) with the surrounding residues Phe96, Glu169, Leu174. 2,4-Dichlorobenzyl alcohol moiety of the compound is a hydrophobic group, it can forms hydrophobic interaction with Leu74, Trp75, Pro92, which maps well on the pharmacophore feature hydrophobic feature (H).
4. Conclusion
TGR5 has emerged as an important and attractive therapeutic target for the treatment of metabolic disorders, such as non-alcoholic steatohepatitis, type 2 diabetes mellitus (T2DM), and obesity. Computational technique like virtual screening as been successfully applied for the generation of hit and lead structure candidates.To understand the mechanism of action of TGR5 agonists, common feature pharmacophore models were generated and molecular docking was performed. These models provided more detailed information and better descriptions of ligand binding. The common feature pharmacophore model consists of six chemical features (RHHHHA): one ring aromatic (R), four hydrophobic groups (H), and one hydrogen acceptor (A). Finally, ligand-based virtual screening combined with pharmacophore mapping and molecular docking was performed to identify novel nonsteroidal TGR5 agonists. Twenty compounds were selected for in vitro biological evaluation, and results showed that most compounds exhibited between 50% and 80% receptor activation at 40 μM. Among these compounds, V12 and V14 displayed obvious TGR5 agonist activity, with the EC50 values of 19.5 μM and 7.7 μM, respectively. Compounds V12 and V14 could be considered potential TGR5 agonist candidate and also may be used as initial hits for developing novel TGR5 agonists.
Conflicts of interest
There are no conflicts to declare.Acknowledgements
This work is supported by the National Natural Science Foundation of China (Grant No. 81970726 and No. 81472232), Henan Provincial Natural Science Foundation (Grant No. 182300410323), First Class Discipline Cultivation Project of Henan University (Grant No. 2019YLZDYJ19) and Plan for Scientific Innovation Talent of Henan Province (Grant No. 154100510004), Key Program for Science & Technology from Henan Education Department (Grant No. 21A310001) to W. -D. C., the National Natural Science Foundation of China (Grant No. 81903444), China Postdoctoral Science Foundation (Grant No. 2018M640674) and Key Science, Technology Program of Henan Province (Grant No. 192102310145) and Henan Postdoctoral Foundation (Grant No. 201902027) to S. Z., Major Scientific and Technological Innovation Project of Hebi to R. H., the National Natural Science Foundation of China (Grant No. 81970551 and No. 81672433) and the Fundamental Research Funds for the Central Universities and Research projects on biomedical transformation of China-Japan Friendship Hospital (Grant No. PYBZ1803) to Y. -D. W.References
- T. Maruyama, Y. Miyamoto, T. Nakamura, Y. Tamai, H. Okada, E. Sugiyama, T. Nakamura, H. Itadani and K. Tanaka, Biochem. Biophys. Res. Commun., 2002, 298, 714–719 CrossRef CAS.
- Y Kawamata, R. Fujii, M. Hosoya, M. Harada, H. Yoshida, M. Miwa, S. Fukusumi, Y. Habata, T. Itoh and Y. Shintani, J. Biol. Chem., 2003, 278, 9435–9440 CrossRef CAS.
- G. Vassileva, A. Golovko, L. Markowitz, S. J. Abbondanzo, M. Zeng, S. Yang, L. Hoos, G. Tetzloff, D. Levitan and N. J. Murgolo, Biochem. J., 2006, 398, 423 CrossRef CAS.
- M. Watanabe, S. M. Houten, C. Mataki, M. A. Christoffolete, B. W. Kim, H. Sato, N. Messaddeq, J. W. Harney, O. Ezaki and T. Kodama, Nature, 2006, 439, 484–489 CrossRef CAS.
- T. Maruyama, K. Tanaka, J. Suzuki, H. Miyoshi, N. Harada, T. Nakamura, Y. Miyamoto, A. Kanatani and Y. Tamai, J. Endocrinol., 2006, 191, 197–205 CAS.
- J. E. Campbell and D. J. Drucker, Cell Metab., 2013, 17, 819–837 CrossRef CAS.
- S. Katsuma, A. Hirasawa and G. Tsujimoto, Biochem. Biophys. Res. Commun., 2005, 329, 386–390 CrossRef CAS.
- G. Musso, M. Cassader, F. D. Michieli, F. Rosina, F. Orlandi and R. Gambino, Hepatology, 2012, 56, 933–942 CrossRef CAS.
- A. L. Birkenfeld and G. I. Shulman, Hepatology, 2014, 59, 713–723 CrossRef.
- J. Abrigo, F. Gonzalez, F. Aguirre, F. Tacchi, A. Gonzalez, M. P. Meza, F. Simon, D. Cabrera, M. Arrese, S. Karpen and C. Cabello-Verrugio, J. Cell. Physiol., 2021, 236, 260–272 CrossRef CAS.
- S. Li, M. Qiu, Y. Kong, X. Zhao, H. J. Choi, M. Reich, B. H. Bunkelman, Q. Liu, S. Hu, M. Han, H. Xie, A. Z. Rosenberg, V. Keitel, T. H. Kwon, M. Levi, C. Li and W. Wang, J. Am. Soc. Nephrol., 2018, 29, 2658–2670 CrossRef CAS.
- R. Pellicciari, A. Gioiello, A. Macchiarulo, C. Thomas, E. Rosatelli, B. Natalini, R. Sardella, M. Pruzanski, A. Roda and E. Pastorini, J. Med. Chem., 2009, 52, 7958–7961 CrossRef CAS.
- H. Duan, M. Ning, X. Chen, Q. Zou, L. Zhang, Y. Feng, L. Zhang, Y. Leng and J. Shen, J. Med. Chem., 2012, 55, 10475 CrossRef CAS.
- K. A. Evans, B. W. Budzik, S. A. Ross, D. D. Wisnoski, J. Jin, R. A. Rivero, M. Vimal, G. R. Szewczyk, C. Jayawickreme and D. L. Moncol, J. Med. Chem., 2009, 52, 7962–7965 CrossRef CAS.
- R. J. Hodge and D. J. Nunez, Diabetes, Obes. Metab., 2016, 18, 439–443 CrossRef CAS.
- S. Agarwal, A. Patil, U. Aware, P. Deshmukh, B. Darji, S. Sasane, K. V. Sairam, P. Priyadarsiny, P. Giri and H. Patel, ACS Med. Chem. Lett., 2015, 7, 51 CrossRef.
- B. W. Budzik, K. A. Evans, D. D. Wisnoski, J. Jin, R. A. Rivero, G. R. Szewczyk, C. Jayawickreme, D. L. Moncol and H. S. Yu, Bioorg. Med. Chem. Lett., 2010, 20, 1363–1367 CrossRef CAS.
- K. Hogenauer, L. Arista, N. Schmiedeberg, G. Werner, H. Jaksche, R. Bouhelal, D. G. Nguyen, B. G. Bhat, L. Raad, C. Rauld and J. M. Carballido, J. Med. Chem., 2014, 57, 10343–10354 CrossRef CAS.
- D. W. Piotrowski, K. Futatsugi, J. S. Warmus, S. T. M. Orr, K. D. Freeman-Cook, A. T. Londregan, L. Q. Wei, S. M. Jennings, M. Herr, S. B. Coffey, W. H. Jiao, G. Storer, D. Hepworth, J. Wang, S. Y. Lavergne, J. E. Chin, J. R. Hadcock, M. B. Brenner, A. C. Wolford, A. M. Janssen, N. S. Roush, J. Buxton, T. Hinchey, A. S. Kalgutkar, R. Sharma and D. A. Flynn, ACS Med. Chem. Lett., 2013, 4, 63–68 CrossRef CAS.
- A. T. Londregan, D. W. Piotrowski, K. Futatsugi, J. S. Warmus, M. Boehm, P. A. Carpino, J. E. Chin, A. M. Janssen, N. S. Roush, J. Buxton and T. Hinchey, Bioorg. Med. Chem. Lett., 2013, 23, 1407–1411 CrossRef CAS.
- J. J. Zhu, M. M. Ning, C. Guo, L. N. Zhang, G. Y. Pan, Y. Leng and J. H. Shen, Eur. J. Med. Chem., 2013, 69, 55–68 CrossRef CAS.
- F. Yang, C. Mao, L. Guo, J. Lin, Q. Ming, P. Xiao, X. Wu, Q. Shen, S. Guo, D.-D. Shen, R. Lu, L. Zhang, S. Huang, Y. Ping, C. Zhang, C. Ma, K. Zhang, X. Liang, Y. Shen, F. Nan, F. Yi, V. C. Luca, J. Zhou, C. Jiang, J.-P. Sun, X. Xie, X. Yu and Y. Zhang, Nature, 2020, 587, 499–504 CrossRef.
- M. M. Liu, L. Zhou, P. L. He, Y. N. Zhang, J. Y. Zhou, Q. Shen, X. W. Chen, J. P. Zuo, W. Li and D. Y. Ye, Eur. J. Med. Chem., 2012, 52, 33–43 CrossRef CAS.
- R. J. Li, Y. L. Wang, Q. H. Wang, J. Wang and M. S. Cheng, Comput. Math. Methods Med., 2015, 2015, 11 Search PubMed.
- S. Agarwal, A. Patil, U. Aware, P. Deshmukh, B. Darji, S. Sasane, K. V. V. M. Sairam, P. Priyadarsiny, P. Giri, H. Patel, S. Giri, M. Jain and R. C. Desai, ACS Med. Chem. Lett., 2016, 7, 51–55 CrossRef CAS.
- H. L. Duan, M. M. Ning, Q. A. Zou, Y. L. Ye, Y. Feng, L. N. Zhang, Y. Leng and J. H. Shen, J. Med. Chem., 2015, 58, 3315–3328 CrossRef CAS.
- B. W. Budzik, K. A. Evans, D. D. Wisnoski, J. Jin, R. A. Rivero, G. R. Szewczyk, C. Jayawickreme, D. L. Moncol and H. Yu, Bioorg. Med. Chem. Lett., 2010, 20, 1363–1367 CrossRef CAS.
- J. Zhu, M. Ning, C. Guo, L. Zhang, G. Pan, Y. Leng and J. Shen, Eur. J. Med. Chem., 2013, 69, 55–68 CrossRef CAS.
- Q. Zou, H. Duan, M. Ning, J. Liu, Y. Feng, L. Zhang, J. Zhu, Y. Leng and J. Shen, Eur. J. Med. Chem., 2014, 82, 1–15 CrossRef CAS.
- D. P. Phillips, W. Q. Gao, Y. Yang, G. B. Zhang, I. K. Lerario, T. L. Lau, J. Q. Jiang, X. Wang, D. G. Nguyen, B. G. Bhat, C. Trotter, H. Sullivan, G. Welzel, J. Landry, Y. L. Chen, S. B. Joseph, C. Li, W. P. Gordon, W. Richmond, K. Johnson, A. Bretz, B. Bursulaya, S. F. Pan, P. McNamara and H. M. Seidel, J. Med. Chem., 2014, 57, 3263–3282 CrossRef CAS.
- H. L. Duan, M. M. Ning, X. Y. Chen, Q. A. Zou, L. M. Zhang, Y. Feng, L. N. Zhang, Y. Leng and J. H. Shen, J. Med. Chem., 2012, 55, 10475–10489 CrossRef CAS.
- C. Jang, D. K. Yadav, L. Subedi, R. Venkatesan, A. Venkanna, S. Afzal, E. Lee, J. Yoo, E. Ji, S. Y. Kim and M. H. Kim, Sci. Rep., 2018, 8, 21 CrossRef.
- A. Zeb, M. Son, S. Yoon, J. H. Kim, S. J. Park and K. W. Lee, Comput. Struct. Biotechnol. J., 2019, 17, 579–590 CrossRef CAS.
Footnote |
| † Electronic supplementary information (ESI) available. See DOI: 10.1039/d0ra10168k |
| This journal is © The Royal Society of Chemistry 2021 |


