 Open Access Article
Controlled “off–on” fluorescent probe for the specific detection of hyperhomocysteinemia†
Jinrong Zhengb,
Jianlong Lid,
Hongli Luoc,
Lingbin Sune,
Mangmang Sang*b and
Xiu Yu *a
*a
aShenzhen Key Laboratory of Respiratory Diseases, Shenzhen People's Hospital (The Second Clinical Medical College, Jinan University, The First Affiliated Hospital, Southern University of Science and Technology), Shenzhen Institute of Respiratory Diseases, Shenzhen 518055, China. E-mail: xiuyucpu2015@163.com; Tel: +86-755-25533018
bXiamen Cardiovascular Hospital, Xiamen University, Xiamen 361006, China
cDepartment of Hepatobiliary Surgery, Yongchuan Hospital, Chongqing Medical University, Chongqing 400000, China
dDepartment of Imaging Radiology, Rizhao People's Hospital, Rizhao 276800, China
eDepartment of Anesthesiology, The Second Clinical Medical College (Shenzhen People's Hospital), Jinan University, Shenzhen 518055, China
First published on 22nd January 2021
Abstract
Hyperhomocysteinemia is an established risk factor for atherosclerosis and vascular disease. Therefore, designing a hyperhomocysteinemia specific probe is of great significance for the early warning of cardiovascular diseases. However, developing probes that can efficiently and specifically recognize homocysteine (Hcy) remains a tremendous challenge. Therefore, we designed an Hcy-specific fluorescent probe (HSFP) with excellent selectivity and anti-interference capability. Interestingly, this probe can automatically “off–on” in water solution, but the fluorescence of HSFP remains “off” when Hcy is present in the solution. The spectroscopic data demonstrated that the fluorescence of HSFP attenuated 13.8 folds toward Hcy in water without interference from other biothiols and amino acids. Furthermore, HSFP can sensitively reflect the change of Hcy content in cells. Therefore, HSFP was further applied to detect hyperhomocysteinemia in vivo with high efficiency. In summary, we have developed an Hcy-specific fluorescent probe to efficiently detect Hcy in vivo and in vitro, which may contribute to basic or clinical research.
Introduction
Amino acids (AA) are a key component of proteins, which are small molecules with various functional side chain groups and possess different functions in physiological processes.1 Because higher attention is being paid to diagnosis and treatment for diseases, the development of a novel strategy for the analysis of amino acids is urgent. Currently, electrochemical,2 chromatographic,3 and spectroscopic4 methods are the most commonly used analytical procedures for the detection and characterization of amino acids. But, the need for specialized equipment and trained personnel, high-cost analysis, and low test speed are the disadvantages of these methods, which also limits their usage.5 Therefore, novel, simple fluorescent, and colorimetric chemosensors with high sensitivity and selectivity are required for a breakthrough in the analysis of amino acids.Homocysteine (Hcy) is a natural amino mercaptan, which is the precursor of cysteine (Cys).6,7 The Hcy level in human plasma is regulated by converting Hcy to Met or Cys by remethylation or transsulfuration.8 Hyperhomocysteinemia (HHcy) develops because of an increase in Hcy content owing to metabolic abnormity.9 HHcy is known as one of the independent risk factors of cardiovascular disease10 and other major diseases, including neural tube defects, kidney failure, Alzheimer's disease, osteoporosis, and cancer.11–14 A rare homozygous deficiency in cystathionine-synthase (CBS) is contributed from severe HHcy owing to the failure of metabolizing homocysteine to cystathionine.15 Among patients with a plasma Hcy level of 200 mM, approximately half of them underwent life-threatening thromboembolic events before the age of 30.5 years if without treatment.16
The association between the enhanced Hcy levels and major disease risk has attracted more interest in its detection.17 Chromatography, immunoassays, or enzyme cycling is still the main method of clinical monitoring.18–20 Direct optical detection without complicated materials has a great advantage for determining Hcy.20–25 The structure of Hcy is very similar to Cys.26 However, circulating Hcy levels are typically 15–20 times lower than that of Cys.27 Therefore, the selective detection of Hcy by dosimeters or non-biochemical sensors, avoiding the disturbance of Cys has always been difficult. Furthermore, it has been reported that fewer optical sensors have been utilized to detect Hcy than Cys and other amino acids.28,29 Therefore, there is still an urgent requirement for Hcy-selective probes to facilitate the understanding of its role in diseases as either a causative agent or as a spectator biomarker.30
This study is aimed to develop Hcy-specific recognition probes. The Hcy-specific fluorescent probe (HSFP) is composed of 3,5-bis(trifluoromethyl)benzenesulfonyl group (Ph-CF3) and hemicyanine, a near-infrared fluorophore. Ph-CF3 can lead to the fluorescence quenching of the hemicyanine fluorophore. However, Ph-CF3 and hemicyanine could be automatically and gradually separated from each other in water, resulting in fluorescence recovery step by step. Interestingly, this automatic dissociation ability of HSFP was inhibited in the presence of Hcy. In other words, Hcy in the solution system could be determined by HSFP. We demonstrated that this inhibitory ability is unique to Hcy without interference from other biothiols or amino acids. Furthermore, the Hcy content can be monitored using HSFP at the cellular level and a mouse model of hyperhomocysteinemia. These results suggested that HSFP, as a Hcy specific recognition probe, has potential application value in clinical diagnosis.
Results and discussion
In this study, the cyanine (green) derivative hemicyanine (blue) was selected as the near-infrared fluorophore, and 3,5-bis(trifluoromethyl)benzenesulfonyl chloride was chosen as the fluorescence quencher. The target molecule HSFP (violet) was synthesized by a two-step reaction (Scheme 1).To verify that HSFP can identify Hcy, HSFP was first formulated into a 1 mM stock solution and analyzed for ultraviolet-visible absorption and fluorescence emission spectroscopy in a PBS![[thin space (1/6-em)]](https://www.rsc.org/images/entities/char_2009.gif) :
:![[thin space (1/6-em)]](https://www.rsc.org/images/entities/char_2009.gif) DMSO (9
DMSO (9![[thin space (1/6-em)]](https://www.rsc.org/images/entities/char_2009.gif) :
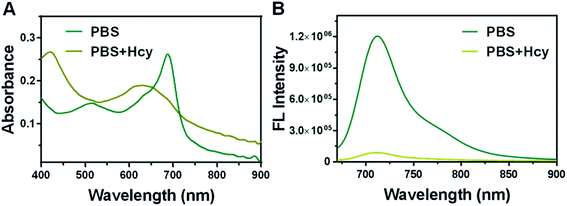
:![[thin space (1/6-em)]](https://www.rsc.org/images/entities/char_2009.gif) 1) system. The reaction of HSFP (10 μM) and Hcy (1 mM) was carried out at 37 °C for 3 h. As shown in the UV-Vis absorption spectrum (Fig. 1A), after the HSFP was placed in PBS for 3 hours, the wavelength of its maximum absorption peak appeared at 690 nm, while the maximum absorption peak wavelength of the reaction group of HSFP and Hcy was 635 nm. In addition, from the fluorescence spectrum, HSFP has a strong emission peak after being placed in PBS for 3 h, and the maximum emission wavelength is at 716 nm. However, the fluorescence is weakened after the reaction of HSFP and Hcy, which are 13.8-fold weaker than that in the PBS group (Fig. 1B). This result shows that HSFP can identify Hcy in the solution through low fluorescence.
1) system. The reaction of HSFP (10 μM) and Hcy (1 mM) was carried out at 37 °C for 3 h. As shown in the UV-Vis absorption spectrum (Fig. 1A), after the HSFP was placed in PBS for 3 hours, the wavelength of its maximum absorption peak appeared at 690 nm, while the maximum absorption peak wavelength of the reaction group of HSFP and Hcy was 635 nm. In addition, from the fluorescence spectrum, HSFP has a strong emission peak after being placed in PBS for 3 h, and the maximum emission wavelength is at 716 nm. However, the fluorescence is weakened after the reaction of HSFP and Hcy, which are 13.8-fold weaker than that in the PBS group (Fig. 1B). This result shows that HSFP can identify Hcy in the solution through low fluorescence.
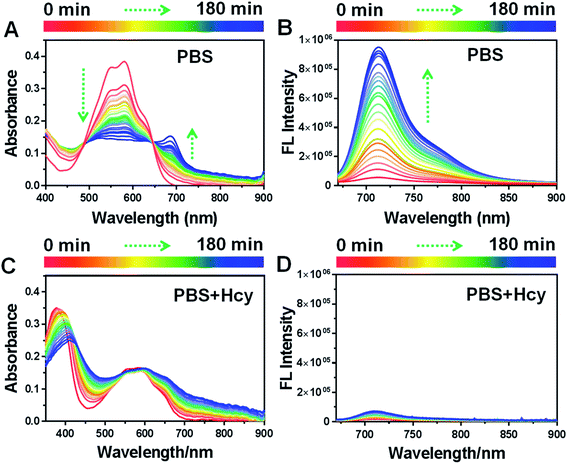
To analyze the mechanism of HSFP recognizing Hcy, we conducted a reaction kinetics study of HSFP in PBS and Hcy solution. We reported that HSFP could automatically trigger fluorescence in PBS. The absorption intensity at 590 nm gradually decreased within 0–180 min, while an increasingly enhanced peak appeared at 690 nm (Fig. 2A). Correspondingly, the HSFP fluorescence gradually increased at 716 nm within 0–180 min, which showed that HSFP could automatically decompose fluorophores in water to eliminate the quenching effect of the quencher. Interestingly, when Hcy was added to the aqueous solution, this automatic decomposition of HSFP was suppressed. As shown in Fig. 2C and D, the UV-Vis absorption spectra and fluorescence spectra of HSFP has no significant change due to the presence of Hcy within 0–180 min. This indicated that HSFP recognizing Hcy may be achieved by interrupting the automatic recovery of fluorescence.
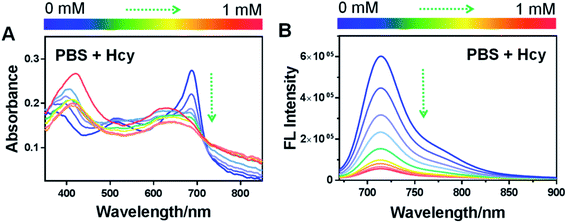
To further confirm this conclusion, we gradually augmented the concentration of Hcy in the reaction system from 0 to 1 mM. With the increase of Hcy concentration, the absorption peak of HSFP at 690 nm was gradually suppressed (Fig. 3A), while the fluorescence intensity at 716 nm steadily reduced (Fig. 3B). It further demonstrated that the process by which the fluorescence of HSFP is restored automatically was inhibited by Hcy. In other words, whether Hcy existed in the solution could be determined through this probe.
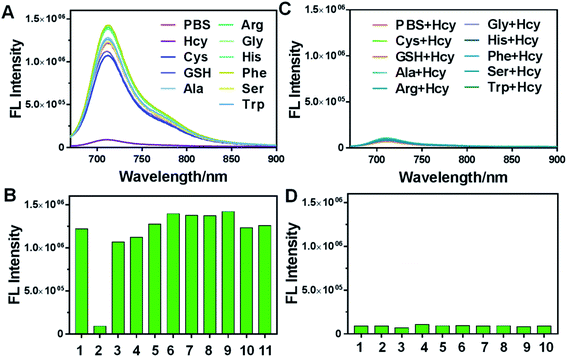
Next, we investigated the specific selectivity of the probe for Hcy by detecting the response of HSFP to other amino acids. As shown in Fig. 4A and B, adding other biothiols (GSH, Cys) or ordinary amino acids (Ala, Arg, Gly, His, Phe, Ser, and Trp) into the water did not affect the phenomenon in which the probe fluorescence in water was inhibited. This indicated that HSFP could be used for specific recognition of Hcy. Moreover, after adding Hcy to different amino acid solutions, the fluorescence of HSFP was significantly restrained, indicating that the process of HSFP recognizing Hcy would not be interfered by other amino acids. This anti-interference property ensured that HSFP could accurately identify Hcy in a complex biological environment (Fig. 4C and D).
To illustrate the mechanism of HSFP recognizing Hcy, we investigated the reaction products of HSFP with Hcy in water using HRMS. It was found that HRMS could automatically dissociate the quenching group from the fluorophore in water to expose the fluorophore structure corresponding to the peak of m/z = 412.2251 (Fig. S4†). However, neither the molecular structure signal of HSFP nor the fluorophore signal was uncovered in the presence of Hcy (Fig. S5†). These indicated that HSFP might generate a new structure after reacting with Hcy or Hcy destroyed the structure of the HSFP so that the fluorescence could not be triggered in water. Therefore, HSFP could play the role of difference identification of Hcy (Fig. S6†).
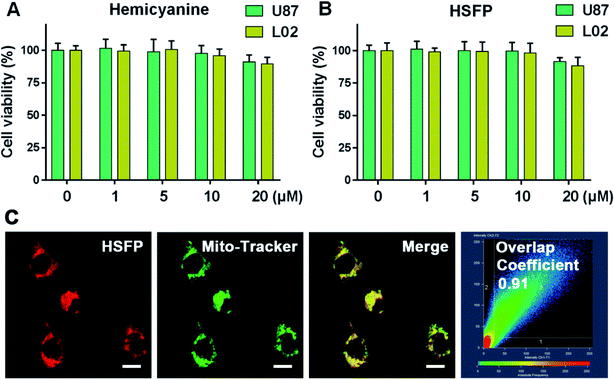
To monitor Hcy at the cellular level using HSFP, we first determined the cytotoxicity of the probe. The results showed that neither the hemicyanine fluorophore nor HSFP in the 20 μM range had significant cytotoxicity to tumor cells U87 or normal cells L02 (Fig. 5A and B). This indicated that the probe had good biocompatibility and could be used for cell imaging in vivo and in vitro. Sequentially, HSFP was found to have a mitochondrial localization function using the mitochondrial green probe, and the overlap coefficient with the mitochondrial probe at the cellular level was as high as 0.91 (Fig. 5C). Hemicyanine possessed the function of mitochondrial localization due to the positive nitrogen ion, indicating that the HSFP probe still had the function of mitochondrial localization after structural modification.
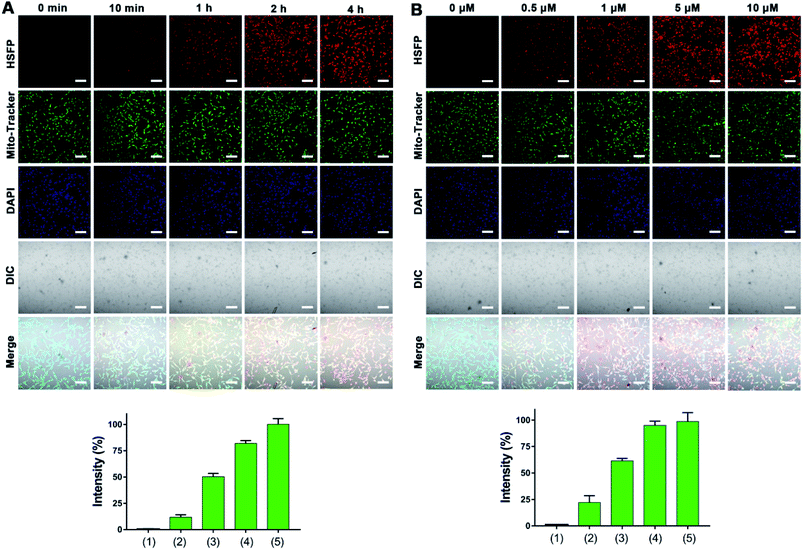
To determine the cellular uptake efficiency of HSFP in cells, the U87 cells were incubated with HSFP (1 μM) for 0 min, 10 min, 1 h, 2 h, and 4 h, respectively. Confocal imaging was collected to observe the fluorescence intensity of HSFP. As Fig. 6A showed, the fluorescence intensity of HSFP increases gradually from 0 min to 4 h. Because obvious fluorescence is seen at 2 h, we selected 2 h as the uptake time for the experiment.
To determine the incubation concentration of HSFP in cells, U87 cells were incubated with HSFP (0, 0.5, 1, 5, and 10 μM) for 2 h. Confocal imaging was collected to observe the fluorescence intensity of HSFP. As shown by Fig. 6B, the fluorescence intensity gradually increased from 0 to 10 μM. Because obvious fluorescence is observed at 1 μM and considering the biosafety, we selected 1 μM as the incubation concentration in cells.
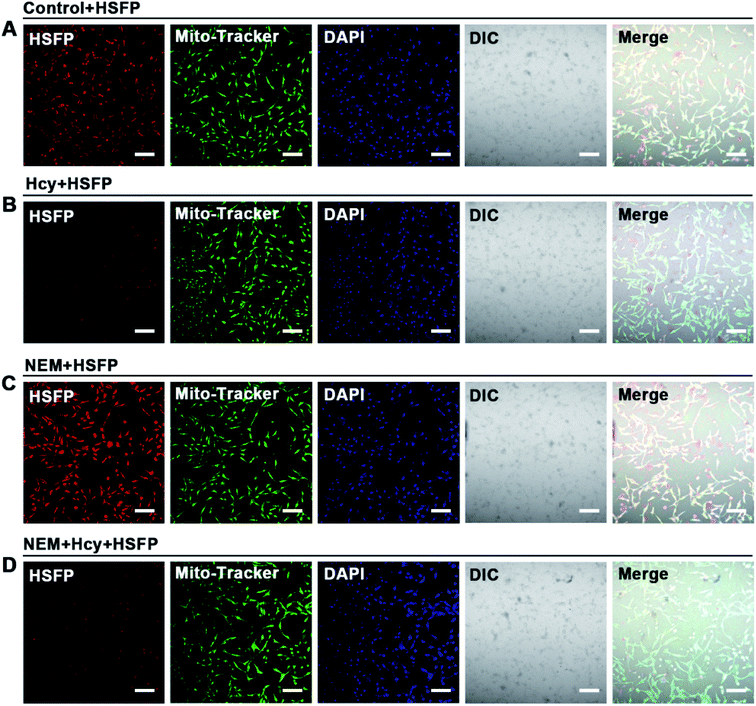
To detect Hcy in the cell by HSFP, 1 μM HSFP was incubated with U87 cells for 2 h and images were obtained by confocal imaging as an untreated control group (Fig. 7A). Secondly, U87 cells were incubated with 1 mM Hcy for 2 h to take up sufficient Hcy and then stained with 1 μM HSFP for 2 h. Compared to the control group, the fluorescence of HSFP was significantly weakened and hardly glowing (Fig. 7B). Moreover, after NEM was employed to eliminate Hcy in cells, the fluorescence of HSFP in cells significantly increased compared to the control group (Fig. 7C), which further confirmed the sensitivity of HSFP to Hcy at the cellular level. When the NEM-pretreated cells were supplemented with sufficient Hcy, HSFP fluorescence was expectedly weakened (Fig. 7D). These experimental results showed that HSFP could be utilized to detect Hcy at the cellular level, and the concentration of Hcy in cells could be reflected by fluorescence intensity.
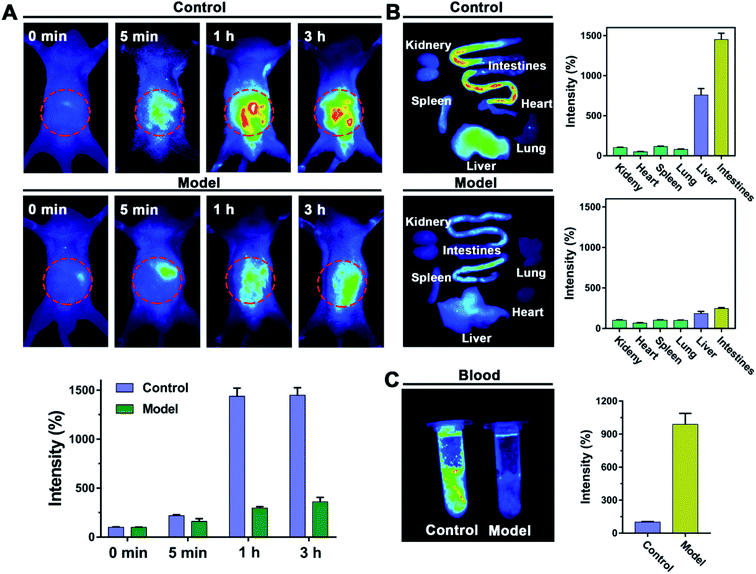
In this study, a probe HSFP with specific sensitivity to Hcy was developed. Its ultimate aim was to monitor hyperhomocysteinemia. It is well known that the total blood volume of a mouse is about 2 mL. Therefore, 200 μL of Hcy at a concentration of 2 mM was injected through the tail vein to simulate a hyperhomocysteinemia mouse model containing Hcy content of 200 μM in blood. The mouse was administrated via the tail vein with HSFP (50 μL) at a concentration of 100 μM, and then fluorescence intensity was detected by imaging the mouse in vivo at 0, 5, 1, and 3 h. It was found that the fluorescence was mainly centralized in the liver and intestine. The fluorescence in the control group significantly increased with time, indicating that the release of HSFP fluorescence required a specific time. In the model group, owing to the high concentrations of Hcy, the HSFP fluorescence was not always significantly enhanced (Fig. 8A). Hyperhomocysteinemia could be judged by this method. Furthermore, imaging of isolated organs from the mouse is similar to in vivo imaging. The fluorescence was primarily concentrated in the liver and intestine, while the fluorescence of the model group was significantly weaker than that of the control group (Fig. 8B). We compared the blood acquired from the control group with the model group mice and reported that the strong fluorescence appeared in the control group; otherwise, the model group had almost no significant fluorescence (Fig. 8C). This suggested the presence of high concentrations of Hcy in the model group. The above results indicated that HSFP, as a probe with specificity sensitive to Hcy, could be used to monitor Hcy in vivo.
Conclusion
In summary, our studies developed a probe HSFP with specific recognition to Hcy, which was constructed with Ph-CF3 and hemicyanine fluorophore. Ph-CF3 could bring about the fluorescence quenching of the hemicyanine fluorophore. Once they were separated from each other in water, fluorescence could be gradually obtained again. However, this automatic dissociation ability of HSFP was blocked by Hcy. Therefore, the existence or inexistence of Hcy could be determined through fluorescence intensity. Our results showed that this inhibitory ability of Hcy was not disturbed by other biothiols or amino acids. In vivo and in vitro experiments demonstrated that HSFP possessed the ability of specific recognition to Hcy whose content plays a central role in hyperhomocysteinemia. Our studies indicate that HSFP as a Hcy-specific recognition probe could exert potential application value in clinical diagnosis and treatment.Materials and methods
All animal procedures were performed in accordance with the Guidelines for Care and Use of Laboratory Animals of Jinan University, and experiments were approved by the Animal Ethics Committee of Jinan University. Mito-Tracker was purchased from Beyotime Biotechnology (Shanghai, China). All reagents were purchased from commercial suppliers. ESI-mass and high-resolution mass spectra (HRMS) were performed on a Water QTOF micro mass spectrometer (Waters, Milford, USA). Bruker AV-500 instrument (Billerica, USA) was used to record 1H NMR and 13C NMR.Synthesis of hemicyanine
The synthesis method of hemicyanine was adopted from a previous report.31Synthesis of HSFP
Compound hemicyanine (100.0 mg, 0.242 mM) and Cs2CO3 (39.6 mg, 0.121 mM) were dissolved in DCM and stirred for 10 min at 0 °C. Then, 3,5-bis(trifluoromethyl)benzenesulfonyl chloride (303.8 mg, 0.971 mM) was added and reacted overnight. The solvent was then removed under reduced pressure. The product was purified by a silica gel column (CH2Cl2/C2H5OH = 30![[thin space (1/6-em)]](https://www.rsc.org/images/entities/char_2009.gif) :
:![[thin space (1/6-em)]](https://www.rsc.org/images/entities/char_2009.gif) 1) to obtain the compound HSFP, which was a violet solid (134.2 mg, isolated yield: 80.3%): 1H NMR (500 MHz, DMSO) δ 8.78 (s, 1H), 8.52 (d, J = 20.0 Hz, 1H), 8.14 (s, 1H), 7.81 (dd, J = 10.0, 5.0 Hz, 2H), 7.58 (m, 3H), 7.36 (d, J = 5.0 Hz, 1H), 7.11 (d, J = 15.0 Hz, 1H), 6.92 (t, J = 7.5 Hz, 1H), 6.75 (d, J = 15.0 Hz, 1H), 4.50 (t, J = 7.5 Hz, 2H), 2.70 (tt, J = 7.5, 7.5 Hz, 4H), 1.85 (m, 4H), 1.75 (s, 6H), 1.00 (t, J = 7.5 Hz, 3H). 13C NMR (500 MHz, DMSO-d6) δ 179.63, 158.93, 152.84, 149.81, 141.75, 136.97, 132.63, 132.35, 131.41, 130.14, 129.82, 129.53, 129.25, 128.53, 126.43, 123.29, 121.75, 119.55, 115.05, 114.63, 110.91, 107.70, 106.67, 102.97, 51.44, 47.15, 29.16, 27.56, 23.95, 21.69, 20.15, 11.43. HRMS calculated for C36H32F6NO4S+ 688.1951, found [M+] 688.1967 (Fig. S1–S3†).
1) to obtain the compound HSFP, which was a violet solid (134.2 mg, isolated yield: 80.3%): 1H NMR (500 MHz, DMSO) δ 8.78 (s, 1H), 8.52 (d, J = 20.0 Hz, 1H), 8.14 (s, 1H), 7.81 (dd, J = 10.0, 5.0 Hz, 2H), 7.58 (m, 3H), 7.36 (d, J = 5.0 Hz, 1H), 7.11 (d, J = 15.0 Hz, 1H), 6.92 (t, J = 7.5 Hz, 1H), 6.75 (d, J = 15.0 Hz, 1H), 4.50 (t, J = 7.5 Hz, 2H), 2.70 (tt, J = 7.5, 7.5 Hz, 4H), 1.85 (m, 4H), 1.75 (s, 6H), 1.00 (t, J = 7.5 Hz, 3H). 13C NMR (500 MHz, DMSO-d6) δ 179.63, 158.93, 152.84, 149.81, 141.75, 136.97, 132.63, 132.35, 131.41, 130.14, 129.82, 129.53, 129.25, 128.53, 126.43, 123.29, 121.75, 119.55, 115.05, 114.63, 110.91, 107.70, 106.67, 102.97, 51.44, 47.15, 29.16, 27.56, 23.95, 21.69, 20.15, 11.43. HRMS calculated for C36H32F6NO4S+ 688.1951, found [M+] 688.1967 (Fig. S1–S3†).
Spectroscopy
The probe was dissolved in DMSO to prepare a 1 mM stock solution. The probe was then diluted to afford a final concentration of 10 μM in PBS buffer (10 mM, pH 7.4). The optical spectroscopy of HSFP was measured in the PBS/DMSO (9![[thin space (1/6-em)]](https://www.rsc.org/images/entities/char_2009.gif) :
:![[thin space (1/6-em)]](https://www.rsc.org/images/entities/char_2009.gif) 1, v/v, pH = 7.4) solution. For the reaction kinetics experiment, the absorbance and fluorescence intensity of HSFP (10 μM) was measured in PBS/DMSO = 9
1, v/v, pH = 7.4) solution. For the reaction kinetics experiment, the absorbance and fluorescence intensity of HSFP (10 μM) was measured in PBS/DMSO = 9![[thin space (1/6-em)]](https://www.rsc.org/images/entities/char_2009.gif) :
:![[thin space (1/6-em)]](https://www.rsc.org/images/entities/char_2009.gif) 1 toward Hcy (1 mM) from 0 min to 180 min. For the concentration dependence test, the absorbance and fluorescence intensity of HSFP (10 μM) was measured in PBS/DMSO = 9
1 toward Hcy (1 mM) from 0 min to 180 min. For the concentration dependence test, the absorbance and fluorescence intensity of HSFP (10 μM) was measured in PBS/DMSO = 9![[thin space (1/6-em)]](https://www.rsc.org/images/entities/char_2009.gif) :
:![[thin space (1/6-em)]](https://www.rsc.org/images/entities/char_2009.gif) 1 toward Hcy from 0 μM to 1 mM for 180 min.
1 toward Hcy from 0 μM to 1 mM for 180 min.
Cell culture and confocal imaging
U87 were seeded in Dulbecco's Modified Eagle's Medium (DMEM) supplemented with 10% fetal bovine serum in a confocal dish for 24 h. To determine the cell uptake of HSFP, U87 cells were incubated with HSFP (1 μM) for 0 min, 10 min, 1 h, 2 h, and 4 h. Mito-Tracker and DAPI were treated for 1 h before harvesting cells. To determine the optimal concentration of HSFP, U87 cells were incubated with HSFP (0, 0.5, 1, 5, and 10 μM) for 2 h. Mito-Tracker and DAPI were treated for 1 h before harvesting the cells. To confirm that HSFP can detect Hcy in cells, the U87 cells were divided into four groups: incubated with HSFP (1 μM, 2 h); incubated with HSFP (1 μM, 2 h) after pre-treated with Hcy (1 mM, 2 h); incubated with HSFP (1 μM, 2 h) after pre-treated with NEM (1 mM, 0.5 h); pre-treated with NEM (1 mM, 0.5 h) and then incubated with 1 mM Hcy for 2 h, and HSFP (1 μM) was added. The cells were then imaged using a Carl Zeiss LSM 700 confocal microscope.In vivo imaging
The ICR mouse was caudal vein injected with 200 μL Hcy (2 mM), and then injected 50 μL HSFP (100 μM). The in vivo imaging was conducted at 0 min, 5 min, 1 h, and 3 h. The kidney, intestine, spleen, lung, heart, and liver were harvested after treating for 3 h, and the imaging was obtained. The blood samples were then harvested after treating for 3 h, and the imaging was obtained. The relative fluorescent intensity was then calculated using ImageJ.Conflicts of interest
There are no conflicts to declare.Acknowledgements
This work was supported by the Natural Science Foundation of Guangdong (2018A030310011), and the National Natural Science Foundation of China (81703263).References
- S. Shahrokhian, Lead Phthalocyanine as a Selective Carrier for Preparation of a Cysteine-Selective Electrode, Anal. Chem., 2001, 73, 5972–5978 CrossRef CAS.
- C. Girardet, D. Vardanega and F. Picaud, Selective detection of chiral molecules by chiral single walled nanotubes, Chem. Phys. Lett., 2007, 443, 113–117 CrossRef CAS.
- J. Wang, M. P. Chatrathi and B. Tian, Micromachined separation chips with a precolumn reactor and end-column electrochemical detector, Anal. Chem., 2000, 72, 5774–5778 CrossRef CAS.
- J. M. Choi and R. V. Pappu, Experimentally Derived and Computationally Optimized Backbone Conformational Statistics for Blocked Amino Acids, J. Chem. Theory Comput., 2019, 15, 1355–1366 CrossRef.
- Y. Zhou, Z. C. Xu and J. Y. Yoon, Fluorescent and colorimetric chemosensors for detection of nucleotides, FAD and NADH: highlighted research during 2004-2010, Chem. Soc. Rev., 2011, 40, 2222–2235 RSC.
- B. Fowler, Homocysteine: overview of biochemistry, molecular biology, and role in disease processes, Semin. Vasc. Med., 2005, 5, 77–86 CrossRef.
- J. D. Finkelstein, The metabolism of homocysteine: pathways and regulation, Eur. J. Pediatr., 1998, 157, S40–S44 CrossRef CAS.
- T. D. Nolin, M. E. McMenamin and J. Himmelfarb, Simultaneous determination of total homocysteine, cysteine, cysteinylglycine, and glutathione in human plasma by high-performance liquid chromatography: application to studies of oxidative stress, J. Chromatogr. B: Anal. Technol. Biomed. Life Sci., 2007, 852, 554–561 CrossRef CAS.
- H. Refsum, P. M. Ueland, O. Nygard and S. E. Vollset, Homocysteine and cardiovascular disease, Annu. Rev. Med., 1998, 49, 31–62 CrossRef CAS.
- A. Boldyrev, Molecular mechanisms of homocysteine toxicity and possible protection against hyperhomocysteinemia, Free Radicals Biol. Med., 2009, 47, S137–S138 Search PubMed.
- S. Seshadri, A. Beiser, J. Selhub, P. F. Jacques, I. H. Rosenberg, R. B. D'Agostino, P. W. F. Wilson and P. A. Wolf, Plasma homocysteine as a risk factor for dementia and Alzheimer's disease, N. Engl. J. Med., 2002, 346, 476–483 CrossRef CAS.
- M. Herrmann, T. Widmann and W. Herrmann, Homocysteine – a newly recognised risk factor for osteoporosis, Clin. Chem. Lab. Med., 2005, 43, 1111–1117 CAS.
- A. R. Bernasconi, A. Liste, N. Del Pino, G. J. Rosa Diez and R. M. Heguilen, Folic acid 5 or 15 mg/d similarly reduces plasma homocysteine in patients with moderate-advanced chronic renal failure, Nephrology, 2006, 11, 137–141 CrossRef CAS.
- Y. Ozkan, S. Yardim-Akaydin, H. Firat, E. Caliskan-Can, S. Ardic and B. Simsek, Usefulness of homocysteine as a cancer marker: total thiol compounds and folate levels in untreated lung cancer patients, Anticancer Res., 2007, 27, 1185–1189 CAS.
- K. Shang, H. Li and X. Luo, Cerebral venous sinus thrombosis due to hyperhomocysteinemia with cystathionine-β-synthase (CBS) gene mutation: a case report, Medicine, 2019, 98, e14349 CrossRef.
- S. Eichinger, A. Stümpflen, M. Hirschl, C. Bialonczyk, K. Herkner, M. Stain, B. Schneider, I. Pabinger, K. Lechner and P. A. Kyrle, Hyperhomocysteinemia is a risk factor of recurrent venous thromboembolism, Thromb. Haemostasis, 1998, 80, 566–569 CAS.
- G. P. Ables, A. Ouattara, T. G. Hampton, D. Cooke, F. Perodin, I. Augie and D. S. Orentreich, Dietary methionine restriction in mice elicits an adaptive cardiovascular response to hyperhomocysteinemia, Sci. Rep., 2015, 6, 8886 CrossRef.
- M. G. M. de Sain-van der Velden, M. van der Ham, J. J. Jans, G. Visser, P. M. van Hasselt and H. C. M. T. Prinsen, Verhoeven-Duif NM Suitability of methylmalonic acid and total homocysteine analysis in dried bloodspots, Anal. Chim. Acta, 2015, 1, 435–441 CrossRef.
- S. Taysi, M. Keles, K. Gumustekin, M. Akyuz, A. Boyuk, O. Cikman and N. Bakan, Plasma homocysteine and liver tissue Sadenosylmethionine, S-adenosylhomocysteine status in vitamin B6-deficient rats, Eur. Rev. Med. Pharmacol. Sci., 2015, 19, 154–160 CAS.
- O. Rusin, N. N. St Luce, R. A. Agbaria, J. O. Escobedo, S. Jiang, I. M. Warner, F. B. Dawan, K. Lian and R. M. Strongin, Visual detection of cysteine and homocysteine, J. Am. Chem. Soc., 2004, 126, 438–439 CrossRef CAS.
- W. H. Wang, O. Rusin, X. Y. Xu, K. K. Kim, J. O. Escobedo, S. O. Fakayode, K. A. Fletcher, M. Lowry, C. M. Schowalter, C. M. Lawrence, F. R. Fronczek, I. M. Warner and R. M. Strongin, Detection of homocysteine and cysteine, J. Am. Chem. Soc., 2005, 127, 15949–15958 CrossRef CAS.
- S. Lim, J. O. Escobedo, M. Lowry, X. Xu and R. Strongin, Selective fluorescence detection of cysteine and N-terminal cysteine peptide residues, Chem. Commun., 2010, 46, 5707–5709 RSC.
- J. O. Escobedo, O. Rusin, W. Wang, O. Alpturk, K. K. Kim, X. Xu and R. M. Strongin, Detection of biological thiols, in Rev in Fluoresc, ed. C. D. Geddes and J. R. Lakowicz, 2006, pp. 139–162 Search PubMed.
- H. S. Jung, X. Chen, J. S. Kim and J. Yoon, Recent progress in luminescent and colorimetric chemosensors for detection of thiols, Chem. Soc. Rev., 2013, 42, 6019–6031 RSC.
- H. Peng, W. X. Chen, Y. F. Cheng, L. Hakuna, R. Strongin and B. H. Wang, Thiol reactive probes and chemosensors, Sensors, 2012, 12, 15907–15946 CrossRef CAS.
- S. T. Xu, J. Wu, B. F. Sun, C. Zhong and J. P. Ding, Structural and biochemical studies of human lysine methyltransferase Smyd3 reveal the important functional roles of its post-SET and TPR domains and the regulation of its activity by DNA binding, Nucleic Acids Res., 2011, 39, 4438–4449 CrossRef CAS.
- Q. H. Hu, C. M. Yu, X. Xia, F. Zeng and S. Z. Wu, A fluorescent probe for simultaneous discrimination of GSH and Cys/Hcy in human serum samples via distinctly-separated emissions with independent excitations, Biosens. Bioelectron., 2016, 15, 341–348 CrossRef.
- A. Barve, M. Lowry, J. O. Escobedo, J. Thainashmuthu and R. M. Strongin, Fluorescein Tri-Aldehyde Promotes the Selective Detection of Homocysteine, J. Fluoresc., 2016, 26, 731–737 CrossRef CAS.
- L. Hakuna, J. O. Escobedo, M. Lowry, A. Barve, N. McCallum and R. M. Strongin, A photochemical method for determining plasma homocysteine with limited sample processing, Chem. Commun., 2014, 50, 3071–3073 RSC.
- G. X. Yin, T. T. Niu, Y. B. Gan, T. Yu, P. Yin, H. M. Chen, Y. Y. Zhang, H. T. Li and S. Z. Yao, A Multi-signal Fluorescent Probe with Multiple Binding Sites for Simultaneous Sensing of Cysteine, Homocysteine, and Glutathione, Angew. Chem., Int. Ed. Engl., 2018, 57, 4991–4994 CrossRef CAS.
- J. R. Zhen, Y. Z. Shen, Z. Q. Xu, Z. W. Yuan, Y. Y. He, C. Wei, M. Er, J. Yin and H. Y. Chen, Near-Infrared Off-On Fluorescence Probe Activated by NTR for in vivo Hypoxia Imaging, Biosens. Bioelectron., 2018, 15, 141–148 CrossRef.
Footnote |
| † Electronic supplementary information (ESI) available. See DOI: 10.1039/d0ra08710f |
| This journal is © The Royal Society of Chemistry 2021 |


