 Open Access Article
Creative Commons Attribution 3.0 Unported Licence
Improvement of the photochromism taking place on ZnO/MoO3 combined material interfaces
Ines
Andron
ab,
Léa
Marichez
a,
Véronique
Jubera
a,
Alexandre
Fargues
a,
Christine
Frayret
 b and
Manuel
Gaudon
 *a
*a
aCNRS, Univ. Bordeaux, Bordeaux INP, ICMCB, UMR5026, 87 Avenue du Dr Albert Schweitzer, 33608 F-Pessac Cedex, France. E-mail: manuel.gaudon@icmcb.cnrs.fr
bLaboratoire de Réactivité et Chimie des Solides (LRCS), UMR CNRS 7314, Université de Picardie Jules Verne, Hub de l’Energie, 15 Rue Baudelocque, 80000 Amiens Cedex France. Réseau sur le Stockage Electrochimique de l’Energie (RS2E), FR CNRS 3459, France
First published on 17th December 2020
Abstract
Recently, we discovered a huge photochromic effect for ZnO/MoO3 powder mixtures compared with the corresponding single oxides. The former study focused on the coloring efficiency after UV-light irradiation and demonstrated that the pre-existing electrons in the conductive band of ZnO are of huge importance to the photochromism efficiency. Herein, the creation of the “self-closed Schottky barrier” at the solid–solid interfaces between the two oxides, associated with the full redox reaction at the origin of the photochromic properties, was modulated by (i) doping ZnO with Al3+ ions, (ii) annealing the powder mixture under low p(O2) atmosphere, and (iii) synthesizing our own ZnO nanoparticles and MoO3 particles using a polyol process. The characterization of the colouring effect under irradiation as well as the self-bleaching process allowed shedding light on this very complex photochromic mechanism. The coloring and bleaching efficiency (i.e. possibility to darken to more or less deep blue and to come back to the virgin material optical properties without any deterioration) depends upon multiple interconnected parameters controlling either the particle size and the interface areas between MoO3 and ZnO oxides or the number of pre-electrons in conduction bands of ZnO and MoO3 oxides. By correctly interpreting the ins and outs of the photochromism taking place at the created Schottky barriers in these binary ZnO/MoO3 mixtures, the exchange of the electrons and the oxygen anions through this Schottky interface can be manipulated in order to optimize the huge photochromism phenomenon.
1. Introduction
The photochromic material family can be divided into organic compounds, such as spiropyrans, azobenzenes, and diarylethenes,1–4 and inorganic ones, encompassing transition metal oxides, metal halides and rare earth complexes.5–8 For inorganic materials, photochromic phenomena are essentially linked to a photo-induced redox process, but commonly the photochromic contrast remains poor, while low power irradiation (equivalent to sun light irradiation in the UV region) is used. With respect to their potential applications, photochromic displays are considered as one of the most promising solutions to enhance light control and to reduce energy consumption in buildings through their coating as thin films on smart windows.9–11Research on inorganic photochromic materials is intense and very recently, numerous inorganic photochromic powder materials have been reported.12–15 Inorganic photochromic materials most often correspond to transition metal oxides corresponding to large gap (between 2.5 and 3.5 eV) semiconductors such as MoO3,16–22 Nb2O5,23,24 V2O525,26 and WO3.27–36 MoO3, as a single oxide, exhibits the best photochromic effect in terms of contrast and kinetics. The mechanisms governing the photochromic effect in these transition metal oxides are complex and not fully understood yet, with even a few controversies remaining on this topic. However, it is largely accepted that the photochromic mechanism is induced by irradiation wavelengths allowing a transfer across the semi-conductor forbidden bandgap, with electrons from the valence band (VB) having enough energy to be excited to the conduction band (CB), thus creating an exciton pair. This occurs for light energy in the UV range for MoO3. Charge depletion can then take place when atmospheric water is oxidized by the VB holes.5 Protons can thus be integrated into the crystal structure (bronze creation) and the remaining unpaired electrons are therefore trapped leading to the reduced Mo5+ species. The blue color results from the intervalence charge transfer (IVCT) between Mo5+ and Mo6+ species, with the maximal energy located at the visible-infrared border.
Recently our team has demonstrated that manually ground 50/50 wt%, ZnO/MoO3 mixtures exhibit a huge photochromic effect in comparison with the single MoO3 oxide. By analyzing the incidence of various ZnO oxide pre-treatments in different atmospheres (air, argon or argon–hydrogen), some drastic changes were observed. We evidenced that the creation of ZnO oxygen-poor surfaces is a key element to achieve an efficient Schottky barrier at the ZnO/MoO3 interface. Hence, the full mechanism was described as the succession of three main steps. First, the creation of photo-exciton pair in ZnO semi-conductor takes place. The oxygen anion holes on the ZnO surface act as reducing species of the MoO3 oxide. This oxide exhibits purely anionic surfaces, which is of high importance. Secondly, the oxygen transfers from MoO3 to ZnO surface are compensated by the injection of the depleted electrons from the ZnO CB to the MoO3 CB. In short, the as-reduced MoO3 oxide is colored from the IVCT between the Mo6+ ions and the newly occurring Mo5+ ions; on the other side of the barrier, the holes created in ZnO VB are recombined with the oxygen anions and/or electrons of the MoO3 surfaces (trapped in surface oxygen vacancies).
Beyond this important discovery in the field of photochromic materials, we developed in the present work several ways to act on the photochromic efficiency: high intensity of the coloring, high kinetics of coloring and possibility of bleaching in rather short times to address the potential reversibility of the properties. In the first stage, commercial and home-made (by using a polyol process) ZnO and MoO3 oxides with different morphologies and different pre-existing electrons inside their CBs are compared in terms of optical properties. This step involves the modulation of the oxygen anion/cation ratio and/or the introduction of aliovalent doping ions into the ZnO matrix. In the second stage of our protocol, the characterization of the coloring effect under UV irradiation is investigated for different mixtures obtained from various kinds of ZnO and MoO3 oxides. Finally, in the last stage, the self-bleaching efficiency and its kinetics with a certain speed, reflecting the ability to come back to the virgin material optical properties without any deterioration, are compared for the distinct above-mentioned situations.
2. Experimental
2.1. Synthetic procedures
ZnO and MoO3 commercial samples are provided by Alfa Aesar: CAS-1314-13-2, D03Y023 and CAS-1313-27-5, E01S050.2.2. Characterization techniques
3. Results and discussion
3.1. Schematic overview of the study
While a huge photochromic effect was evidenced in our earlier work37 for ZnO/MoO3 powder mixture, even under low power UV-irradiation, thanks to the creation of the “self-closed Schottky barrier” at the solid–solid interfaces, an improvement of this effect in terms of its modulation may still be required. Indeed, although this combined material exhibits both an exceptional colouring efficiency in terms of intensity and reversibility, with bleaching occurring in dark conditions tuning this complex photochromic effect with respect to its intensity, cycling ability and colouring/bleaching speed would be of interest for broadening its application. To reach this objective, it is important to note that varying the ZnO and MoO3 morphologies or the surface chemistry using soft-chemistry synthesis routes or doping the ZnO with Al3+ cation to inject more electrons in the ZnO CB should favour the photo-redox mechanism. The different parameters, which are supposed to have an impact on the photochromic effect are schematized in Fig. 1. It is possible to consider at least five parameters, which could play a part and influence this phenomenon: (i) the irradiance of the lamp, (ii) the relative bandgap positioning of the two single oxides, which are in contact, (iii) the occurrence of free electrons, especially in ZnO, which is the electron donor, (iv) the interface area (Schottky barrier area) between MoO3 and ZnO, and (v) the surface chemistry (given that it was demonstrated that the ZnO surface must be oxygen deficient in order to work as an efficient oxygen anion acceptor).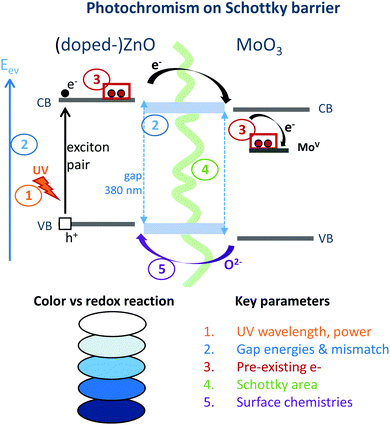 | ||
| Fig. 1 Scheme of the different parameters, which could act on the photochromic (colouring) efficiency of the ZnO/MoO3 combined material. | ||
The UV irradiance was fixed by keeping the same source and the same positioning for the sample and the lamp. Unfortunately, the four remaining parameters are clearly inter-correlated. For illustration, changing the synthesis route induces a modification of the morphology for the home-made metal oxide in such a way that the contact areas between the two compounds can be greatly tuned. The surface chemistry can be impacted by the polyol route leading to the reductive behaviour of the polyol solvent to oxygen-deficient surfaces for metal oxides.38–40 In turn, the defect surfaces act like intrinsic n-type defects and are associated with the occurrence of supernumerary free electrons in the CB. Finally, bandgap energies are thus also modified.
In the present paper, a comparison was performed between commercial ZnO–MoO3 mixtures and the same system involving instead oxides originating from our synthesis via the polyol route. This latter allows the preparation of nano-crystallites and the efficient doping with Al3+ of ZnO.38 Such as-prepared compounds from the polyol route can furthermore be used as raw materials (precipitates recovered after washing) or after post-annealing treatments under poor oxygen partial pressure to obtain oxygen-deficient surfaces, at intermediate temperatures (500 °C for ZnO and 400 or 600 °C for MoO3). From the comparison of different mixtures, we will search for an interpretation of the photochromic efficiency evolution in view of distinguishing the key parameters.
On an applicative point of view, the aim is obviously to achieve a mixture with maximal photochromic efficiency. Therefore, the commercial and prepared ZnO and MoO3 oxides were first studied in view of specifically characterizing their structural, and morphological aspects along with their optical properties. The mixtures using different combinations were characterized for a second time, by comparing their colouring efficiency on one hand, along with their relative ability for the bleaching process under dark conditions on the other hand.
3.2. Structural, morphological and optical characterization of different ZnO single oxides
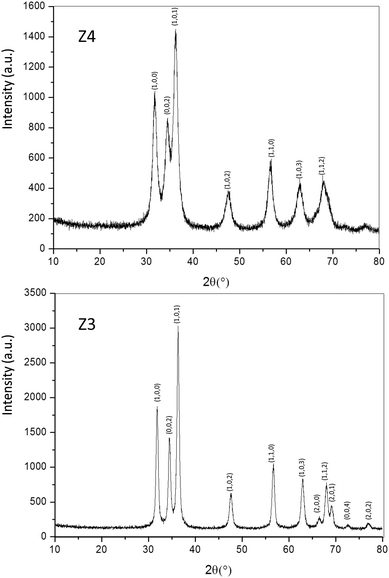
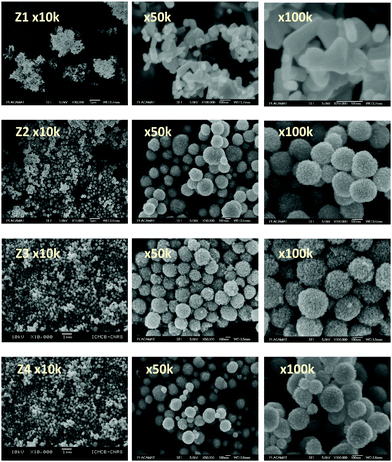
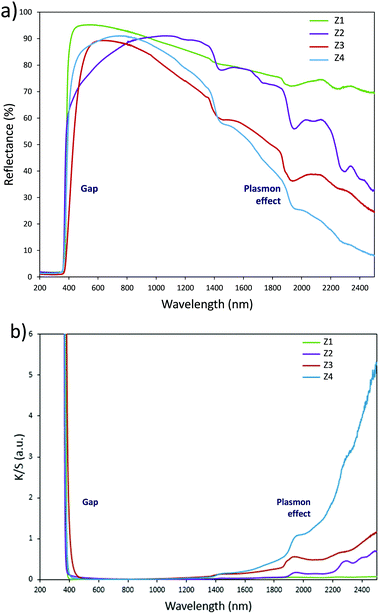
Structural characterization: four ZnO-type samples were used in the following study: the commercial powder: called Z1, the three samples obtained using the polyol process, undoped and non-annealed ZnO: Z2, doped and post-annealed sample under argon with ZnO0.97Al0.03O composition: Z3, and doped and non-annealed ZnO0.97Al0.03O: Z4. Z1 and Z2 were already deeply investigated in a previous article.37,38 Undoped and doped samples both exhibit X-ray diffractograms with all peaks being indexed in the Wurtzite system. The aluminium substitution for zinc does not produce any significant peak shift (in 2θ° position) or change in peak intensity. We can simply observe the peak width reduction between non-annealed and annealed samples, obviously associated with a crystallite size increase, as illustrated in Fig. 2. Indeed, from these X-ray diffraction patterns, the crystallite average size, which can be roughly estimated by using the Debye–Scherrer law, is about 100 nm for the Z1 commercial powder, 7–8 nm for Z2 and Z4 non-annealed samples obtained using the polyol process and 25 nm for the Z3 annealed sample originating from the polyol process.Optical properties. The diffuse reflectance spectra and the Kubelka–Munk transforms (K/S = (1 − R)2/2R, with R the reflectance) of the ZnO powder for the four studied samples (Fig. 4a and b) give indications on the efficiency observed in the case of the polyol synthesis route used here in order to obtain infrared selective absorbers. Indeed, each compound is characterized by a near total UV absorption (over the ZnO bandgap), and less than 20% of absorption in the 400–800 nm visible range. On the contrary, in the 800–2500 nm near infrared region, the absorption efficiency is known to be linked to plasma frequency. Therefore, in this area the charge carrier concentration (free electron concentration inside the ZnO CB) is significantly varied between the different samples. The Z1 sample exhibits nearly no infrared absorption. The Z2 sample presents a K/S ratio of about 0.6 at 2500 nm. This last observation illustrates the fact that polyol synthesis leads to the preparation of oxygen-deficient surfaces (i.e. intrinsic n-type ZnO semi-conductor). The Z4 sample displays a K/S ratio nearly equal to 5 at 2500 nm thus demonstrating that Al3+ doping is efficient to create a matrix with excess free electrons in comparison with the undoped sample (i.e. extrinsic n-type ZnO semi-conductor). The Z3 sample is characterized by an intermediate K/S ratio roughly equal to 1.0 at 2500 nm, thus indicating that post-annealing treatment, even performed under low oxygen partial pressure tends to reduce drastically the oxygen-deficiency of ZnO. This surface modification neutralizes the free electron activity. However, the doped and post-annealed sample, Z3, still exhibits a higher charge carrier concentration than the undoped and non-annealed Z2 sample.
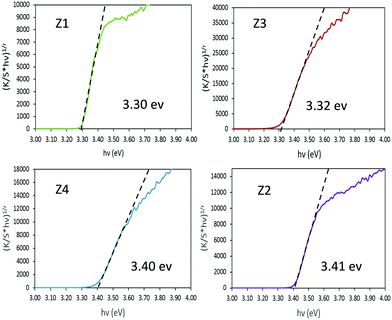
In order to extract the bandgap energy, with adequate accuracy from the optical measurements, Tauc plots, corresponding to (K/S × hυ)1/2vs. hυ) are depicted in Fig. 5 for the four Zx (x = 1–4) samples. By comparing the results observed for the four different zinc oxides, no strict correlation could be observed between the near-infrared absorption efficiency and the bandgap energy. However, one can notice that the crystallite size seems to play a crucial role in the bandgap energy tuning. Indeed, for samples with bigger crystallites (Z1 and Z3) a value of 3.3 eV is observed, while for the two other samples characterized by smaller crystallite size (Z2 and Z4) it amounts to 3.4 eV. The standard bandgap value given in the literature,41,42 for ZnO in its Wurtzite crystalline form, is about 3.3 eV. Hence, a shift of the bandgap positioning (blue shift) is observed only for the two nanometric materials (originating from the polyol process and without the use of any post-annealing treatment). Otherwise, no clear effect of the Al3+ doping is visible in these materials.
3.3. Structural, morphological and optical characterization of different MoO3 single oxides
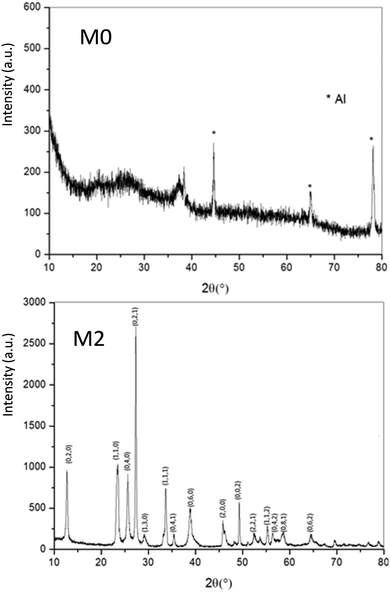
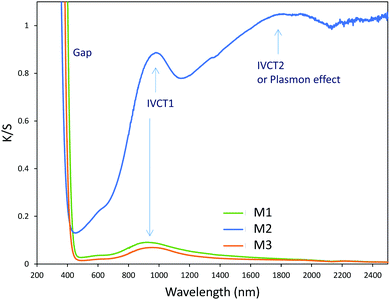
As a wide band-gap semi-conductor (like ZnO-type single oxides), the MoO3 shows a near total UV absorption whatever its morphology. The M1 and M3 samples exhibit pale yellow coloration, whereas the M2 sample presents a bluish colour, which is due to the occurrence of Mo5+ ions. The coloration is without any doubt linked to the IVCT between Mo5+ and Mo6+ neighbouring cations, Mo5+ acting like the color centre as well described in the introduction part.16–22
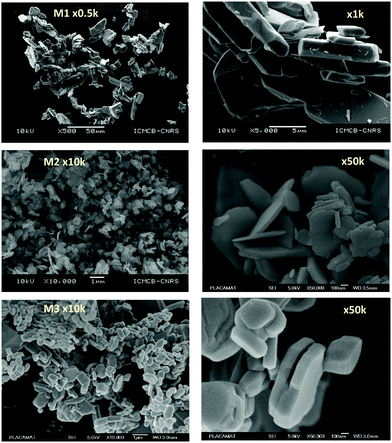
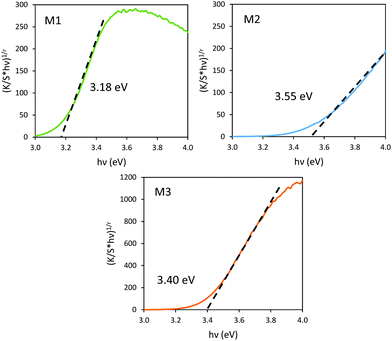
It has been already noticed that the raw precipitate obtained in the polyol solvent is deep blue and amorphous. It can thus reasonably be proposed that the origin of the Mo5+-rich composition in the M2 sample may result from a low temperature synthesis process, allowing it to maintain a high surface/volume ratio. Indeed, the Mo5+ ions are apparently stabilized thanks to the peeling off concerning the surface oxygen anions from the reductive action of the polyol solvent. Mo5+ concentration and surface/volume ratio in the MoO3 oxides are therefore positively correlated. The Tauc plots depicted show a bandgap position having a straightforward relationship with the particle size, as it was already demonstrated for the ZnO-type oxide series (the range of bandgap values lying in between 3.18 eV and 3.55 eV, for the M1 largest crystallite sample and the M3 smallest crystallite sample, respectively). An intermediate value is obtained for the M2 sample. Since chemical composition and crystallite size are interconnected as oxygen-deficient surfaces are obtained from the polyol route, it is difficult to conclude on the main parameter really governing the bandgap energy.
3.4. Photochromic properties (colouring mode) of ZnO–MoO3 mixtures
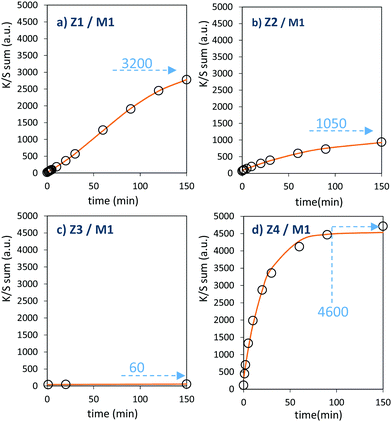
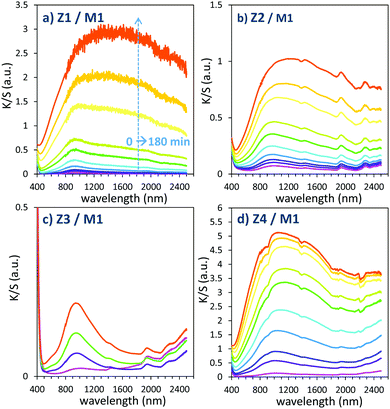 | ||
| Fig. 11 Photochromism overview (colouring mode) of the first 4 combined materials (using MoO3 commercial sample: M1). | ||
As shown in our previous paper,33 the associated kinetics can be fitted considering a sigmoid curve:
| K/S (sum) = A1 + (A2 − A1)/(1 + exp(t0 − t/k)), | (1) |
The powder mixture colouring efficiencies seem important in comparison with other systems proposed in the literature, typically, a quite deep blue colour is already obtained after few minutes of irradiation (one can note that results remain difficult to directly compare, since in studies of photochromic materials, the power of the source light excitation received by the sample in W m−2 is quite never specified). In growing order: from the sample with the poorest colouring efficiency up to the most efficient sample, we can classify the Z3/M1, Z2/M1, Z1/M1 and Z4/M1 mixtures. With such rising ordering, the A2 parameters are, respectively, 60, 1050, 3200 and 4600, illustrating the great variation of the performance behaviour of the four samples.
In terms of colouring speeds, no significant differences are observed from one sample to the other, asymptotic point being reached with similar irradiation time, of about 2–3 hours. On the contrary, the large differences in the colouring efficiency between the 4 first combined materials show that one can act on the photochromism taking place on the ZnO/MoO3 Schottky barriers. While polyol synthesis of ZnO is not associated with doping, it does not represent any benefit in comparison with the ZnO commercial powder (from the comparison between Z1/M1 and Z2/M1).
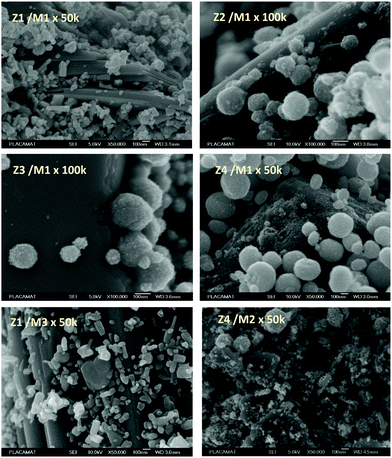
This result is in good agreement with the observation of low interface areas observed, thanks to the SEM investigations. However, despite the non-optimal morphology reached from the polyol process, the possibility to dope the ZnO represents a great advantage (from the comparison of Z4/M1 with Z1/M1). Supernumerary electrons in ZnO CB created by aliovalent dopant insertion is thus of primary importance. This is the proof that the photochromism actually proceeds from the injection of free electrons from ZnO into the MoO3 compound. Nonetheless, the post-annealing treatment of the Al-doped ZnO spheres obtained using the polyol route, even if it has previously been shown that the charge carrier concentration is still high, destroys the colouring possibility. This killing effect can be caused by the hardening of the ZnO polycrystalline spheres, thus avoiding the possibility to create sufficient contact areas between ZnO and MoO3 oxides. Moreover, with the post-annealing, the decrease of the surface oxygen deficiency of the ZnO oxide, also associated with the slight decrease of the charge carrier concentration as previously diagnosed, evidenced from absorption spectra, especially from the gap evolution extracted from the Tauc Plots (Fig. 5), can also be detrimental to the photochromism from the decrease of the oxygen anion transfer probability from the MoO3 surface to the ZnO one.
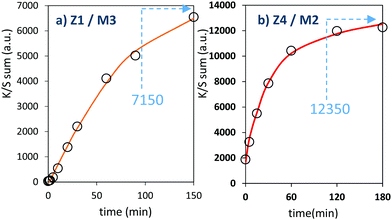
The two last combined materials: Z1/M3 and Z4/M2 have been finally analysed with same methodology. Their K/S transforms are reported in Fig. 13 and the plots of the K/S sum evolution vs. irradiation time are reported in Fig. 14.
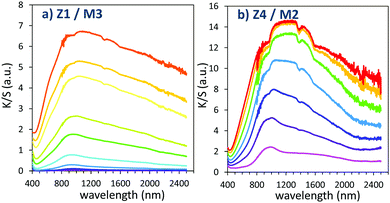 | ||
| Fig. 13 Photochromism overview (coloring mode) of the 2 last combined materials (using MoO3 oxide from the polyol route). | ||
Once again, in terms of colouring speeds, no significant differences are observed with previous studies, asymptotic point still being reached with an irradiation time of about 2–3 hours. Nevertheless, it can be observed that the colouring speed of the Z1/M3 mixture is a bit lower than the one characterizing the Z4/M2 mixture.
The colouring efficiencies are the highest reached up to now, with A2 equal to 7150 and 12350 for Z1/M3 and Z4/M2 mixtures, respectively. Using a MoO3 oxide with reduced dimension, prepared from the polyol process, is also a good idea (from the comparison between Z1/M1 and Z2/M3 materials). Especially, the combination of the most performing ZnO-type oxide with the smallest MoO3 oxide (expected to create the largest interface areas) leads to positive synergies (the Z4/M2 sample is nearly two times more efficient than the second-best mixture).
From the previous study, it can be concluded that to optimize the photochromic behaviour taking place at the Schottky interface between ZnO-type and MoO3 compounds, one has to: (i) use ZnO-type oxide with oxygen-deficient surfaces and supernumerary electrons, pre-injected in its CB, thanks to reductive treatments and/or aliovalent doping, and (ii) mix two oxides with crystallite size as smalle as possible to favour the creation of large interface areas.
Elsewhere, it can be noted that the shape of the absorption band is modified using samples with different chemical composition and/or morphology. A comparison of the absorption band envelops, obtained after 60 minutes of irradiation on the Z1/M1 and Z4/M2 combined materials, is reported in Fig. 15. The absorption band was fitted as the summation of three Gaussian contributions according to the following relation for each Gaussian curve:
| y = A × exp {−1/2 × [(x − xc)/w]2}, | (2) |
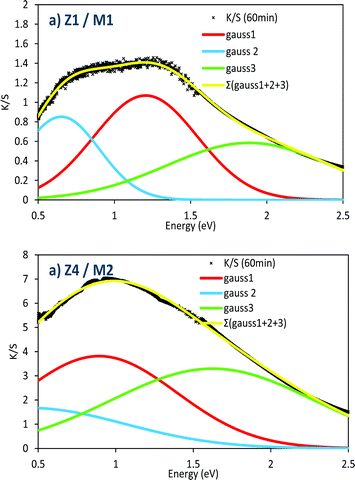 | ||
| Fig. 15 Comparison of the envelop parameters of the absorbance spectra after an irradiation of 60 min for the Z1/M1 and Z4/M2 mixtures. | ||
| Gauss 1 | Gauss 2 | Gauss 2 | |
|---|---|---|---|
| Z1/M1 | |||
| K/S intensity (a.u.) | 1.07 | 0.85 | 0.585 |
| Width (w) (eV) | 0.34 | 0.25 | 0.54 |
| Position (xc) (eV) | 1.20 | 0.25 | 1.88 |
| Z4/M2 | |||
| K/S intensity (a.u.) | 3.81 | 1.67 | ≈3.3 |
| Width (w) (eV) | 0.50 | 0.61 | ≈0.7 |
| Position (xc) (eV) | 0.89 | 0.44 | ≈1.6 |
To obtain satisfying simulation, i.e. a fit of the experimental absorbance envelop with a low reliability factor, three Gaussian curves, partially convoluted must be used. The 3 Gaussians have the following positions (see Table 1): the main one (Gaussian curve #1) is centred at about 0.8–1.2 eV; this main peak is surrounded by two satellite signals, located, respectively, at lower energy, around 0.2–0.5 eV, and at higher energy, around 1.6–1.9 eV.
The consideration of 3 Gaussians is difficult to definitively establish a conclusion. Based on our own studies of the photochromism dealing with WO3 nanoparticles,36 which have demonstrated a quite similar absorption envelop, the absorption can come from polaronic transfers (Mo5+ → Mo6+ intervalence charge transfers), but also from the formation of an electronic gas (plasmonic band linked to Drude's theory) in the MoO3 oxide, while the charge carrier concentration is sufficiently high. Indeed, for WO3 particles36 in which, per analogy with MoO3, the W5+–W6+ oxidation state mixture, produced from light photo-reduction, is also at the origin of the coloration, it was shown combining EPR and XPS spectroscopy that polaronic transfer can occur beyond a critical W5+ concentration. Thus, the appearance of the high energy component (band located at 1.5–2 eV), could potentially be ascribed to the plasmonic effect related to the appearance of free electrons in the MoO3 CB. In comparison with the Z1/M1 mixture, the very high amplitude of this band in the Z4/M2 combined materials (for which the M2 single oxide already contains from the starting point some Mo5+ ions in significant concentration) tends to support this hypothesis. The existence of the other two sub-bands can be then linked to the occurrence of two different polaronic transfers, associated with bulk and surface phenomena.
For illustration, using a UV-light irradiation time equal to 5 min, the K/S curve evolution in 400–2500 nm for relaxing time varying between 0 and 30 hours are represented in Fig. 16.
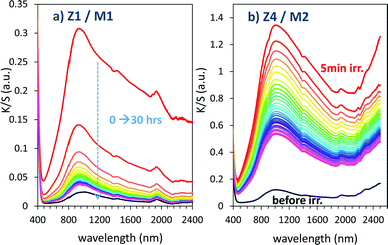 | ||
| Fig. 16 Bleaching under dark condition of the Z1/M1 and Z4/M2 mixtures previously irradiated during 5 min. | ||
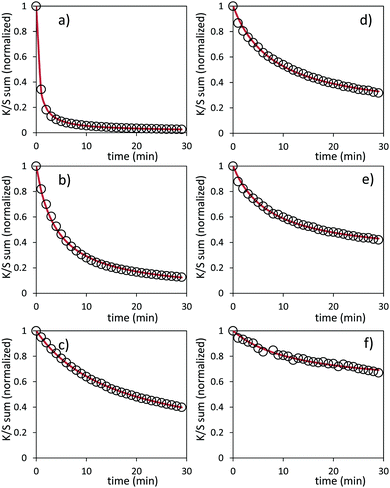
Bleaching efficiency is obtained by plotting the K/S sum evolution (after normalization for the starting point) vs. the relaxation time as it can be seen in Fig. 17.
Two key findings, never demonstrated to date in the area of inorganic photochromic compounds, were discovered in this investigation. First, a self-bleaching phenomenon is always observable; this shall pave the road towards new applications including reversible photochromic materials in displays, smart windows, smart textiles, etc. On the other hand, our study clearly evidences that the ability of the as-prepared combined materials for the self-bleaching is directly linked to (i) the colouring stage reached after irradiation, and (ii) the single compound, which are used with clear differences that can be noticed between the use of commercial single oxide of powders and the as-prepared counterparts from the polyol route. For both cases of Z/M mixtures, we have tested the self-bleaching kinetics and have evidenced that it can be well fitted using a second order decay equation vs. relaxing time t in the following way:
| K/S sum = (1 − A) + A/(1 + t/k), | (3) |
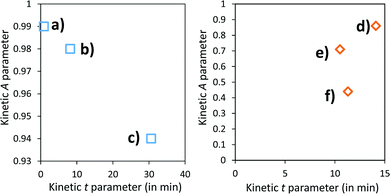
A and k parameters extracted from the fits of the self-bleaching curves are graphically compared for both Z/M mixtures in Fig. 18. For both mixtures, the A parameter decreases vs. the UV-light pre-irradiation time. This means that the deeper the blue colour reached from the UV irradiation, the less reversible the photochromic behaviour. Concerning the occurrence of a complex absorption band envelop made of several IVCTs ascribed to bulk or surface charge transfer in MoO3 oxides, it seems that long irradiation/deep colouring generates non-reversible Mo5+ species, i.e. trapped into the material bulk. From the previous colouring process investigations made on the two mixtures for which the self-bleaching properties are compared, it can be seen that an irradiation during 5 min of the Z4/M2 produced quite a similar increase in K/S absorbance compared to 60 min for the Z1/M1 combined material (Fig. 14b and 12a, respectively), thus leading to similar self-bleaching efficiency (A) and speed (k) parameters.
Accordingly, a direct correlation between the visible/near infrared absorption reached by UV-light irradiation and the self-bleaching properties, i.e. with respect to a mechanism poorly depending on single oxide parameter chemical compositions or morphologies, seems to operate in a satisfactory manner. Nevertheless, for the Z1/M1 mixture, self-bleaching efficiency (A) and self-bleaching time (k) evolve in a monotonic way: the less reversible the self-bleaching, the longer the time to self-bleach the reversible photochromic part of the material. However, for the Z4/M2 mixture such a logical correlation does not appear. Practically, the fatigue resistance of our systems will depend mainly on the intensity of the light-irradiation they received. For the Z1/M1 materials engaged in cycles with a dose of UV-light exposure below what they received in 5 min. with the UV-lamp used here, and with a time of bleaching beyond 20 min., no fatigue will occur. However, for longer exposure times, very long rest without any exposure will be necessary for a full-bleaching in order to “reinitiate” the compounds before the next cycle.
Conclusions
The huge photochromic effect for ZnO/MoO3 powder mixtures, compared with the corresponding single oxides and even other oxide/oxide or more commonly oxide/metal composite reported in the literature, was herein improved thanks to a deep understanding of the photo-redox mechanism taking place on the created Schottky barrier. Indeed, the coloring efficiency of our oxide/oxide system was increased thanks to the pre-existing electrons in the conductive band of ZnO created thanks to aliovalent doping (with aluminium III species) from a polyol synthesis route and/or the ZnO particle preparation in a reducing solvent (diethylene glycol). Furthermore, the ZnO NPs obtained without any post-annealing treatment show the best properties because of their very large surface area, which is furthermore oxygen deficient from the reducing properties of the polyol used for synthesis. The characterization of the colouring effect under irradiation as well as the self-bleaching process allowed shedding light on this complex photochromic mechanism. The coloring and bleaching efficiencies show strong interdependence, and to solve the issue regarding the deterioration of the photochromic bleaching speed and bleaching efficiency when the photochromic coloring is too much pronounced will be of a great importance in further studies to apply such materials in large scale application as smart windows or UV reversible sensors.Conflicts of interest
There are no conflicts to declare.Acknowledgements
The authors thank the CNRS, the Region Nouvelle d'Aquitaine. The PhD grant of I. Andron and internship of Lea Marichez were supported by the French National Research Agency, ANR 2016 program (ANR-16-CE08-0029).References
- M. Irie, Chem. Rev., 2000, 100, 1685–1716 CrossRef CAS
.
- O. Pieroni, A. Fissi and G. Popova, Prog. Polym. Sci., 1998, 23, 81–123 CrossRef CAS
.
- T. Kumpulainen, B. Lang, A. Rosspeintner and E. Vauthey, Chem. Rev., 2017, 117, 10826–10939 CrossRef CAS
.
- T. Tsuruoka, R. Hayakawa, K. Kobashi, K. Higashiguchi, K. Matsuda and Y. Wakayama, Nano Lett., 2016, 16, 7474–7480 CrossRef CAS
.
- S. K. Deb, Philos. Mag., 1973, 27, 801–822 CrossRef CAS
.
- J. N. Yao, K. Hashimoto and A. Fujishima, Nature, 1992, 355, 624 CrossRef CAS
.
- G. Ju, Y. Hu, L. Chen and X. Wang, J. Photochem. Photobiol., A, 2013, 251, 100–105 CrossRef CAS
.
- W. Chen, H. Shen, X. Zhu, Z. Xing and S. Zhang, Ceram. Int., 2015, 41, 12638–12643 CrossRef CAS
.
- W. Qi, H. L. Li and X. Wu, J. Phys. Chem. B, 2008, 112, 8257–8263 CrossRef CAS
.
- S. Wang, W. Fan, Z. Liu, A. Yu and X. Jiang, J. Mater. Chem. C, 2018, 6, 191–212 RSC
.
- C. G. Granqvist, Electrochromics for smart windows: Oxide-based thin films and devices, Thin Solid Films, 2014, 564, 1–38 CrossRef CAS
.
- L. Yuan, Y. Jin, D. Zhu, Z. Mu, G. Xie and Y. Hu, ACS Sustainable Chem. Eng., 2020, 8, 6543–6550 CrossRef CAS
.
- Y. Jin, Y. Hu, L. Yuan, L. Chen, H. Wu, G. Ju, H. Duan and Zhongfei Mu, J. Mater. Chem. C, 2016, 4, 6614–6625 RSC
.
- Y. Jin, Y. Hu, Y. Fu, L. Chen, G. Ju and Z. Mu, J. Mater. Chem. C, 2015, 3, 9435–9443 RSC
.
- Q. Zhang, S. Yue, H. Sun, X. Wang, X. Hao and S. An, J. Mater. Chem. C, 2017, 5, 3838–3847 RSC
.
- T. H. Fleisch and G. J. Mains, An XPS study of the UV reduction and photochromism of MoO3 and WO3, J. Chem. Phys., 1982, 76, 780–786 CrossRef CAS
.
- Y. H. Zong, J. Z. Zhao, Y. Zhao and Z. F. Huang, RSC Adv., 2016, 6, 99898–99904 RSC
.
- Y. Z. Zhang, Y. S. Huang, Y. Z. Cao, S. L. Kuai and X. F. Hu, Acta Chim. Sin., 2001, 59, 2076–2079 CAS
.
- T. C. Arnoldussen, J. Electrochem. Soc., 1976, 123, 527–531 CrossRef CAS
.
- J. Scarminio, A. Lourenço and A. Gorenstein, Thin Solid Films, 1997, 302, 66–70 CrossRef CAS
.
- M. Rouhani, J. Hobley, G. S. Subramanian, I. Y. Phang, Y. L. Foo and S. Gorelik, Solar Energy Mater. Solar Cells, 2014, 126, 26–35 CrossRef CAS
.
- N. Li, Y. Li, G. Sun, Y. Zhou, S. Ji, H. Yao, X. Cao, S. Bao and P. Jin, Nanoscale, 2017, 9, 8298–8304 RSC
.
- C. Nico, T. Monteiro and M. P. F. Graça, Prog. Mater. Sci., 2016, 80, 1–37 CrossRef CAS
.
- L. Pan, Y. Wang, X. Wang, H. Qu, J. Zhao, Y. Li and A. Gavrilyuk, Phys. Chem. Chem. Phys., 2014, 16, 20828–20833 RSC
.
- R. J. Colton, A. M. Guzman and J. W. Rabalais, Acc. Chem. Res., 1978, 11, 170–176 CrossRef CAS
.
- S. Nishio and M. Kakihana, Chem. Mater., 2002, 14, 3730–3733 CrossRef CAS
.
- K. Bange, Solar Energy Mater. Solar Cells, 1999, 58, 1–131 CrossRef CAS
.
- S. Cong, F. Geng and Z. Zhao, Adv. Mater., 2016, 28, 10518–10528 CrossRef CAS
.
- J. Scarminio, Solar Energy Mater. Solar Cells, 2003, 79, 357–368 CrossRef CAS
.
- S. Wang, W. Fan, Z. Liu, A. Yu and X. Jiang, J. Mater. Chem. C, 2018, 6, 191–212 RSC
.
- T. He and J. Yao, J. Mater. Chem., 2007, 17, 4547 RSC
.
- J. Wei, X. Jiao, T. Wang and D. Chen, J. Mater. Chem. C, 2015, 3, 7597–7603 RSC
.
- J. Wei, X. Jiao, T. Wang and D. Chen, ACS Appl. Mater. Interfaces, 2016, 8, 29713–29720 CrossRef CAS
.
- A. I. Gavrilyuk, Electrochim. Acta, 1999, 44, 3027–3037 CrossRef CAS
.
- J. Besnadadiere, B. Ma, A. Torres-Pardo, G. Wallez, H. Kabbour, J. M. Gonzalez-Calbet, H. J. Von bardeleben, B. Fleury, V. Buissette, C. Sanchez, T. Le Mercier, S. Cassaignon and D. Portehault, Nat. Commun., 2019, 10, 327 CrossRef
.
- M. Bourdin, I. Mjejri, A. Rougier, C. Labrugère, T. Cardinal, Y. Messaddeq and M. Gaudon, J. Alloys Compd., 2020, 823, 153690 CrossRef CAS
.
- I. Andron, L. Marichez, V. Jubera, M. Duttine, C. Frayret and M. Gaudon, ACS Appl. Surf. Interfaces, 2020, 12, 46972–46980 CrossRef CAS
.
- I. Trenque, S. Mornet, E. Duguet and M. Gaudon, Mater. Res. Bull., 2013, 48, 1155–1159 CrossRef CAS
.
- I. Trenque, M. Gaudon, E. Duguet and S. Mornet, Inorg. Chem., 2013, 52, 12811–12817 CrossRef CAS
.
- M. Bourdin, M. Gaudon, F. Weill, M. Duttine, M. Gayot, Y. Messaddeq and T. Cardinal, Nanomaterials, 2019, 11, 1555 CrossRef
.
- V. Srikant and D. R. Clarke, J. Appl. Phys., 1998, 83, 5447–5451 CrossRef CAS
.
- M. Gaudon, O. Toulemonde and A. Demourgues, Inorg. Chem., 2007, 46, 10996–11002 CrossRef CAS
.
| This journal is © The Royal Society of Chemistry 2021 |

