
 Open Access Article
 This Open Access Article is licensed under a
 Creative Commons Attribution 3.0 Unported Licence
Analysing trimethylaluminum infiltration into polymer brushes using a scalable area selective vapor phase process†
M.
Snelgrove
 *a,
C.
McFeely
a,
K.
Shiel
a,
G.
Hughes
ab,
P.
Yadav
c,
C.
Weiland
d,
J. C.
Woicik
d,
P. G.
Mani-Gonzalez
e,
R.
Lundy
c,
M. A.
Morris
c,
E.
McGlynn
ab and
R.
O’Connor
af
*a,
C.
McFeely
a,
K.
Shiel
a,
G.
Hughes
ab,
P.
Yadav
c,
C.
Weiland
d,
J. C.
Woicik
d,
P. G.
Mani-Gonzalez
e,
R.
Lundy
c,
M. A.
Morris
c,
E.
McGlynn
ab and
R.
O’Connor
af
aSchool of Physical Sciences, Dublin City University, Dublin 9, Ireland. E-mail: matthew.snelgrove2@mail.dcu.ie
bNational Centre for Plasma Science and Technology, Dublin City University, Glasnevin, Dublin 9, Ireland
cAMBER Research Centre and School of Chemistry, Trinity College Dublin, Dublin 2, Ireland
dMaterials Measurement Science Division, Material Measurement Laboratory, National Institute of Standards and Technology, Gaithersburg, Maryland 20899, USA
eInstitute of Engineering and Technology, Department of Physics and Mathematics, Autonomous University of Ciudad Juárez, Cd. Juárez, Chihuahua 32310, Mexico
fAdvanced Processing Technology Centre, Dublin City University, Dublin 9, Ireland
First published on 18th December 2020
Abstract
Developing vapor phase infiltration (VPI) processes for area selective polymer nanopatterning requires substantial advancement in understanding precursor infiltration, precursor–polymer interaction and process parameters. In this work, infiltration receptive poly(2-vinylpyridine) (P2VP) and poly(4-vinylpyridine) (P4VP) brushes were exposed to a trimethylaluminum (TMA) VPI process and compared to a non-receptive polystyrene (PS) system. The interaction that takes place between TMA and P2VP/P4VP was analysed in detail and we report on notable advantages in the use of P4VP, arising from the difference in position of the pyridinic nitrogen. The VPI process was performed in a commercial atomic layer deposition reactor and the effects of the fundamental process parameters on the three polymer brushes were investigated to ensure optimal area selectivity. In situ X-ray photoelectron spectroscopy (XPS) measurements were supported by grazing angle Fourier transform infrared spectroscopy (GA-FTIR) and hard X-ray photoelectron spectroscopy (HAXPES). The report identifies several important factors when developing a VPI process to ensure area selectivity, while also demonstrating the use of novel pyridine containing polymers for VPI area selective purposes.
Introduction
Conventional atomic layer deposition (ALD) allows for the growth of coherent thin films, achieved by exposing a functionalised substrate to a sequence commonly simplified into four self-limiting steps; (1) precursor dose, (2) precursor purge, (3) co-reactant dose and (4) co-reactant purge. These stages repeat a selected number of times thus allowing for a thin film to be grown layer by layer with angstrom-level thickness control. The functionality and versatility of this technique has led to its incorporation into fields such as microelectronics, photovoltaics and energy storage.1–4 Recently, nanopatterning via area-selective ALD has attracted substantial interest as a route to achieving bottom-up fabrication of nanoelectronic components in the semiconductor industry.2,5 The goal of such a process is to achieve patterned films, grown from the bottom up, rather than relying on traditional top-down architectures which are underpinned by increasingly complex and expensive optical lithography. This can be achieved through several technical methods, involving the area activation and deactivation of different regions across a surface to promote or inhibit precursor interaction with the substrate, respectively. It is envisioned that these processes will have a crucial role to play in overcoming the technological and economic issues that are currently seen as potential roadblocks in the lithography sector of the semiconductor industry.6,7Area-selective nanopatterning through the selective reaction and infiltration of patterned polymer films is a growing field of research, enabled through area selective grafting of polymer brushes to substrates – or through block copolymer (BCP) patterning.8–11 The process involves the use of active polymers as an infiltration media for metal interaction, alongside inactive polymers that undergo minimal interaction when exposed to the metal precursor. Precursor exposure and subsequent polymer infiltration/rejection can be achieved using precursors in either liquid or vapor phase, the latter of which is employed in the case of area selective ALD. Once this exposure step is completed, the polymer film can be easily removed with an oxidizing process, leaving a patterned metal oxide, located in the regions where only the active polymer was present.
The use of polymers in area selective ALD allows for the potential to develop nano-patterned, conformal films, with thickness and composition of the resulting oxide layer controlled by the ALD process parameters, in addition to the polymer fabrication parameters. Conventional ALD-like processes have been used to study the effect of precursor interaction with polymer films,12,13 although alternative techniques with similarity to ALD have emerged, with vapor phase infiltration (VPI) being a promising technique in achieving successful, area-selective infiltration and rejection of metal precursors into certain polymer materials.14
VPI has been defined as a process designed to maximise the sorption, infiltration and entrapment of a precursor into an active polymer film.15 The process has similarities to ALD, and is compatible with typical commercial ALD reactors which are already employed in large-scale processing. Both VPI and ALD require the use of chemical precursors that are introduced to a reaction chamber (under rough vacuum) containing a sample, with which the precursor reacts if the chemistry between precursor and sample is compatible. The differences between the two techniques arise at this point – whereas ALD is focused on the deposition of a material atop the sample, VPI is concerned with the infiltration of that material into the sample. A ‘typical’ VPI process involves the exposure of a material, usually heated, to several ALD-like cycles. One VPI cycle consists of the following: (1) a designated amount of precursor enters the chamber. This step is referred to as the dose step and can be controlled by carrier gas flow (N2 or Ar), chamber pressure, precursor temperature and the time the precursor valve is open (dose time). (2) After the dose step the chamber is immediately placed under static vacuum (hold step) for a period ranging from seconds to tens of minutes (hold time). Static vacuum is achieved by ceasing pumping, with the goal of maximising precursor – sample interaction. (3) The chamber is then purged (purge step), and the cycle can commence again. A co-reactant is often used in such a process, meaning the addition of (4) a co-reactant dose step, (5) a co-reactant hold step and (6) a co reactant purge. Various alterations to this cycle sequence has resulted in VPI being sub categorised further into semi-static-mode/flow-mode sequential infiltration synthesis (SIS), multiple pulsed infiltration (MPI), and sequential vapor infiltration (SVI). Semi-static-mode SIS includes a precursor and co-reactant hold and purge step, with the chamber fully evacuated and then purged after each hold step.16 Flow-mode SIS and MPI employ a similar procedure, however the chamber is not fully evacuated after each hold step.17,18 SVI consists of several consecutively occurring precursor dose, hold, and purge steps. This is followed by a similar sequence but for the co-reactant.19 It should be noted that the addition of the co-reactant is, in an ideal case, not necessary, as unlike in conventional ALD, the precursor should react with the polymer film without the need for the addition of a co-reactant. The work discussed here demonstrates that the addition of a co-reactant results in more metal–organic incorporation, but also undesired metal growth on regions where no infiltration/deposition is desired.
Identifying, processing, and studying polymers that not only exhibit favourable area selective deposition (ASD) and BCP characteristics, but also are receptive to VPI processes, is an active field of materials research. A detailed analysis of such an approach for three types of covalently tethered polymer brushes (hydroxyl functionalised) is presented in this work: poly-2-vinyl pyridine (P2VP), poly-4-vinyl pyridine (P4VP) and polystyrene (PS). PS systems are well established for achieving area deactivation to prevent material growth in ASD/BCP processes in ALD and other infiltration methods.16,20,21 Thorough discussion of the practicalities of pyridine based polymers as infiltration media are described elsewhere,21–26 however, to summarize, both P2VP and P4VP have favourable characteristics for use as area activation media in ASD and BCP lithography. Due to the nitrogen lone pair located in the pyridine ring (Fig. 1a), both poly-vinyl pyridines (PVPs) can facilitate metal coordination bonding.27 Additional reactions such as protonation and quaternisation can also occur, providing a number of possible routes by which the material can facilitate infiltration.28–30 When placed in BCP formations with PS (P2VP-b-PS, P4VP-b-PS), both PVPs showcase the capability of patterning at sub 10 nm dimensions.31 The position of the nitrogen contained in the pyridine ring is a critical aspect of PVPs, with the geometry of P4VP more suited to facilitating chemical interactions due to the position of the nitrogen in relation to the polymer backbone.32 The proximity of the N in P2VP can result in steric hindrance, preventing optimal interaction conditions between a metal and P2VP.33
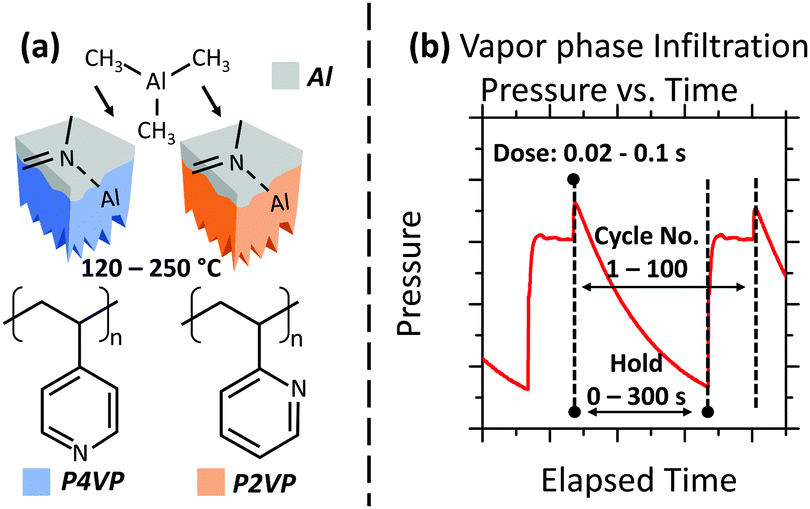 | ||
| Fig. 1 (a) Schematic of the experimental process. Infiltration receptive P2VP and P4VP brushes are exposed to a VPI process. A PS brush (not shown) is also used to demonstrate its role as a blocker film. The VPI processing takes place with a temperature range of 120–250 °C. (b) Pressure versus time plot for a VPI process, showing the different stages under analysis along with the values used. | ||
Selective infiltration of polymers in ASD/BCP orientations through VPI has been successfully demonstrated to achieve patterned metal oxides, such as ZnO, Al2O3 and TiO2.34–37 The potential of the technique has resulted in a large body of literature covering different processes that use a varied range of polymers, chemical precursors and deposition techniques.38–40 This study aims to develop this understanding further by discussing the parameters in an industrial scalable VPI process in order to achieve good area selectivity – maximum precursor interaction with the PVPs, and minimum interaction with the PS. The VPI process implemented is unique as the polymer films and resulting oxides are of a thickness required in the semiconductor industry for e.g. gate dielectrics in CMOS processing. The effect of precursor dose time, polymer saturation and precursor hold time (Fig. 1b), as well as polymer temperature are reported. VPI processing was performed in a commercial ALD system. Analysis was completed via the use of in situ X-ray photoelectron spectroscopy (XPS). The XPS and ALD systems are connected in vacuum via a fast-transfer robotic handler, allowing for XPS analysis of processed films within seconds and without atmospheric exposure. Grazing angle Fourier transform infrared spectroscopy (GA-FTIR) and hard X-ray photoelectron spectroscopy (HAXPES) were performed ex situ to provide complementary data concerning the infiltration mechanism of TMA into pyridine, and the analysis of the resulting alumina films post oxygen plasma, respectively. Trimethylaluminum (TMA) was chosen as the precursor for the fabrication of alumina films from the pyridine samples. Alumina is a relevant material in the semiconductor industry, being a high-dielectric constant (high-k) material and also serving as a diffusion barrier with good thermal stability.41,42 Unlike the well documented process of TMA infiltration into polymethyl methacrylate (PMMA) through VPI techniques,17,43 an understanding of the chemical reaction between P2VP/P4VP and the infiltrating TMA through VPI exposure is currently lacking. This work proposes reaction mechanisms that occur in these polymer films. Additionally, the difference in structure between P2VP and P4VP is observed to have a direct effect on the TMA reaction rate.
Experimental details
Material preparation
Hydroxy terminated poly-2-vinyl pyridine (P2VP) (P41306-2VP) (PDI: 1.04), poly-4-vinyl pyridine (P4VP) (P9755-4VP-OH) (PDI: 1.28) and polystyrene (PS) (P9405-S) (PDI: 1.03) powders were purchased from Polymer Source (Canada) and used without further modification. The molecular weights of the P2VP, P4VP and PS were 6 kg mol−1, 5, kg mol−1 and 6 kg mol−1 respectively. Samples were prepared as outlined in the work published by R. Lundy and P. Yadav et al. and summarized here.21 Native oxide silicon substrates were placed in a tetrahydrofuran (THF) bath and ultrasonicated for 20 minutes before being oxygen plasma treated for –OH group termination. The polymer powders were dissolved into a solution (THF for P2VP and P4VP, toluene for PS) of 0.2 wt% by stirring at room temperature overnight. The solution was then spin coated onto the –OH terminated Si (room temperature, 3000 rpm) for 30 s. Samples were then annealed for 2 minutes at 230 °C. To remove ungrafted polymer material after the anneal, samples were placed in solution as before and ultrasonicated in two sets of 20 minutes. Ellipsometry measurements (Woollam XLS-100) revealed that the P2VP and PS had thicknesses of approximately 5.0 nm, while the P4VP thickness was approximately 4 nm. The three polymers were exposed to all subsequent processing steps concurrently.In situ VPI, plasma processing and XPS
VPI processing and XPS analysis was performed in a custom designed Oxford Instruments FlexAl ALD system (base pressure 5 × 10⁻⁵ Pa), which was coupled in-vacuum by a fast-transfer robotic handler to a Scienta Omicron XPS (monochromatic Al Kα X-ray source, base pressure 6.5 × 10⁻⁷ Pa) with a 128 channel Argus CU detector. Transfer time between chambers is approximately 1 minute. This setup allowed for photoemission analysis to be performed on VPI processed samples without the need for the sample to break vacuum.Several parameters were investigated to observe the effect of infiltration into the PVP and PS brushes;
Dose time: The effect of whether longer dose time increases polymer – precursor interaction was investigated.
VPI cycles: In order to analyse whether there is a polymer saturation point – in which Al growth ceases – the number of cycles in the process was varied.
Hold time: The effect of whether longer hold time increases polymer – precursor interaction was investigated.
Substrate temperature: The effect that polymer temperature had on the VPI process was considered.
It is important to note that, unlike in conventional ALD, all experiments outlined in the results section did not include a co-reactant, with the notable exception of experiment 5, where the effect of adding the oxidant, H2O, into the process was investigated.
Prior to entering the ALD chamber, each sample was cleaved to approximately 2 cm2 and then exposed to compressed N2 to remove dust particles. The coupons were then placed on a 100 mm diameter steel carrier-wafer for ALD/XPS loading. Each batch of samples loaded for VPI processing were initially analysed by XPS to ensure film consistency.
The infiltration process used represents a combination of VPI techniques, edited to ensure that the process was compatible with the industry-scalable tool used for the experiment. Prior to each VPI process, samples were heated for 20 minutes at the desired substrate temperature, with the chamber under flow of 200 SCCM of Ar gas to ensure good thermal conductivity. The substrate temperature was kept within the desired range for TMA deposition as outlined by the manufacture for the FlexAl (120–400 °C) to prevent unwanted precursor decomposition/condensation. The substrate temperature was additionally kept below the polymer degradation temperature (P2VP ≈ 320 °C, P4VP ≈ 290 °C, PS ≈ 260 °C).21 All depositions (with the exception of P4VP in part of experiment 4) took place above the bulk glass transition temperature (Tg) of the polymers (P2VP ≈ 100 °C, P4VP ≈ 150 °C, PS ≈ 100 °C).51,52 The chamber was kept pumped in such a way that the pressure was maintained at 26.7 Pa (200 mTorr) for this stage. The cyclic VPI process then began. TMA was admitted to the chamber for a designated dose time. Ar (200 SCCM) was used as the precursor carrier gas. The chamber was then isolated from pumping. This involved the automatic closing of the valve used to regulate the pressure in the ALD chamber, which is located between the reactor chamber and pumps. It should be noted that when in the closed position, this valve does not provide a perfect vacuum seal between the chamber and pumps, and therefore a gradual decrease in chamber pressure during the hold step was observed. Once the predetermined hold time had passed, the chamber was exposed to vacuum pumping again and purged by Ar gas (200 SCCM) for 20 s. An example of a typical chamber pressure versus time relationship for the process is shown in Fig. 2.
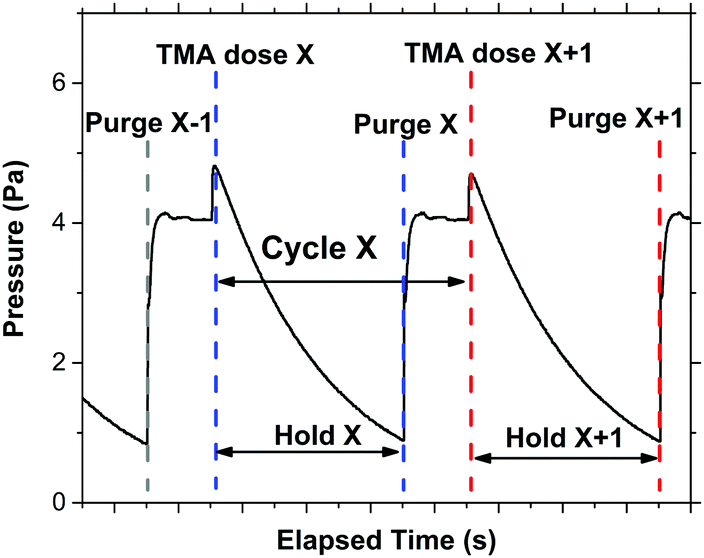 | ||
| Fig. 2 A typical pressure versus time graph for one of the many VPI processes implemented through the experiment. For this process, a single cycle consists of a TMA dose of 0.02 s duration, followed by a 60 s hold time. A 20 s purge completes the cycle. | ||
An oxygen plasma was used to remove the polymer and convert the infiltrated TMA into alumina. This was achieved by using an inductively coupled plasma source. Samples were heated to 200 °C with the chamber being constantly flushed with a 200 SCCM flow of Ar. After 10 minutes, the Ar flow ceased, and the samples were exposed to a 15 minute, 300 W oxygen plasma. The flow of O2 was 100 SCCM, and the pressure during the plasma process was 5.3 Pa.
Analysis of all XPS data was performed using the software, Aanalyzer.53 Prior to fitting, all data was shifted so that the Si0 2p3/2 signal occurred at 99.4 eV binding energy (BE) unless otherwise stated.54 All XPS core level fits implemented a Shirley-Sherwood type background. In addition, all fits used a combination of Gaussian and Lorentzian values (Voigt curve), displayed in Table 1. The Lorentzian value was, where possible, carefully referenced for each core level. All spectra counts were converted to counts per second (cts s−1) to ensure consistency. Atomic sensitivity factors were obtained from Wagner et al.55 and used for estimations of surface stoichiometry.
| Core level peak | Chemical environment | hv (eV) | Spin orbit splitting (eV) | Gaussian (eV) | Lorentzian (eV) |
|---|---|---|---|---|---|
| Si 2p | Si0/Si4+ | 1486.7 | 0.6 | 0.50/1.26 | 0.1144,45 |
| C 1s | P4VP/P2VP/PS | 1486.7 | — | 0.79/0.76/0.70 | 0.1746,47 |
| N 1s | P4VP/P2VP | 1486.7 | — | 0.86 | 0.2848 |
| O 1s | All | 1486.7 | — | 1.32 | 0.2549 |
| Al 2p | All | 1486.7 | 0.4 | — | — |
| Si 2p | Si0/Si4+ | 3008 | 0.6 | 0.40/1.28 | 0.1044,45 |
| C 1s | P4VP/P2VP/PS | 3008 | — | — | — |
| N 1s | P4VP/P2VP | 3008 | — | — | — |
| O 1s | All | 3008 | — | 1.18 | 0.2549 |
| Al 2p | All | 3008 | 0.4 | — | — |
| Al 1s | All | 3008 | — | 1.7 | 0.3350 |
Ex situ GA-FTIR, HAXPES and AFM
GA-FTIR was performed using a Nicolet iS50 FTIR Spectrometer with a Harrick VariGATR attachment. Prior to sample analysis the germanium crystal was cleaned using butanone to remove any dust from its surface. A background of the atmosphere was then taken. Each sample was placed face down on the crystal and a force of approximately 600 N was applied to the sample to ensure sufficient sample-crystal contact. The sample was scanned at an unpolarised angle of incidence of 65° for a total of 128 scans at 8 cm−1 resolution.HAXPES measurements were performed at the National Institute of Standards and Technology beamline 7-ID-2, located at the National Synchrotron Light Source II, Brookhaven, New York (NSLS-II) to accurately assess the quality of the alumina films created post plasma processing. Unlike in conventional XPS, where the incident X-rays are limited to fixed photon energies, HAXPES makes use of a tuneable photon energy source that allows for the acquisition of higher binding energy core levels. In addition, a higher photon energy increases the analysis depth beyond conventional XPS, with HAXPES measurements generally containing better signal to noise and resolution, further eliminating ambiguity in the measurement. Samples were placed at 45° from the analyser normal and a photon energy of 3008 eV was used for all measurements, allowing for the acquisition of the Al 1s. Acquiring the Al 1s eliminates the need to analyse the Al 2p, which is difficult to study accurately due to the small spin orbit splitting value of approximately 0.4 eV, and the low sensitivity factors associated with it.55,56
Atomic force microscopy (AFM) was performed using a Bruker Dimension ICON AFM. Scans of 2 μm2 were obtained using a tapping mode cantilever (Tap300Al-G, force constant = 40 N m−1, resonant frequency = 300 kHz).
Results
Photoemission
The basic parameters for the VPI process in experiment 1 are shown in Table 2. Two dose times were selected. The shorter time (0.02 s) was selected as it was recommended by the ALD system manufacturer as the optimal dose time for a thermal Al2O3 ALD recipe using TMA, with the second dose selected as 0.1 s. Estimations for the total partial pressure of TMA admitted to the reactor were obtained by noting the change in pressure of the chamber immediately before (carrier/purge gas present only) and during (carrier gas + TMA) the dose step. Approximately 0.7 Pa and 5.2 Pa of TMA was permitted into the chamber for the 0.02 s and 0.1 s dose times, respectively.
| Experiment | 1 | 2 | 3 | 4 | 5 | ||||||
|---|---|---|---|---|---|---|---|---|---|---|---|
| Dep. temp. (°C) | 200 | 200 | 200 | 200 | 200 | 200 | 200 | 120 | 200 | 250 | 200 |
| Hold step (s) | 60 | 60 | 60 | 0 | 60 | 120 | 300 | 60* | 60* | 60* | 0 |
| Cycles | 20 | 20 | 1–100 | 2* | 2* | 2* | 2* | 80* | 80* | 80* | 80 |
| Dose time (s) | 0.02 | 0.1 | 0.02* | 0.02* | 0.02* | 0.02* | 0.02* | 0.02* | 0.02* | 0.02* | 0.02 |
| P2VP selectivity, SP2VP | 0.61 | 0.61 | 0.47–0.64 | 0.07 | 0.28 | 0.37 | 0.06 | 0.50 | 0.59 | 0.40 | 0.04 |
| P4VP selectivity, SP4VP | 0.63 | 0.61 | 0.61–0.61 | 0.44 | 0.51 | 0.59 | 0.05 | 0.51 | 0.52 | 0.42 | −0.10 |
To assess the level of aluminium incorporation into, or on the polymer film, the aluminium 2p intensity (area under the curve) from XPS scans for each polymer was considered. The Al 2p spectra are presented in Fig. 3. Despite increasing the dose time by an order of magnitude, little difference in aluminium intensity is observed between the two dose times for each polymer. It is therefore preferable to use the lower dose time to avoid wastage. The superior reactivity that the PVP brushes have with TMA compared to the PS brush is visible here, however it is important to note that both PVPs contain similar amounts of aluminium despite the P2VP being approximately 1 nm thicker.
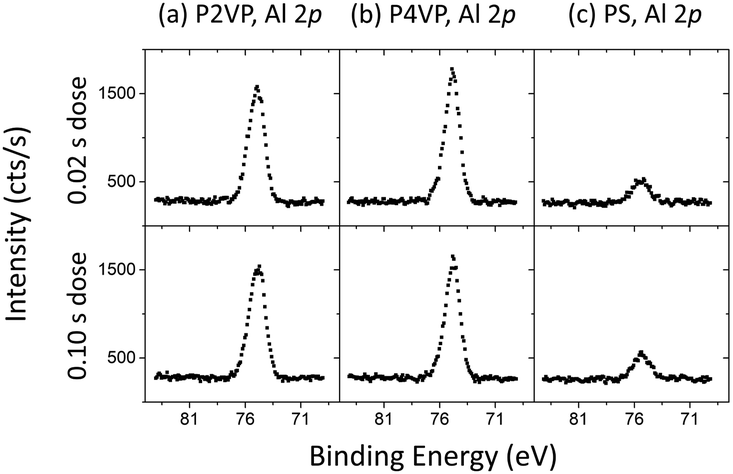 | ||
| Fig. 3 Al 2p for (a) P2VP, (b) P4VP and (c) PS post two VPI processes that implemented a different dose time (0.02 s and 0.1 s). The large increase in dose time reveals no significant change in aluminium incorporation into any of the polymers. | ||
The XPS spectra of the C 1s before and after the two different VPI processes (of 0.02 s and 0.10 s TMA doses) are shown in Fig. 4. The spectra for the polymers pre-VPI processing were fitted using the work by Beamson and Briggs as a ref. 57. The spectra have been charge-referenced so that the carbon backbone signal occurs at the same position as the reference. The bonding diagrams for the three polymers are shown, and the components in each fit associated with the different bonds in each diagram are labelled.
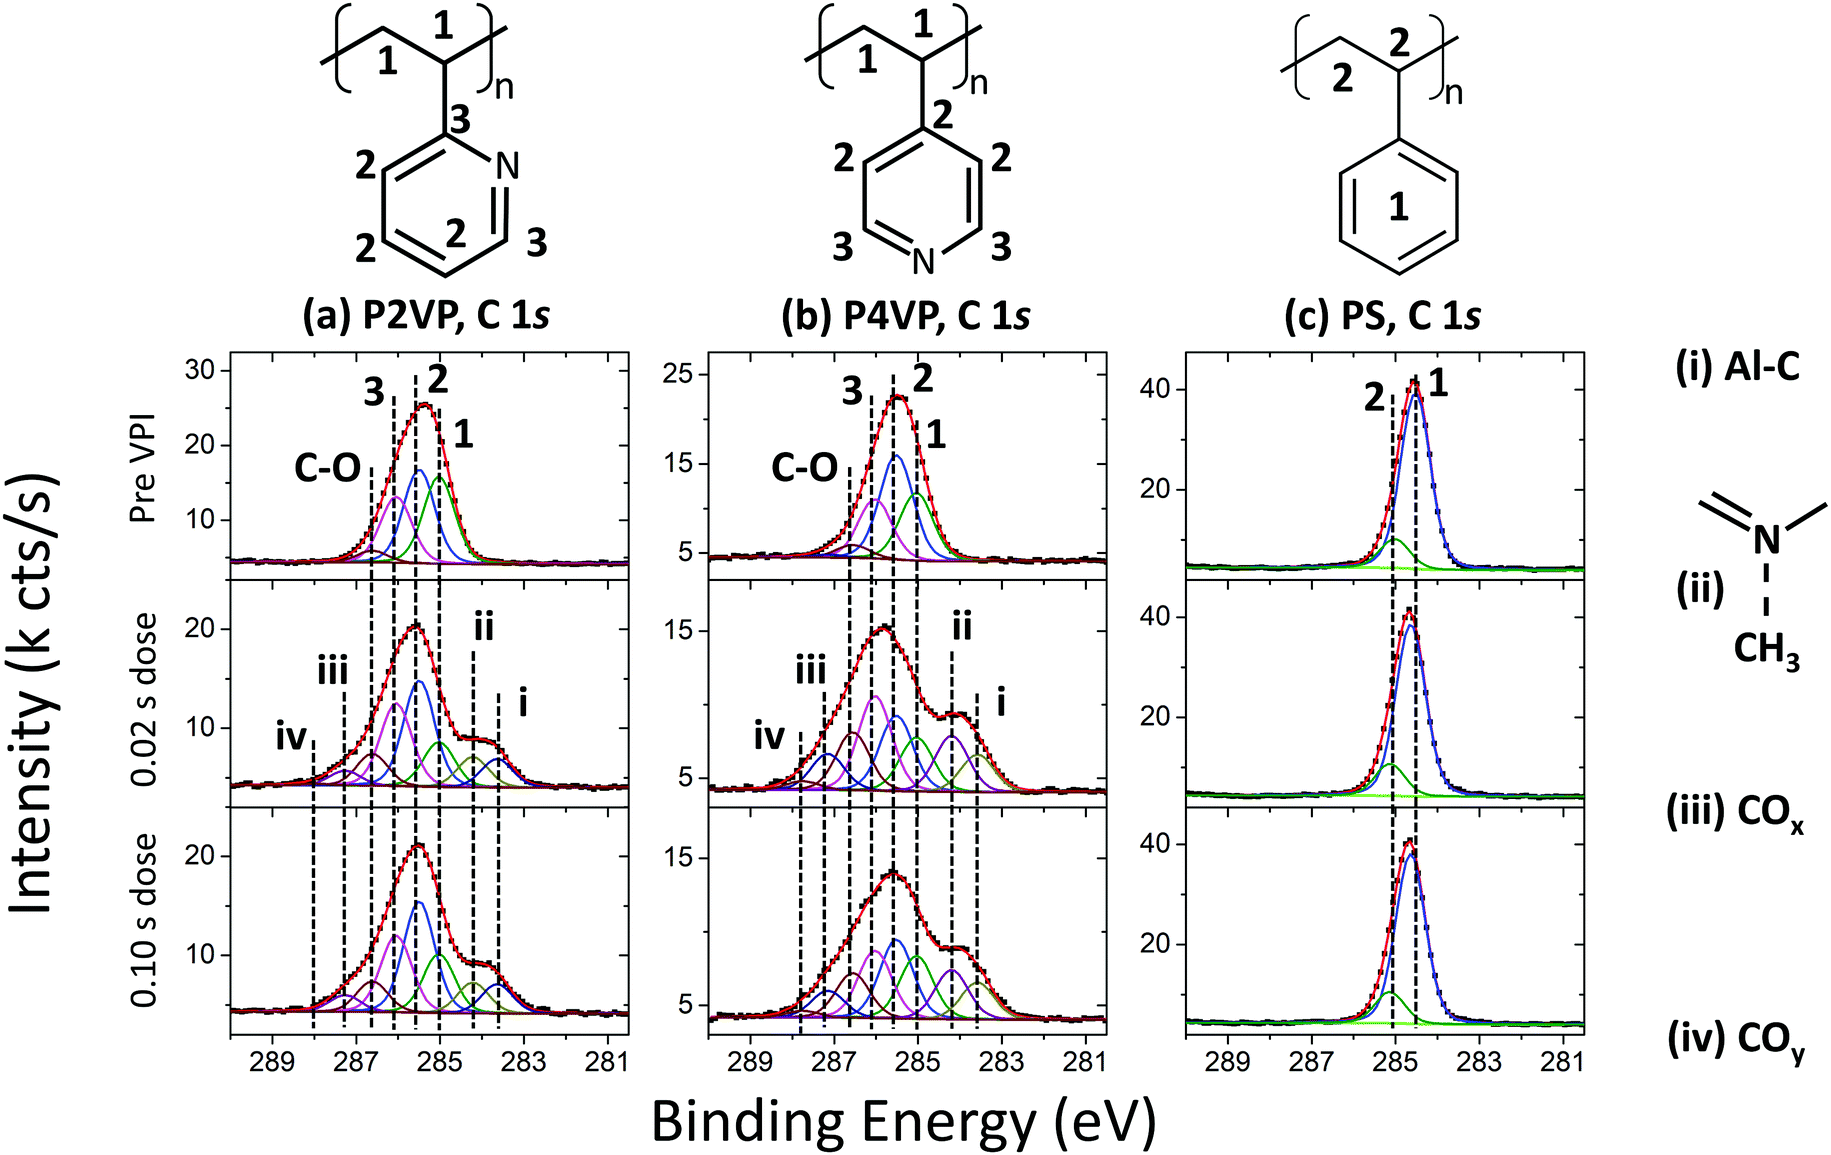 | ||
| Fig. 4 C 1s spectra of (a) P2VP, (b) P4VP and (c) PS pre VPI and post the two different dose time processes. | ||
The as-loaded P2VP C 1s spectrum in Fig. 4a is comprised of a carbon backbone signal at 285.0 eV, and two components located at 285.5 eV and 286.0 eV, attributed to carbon in the pyridine ring. An additional peak at 286.6 eV is associated with C–O bonding.49 This signal arises from the interface between the polymer and the SiO2 layers, as well as from polymer–ambient interaction resulting from adventitious carbon. The two post-VPI spectra alter from the original polymer in similar fashion, which is to be expected as both dose times yield approximately the same Al 2p signal intensity. Two high Binding energy (BE) components at 287.3 eV (iii) and 287.9 eV (iv) are associated with carbon in a higher oxidation state, showing that the film is incorporating residual oxygen during the process. The most significant change in the spectra however is the development of two lower binding energy components, located at 284.2 eV (ii) and 283.6 eV (i). Metal carbide signals are typically observed at ∼283 eV,58,59 and thus the peak at 283.6 eV can be attributed to Al–C bonds. This arises from TMA that has interacted with the polymer, but not fully decomposed. The peak at 284.2 eV is associated with CH3 interacting with the pyridinic N and is discussed in more detail in the discussion of the N 1s peak (Fig. 5).
 | ||
| Fig. 5 N 1s spectra of a P2VP (a) and P4VP (b) reference sample (pre VPI) and after a 0.02 s and 0.10 s TMA dose time VPI process. The schematics below the spectra show proposed reactions occurring during the VPI process (for P4VP). | ||
The P4VP (Fig. 4b) carbon backbone signal is located at 285.0 eV BE. Two signals attributed to the pyridine ring are located at 285.5 eV and 286.0 eV. There is evidence of C–O bonding at 286.5 eV, as was also observed for P2VP. The composition of the spectrum following VPI is consistent with that from P2VP – two C–O related peaks grow, located at 287.1 eV (iii) and 287.7 eV (iv). The two low BE components are required to ensure a good fit to the data, at 284.2 eV (ii) and 283.6 eV (i). The former is attributed to CH3–N interaction and the latter to Al–C as in the P2VP spectra.
The PS (Fig. 4c) has two main components, the carbon backbone signal at 285.0 eV, and the carbon signal arising from the phenyl ring, at 284.5 eV.60 The spectrum undergoes no significant change after VPI processing, showing that the aluminium has not chemically bonded with the polymer.
The C 1s spectra reveal several important mechanisms when the polymer brushes are exposed to TMA. The PS sample was observed to contain a small amount of Al after VPI as shown in Fig. 3, however, PS-TMA chemical interaction does not appear to take place, as the C 1s spectra pre- and post-VPI are identical. For the pyridines, the impact of oxidation may be the cause of the unexplained growth in component 3 of the fit in Fig. 4a and b. Critically, in the case of both pyridine films, evidence of C–Al bonding show that the TMA precursor has not fully decomposed during this VPI process. As the molecule TMA consists of Al–CH3 bonds, full precursor decomposition would have no Al–C bonding visible.
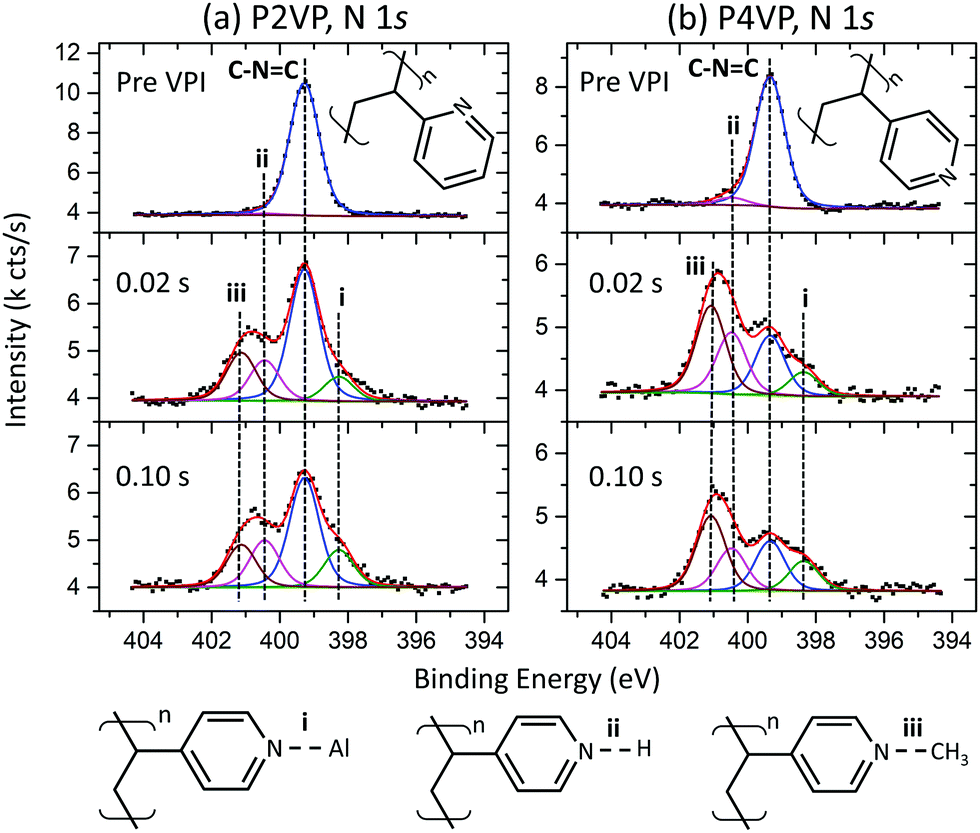
Fig. 5a and b show the P2VP and P4VP N 1s spectra respectively, pre- and post-the 0.02 s and 0.10 s TMA doses. The N 1s peak associated with the P2VP film (Fig. 5a) is comprised solely of a peak at 400.0 eV, which is associated with the nitrogen in the pyridine ring. Gaussian and Lorentzian values for the N 1s were left free for this fit, with the resulting Lorentzian of 0.28 eV, agreeing with literature.48 The pyridine-associated peak also occurs at 400.0 eV for the P4VP spectra in Fig. 5b. The C–N![[double bond, length as m-dash]](https://www.rsc.org/images/entities/char_e001.gif) C peak in both pyridines is reported to occur at 399.3 eV,57 and a shift of −0.7 eV BE was applied to both spectra so that the C–NC peak corresponds to this position. The total intensity of the pre-VPI P2VP N 1s is slightly greater in intensity than the P4VP, which is attributed to the higher film thickness observed in the P2VP from the ellipsometry measurements.
C peak in both pyridines is reported to occur at 399.3 eV,57 and a shift of −0.7 eV BE was applied to both spectra so that the C–NC peak corresponds to this position. The total intensity of the pre-VPI P2VP N 1s is slightly greater in intensity than the P4VP, which is attributed to the higher film thickness observed in the P2VP from the ellipsometry measurements.
For both PVPs, the spectra for the post-VPI processes show that no significant differences occur between the two different precursor dose times. This strengthens the conclusions drawn from Fig. 3, that increasing dose time does not affect the rate of Al uptake or polymer interaction with the TMA. Both PVPs contain a component at 398.3 eV (i), and two components at a higher BE than pyridine, occurring at 400.4 eV (ii) and approximately 401.1 eV (iii). Peak (i), occurring at a lower BE than the C–NC signal, is attributed to Al–N bonding, reported by P. G. Mani-Gonzalez et al. and others.50,61–63 Peak (ii) is unique in that it occurs in the pre VPI pyridines as well. This peak has been assigned previously as pyrrolic nitrogen (C–NH–C). However, the significant growth of this component post VPI suggests that this component is directly related to the VPI process, as pyrrolic nitrogen growth is not expected here. The component may represent the protonation of pyridinic nitrogen (C–N+HC), which has been reported to occur at a higher BE than C–NC,30 with the resulting high temperature exposure to TMA leading to an increase in this component. Peak (iii) is not observed pre VPI, and the peak is attributed to the quaternisation of the pyridine through CH interaction (CN+CHx–C), provided through precursor exposure. By considering this case, P4VP is observed to be more readily quaternized, with the N reacting at a much higher rate than the P2VP. This is consistent with steric hinderance of the lone pair in P2VP owing to the proximity that the N has to the carbon backbone, when compared to P4VP.
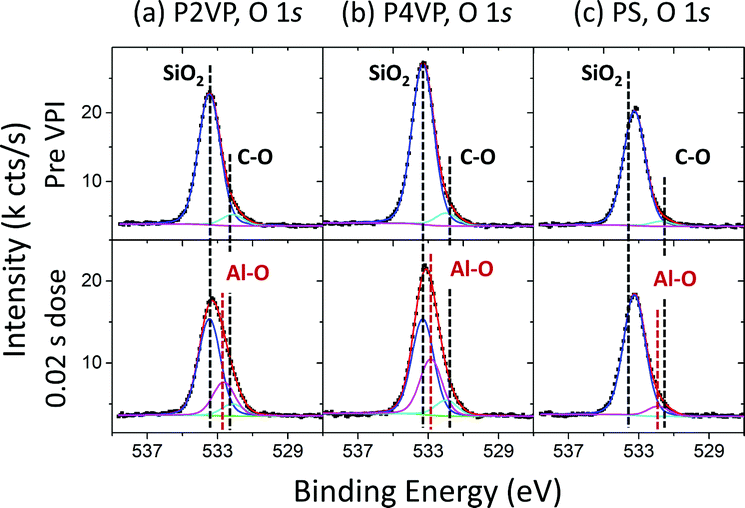
O 1s spectra for the polymers pre and post the 0.02 s TMA dose are shown in Fig. 6. Pre VPI, all spectra are dominated by an SiO2 associated peak at approximately 533.3 eV.64,65 A second peak at 532.1 eV, 532.0 eV and 531.7 eV in the P2VP, P4VP and PS spectra respectively is associated with C–O bonding as observed in the C 1s spectra in Fig. 4, within the expected BE range.57 Post VPI, accurately fitting the data results in the necessity of an additional, third component, located at 532.6 eV, 532.8 eV and 531.9 eV for the P2VP, P4VP and PS respectively. This addition is associated with Al–O bonding, showing that the Al incorporated in the polymer is partially oxidising due to the residual oxygen in the process chamber. The BE position for the Al associated peaks for the pyridine is at a higher value than one would expect for Al3+,66 expected due to the oxygen deficient environment in which the process is taking place. The Al associated signal is insignificant in the PS sample (as expected, in line with Fig. 3), with the lower BE position suggesting the Al on/within the PS is in a higher oxidation state compared to the pyridines. Unlike the SiO2 component, the CO is not attenuated, expected from the growth of CO associated peaks post VPI as seen in the C 1s spectra (Fig. 4).
 | ||
| Fig. 6 O 1s spectra for (a) P2VP, (b) P4VP and (c) PS pre VPI and post a 0.02 s dose time process. | ||
To summarise experiment 1, the following conclusions are established: (1) increasing the dose time does not by itself affect the degree of precursor inclusion in the polymer. (2) Al is observed on all three polymers, however chemical interaction between PS and TMA does not occur. (3) TMA does not decompose completely when interacting with pyridines, with evidence of Al–C bonding. (4) The reaction mechanism proposed for P2VP and P4VP here includes the coordination between the pyridinic N and Al, along with protonation and quaternization of CH3 groups with the pyridinic N. (5) P4VP is shown to be more receptive to TMA interaction, with the VPI generated reactions occurring in the C 1s and N 1s spectra appearing in greater amounts for P4VP compared to P2VP. (6) Oxidation occurs to the Al and C, even in vacuum, showing that the process is highly sensitive to residual O exposure.
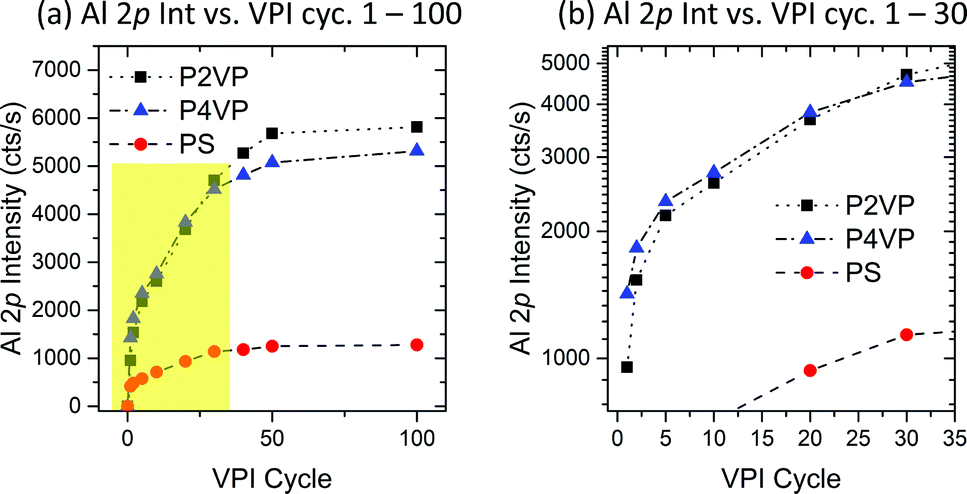 | ||
| Fig. 7 (a) Al 2p intensity on P2VP, P4VP and PS samples versus VPI cycle number. All samples experience a high Al intensity growth at low cycle numbers, with the growth rate saturating upon reaching 50 cycles. (b) An expanded view of the highlighted region in Fig. 7a, showing the relationship between P2VP and P4VP Al 2p intensity for the region 1–30 cycles. P4VP has a higher intake of Al for the first 20 cycles. | ||
Considering the behaviour of the two pyridines within the first 30 cycles (Fig. 7b), it is observed that the P4VP has a higher uptake of Al until 20–30 cycles are reached. Although P4VP ultimately shows no capacity to hold more Al than P2VP, this feature provides distinct evidence that P4VP is more reactive and facilitates quicker infiltration of Al, discussed earlier as most likely influenced by the position of the nitrogen contained in the pyridine ring.
N 1s spectra for the P2VP and P4VP at the different cycle stages of the experiment are displayed in Fig. 8a and b respectively. The spectra exhibit similar peak profile behaviour to that discussed in experiment 1 (Fig. 5) – prior to VPI, with both spectra being dominated by pyridinic N (C–NC). N–Al, CN+H–C and CN+CHx–C features develop after the initial VPI cycle, increasing in intensity with the rise in the number of cycles. The intensity trend for these three peaks, each divided by the corresponding pyridinic N peak are shown in Fig. 8c and d for the respective P2VP and P4VP samples, so as to observe the relationship between the reacted and unreacted (pyridinic N) nitrogen components. The enhanced reactivity the P4VP has with the TMA is clearly evident from the intensity profiles. All three VPI-related components are observed to have greater intensity with respect to the pyridinic N of the P4VP, when compared to P2VP. This complements the hypothesis that the slightly greater amount of Al for the P2VP at higher cycles observed in Fig. 7 is due only to the small variation in thickness between the two PVPs. The intensity of these peaks also increases rapidly in the initial cycles for P4VP, unlike the P2VP. Additionally, the reactions in the P4VP appear to be dominated by the CN+CHx–C component, unlike the P2VP, which sees the metal coordination bond as the most dominant, suggesting that the P4VP is more susceptible to quaternisation.
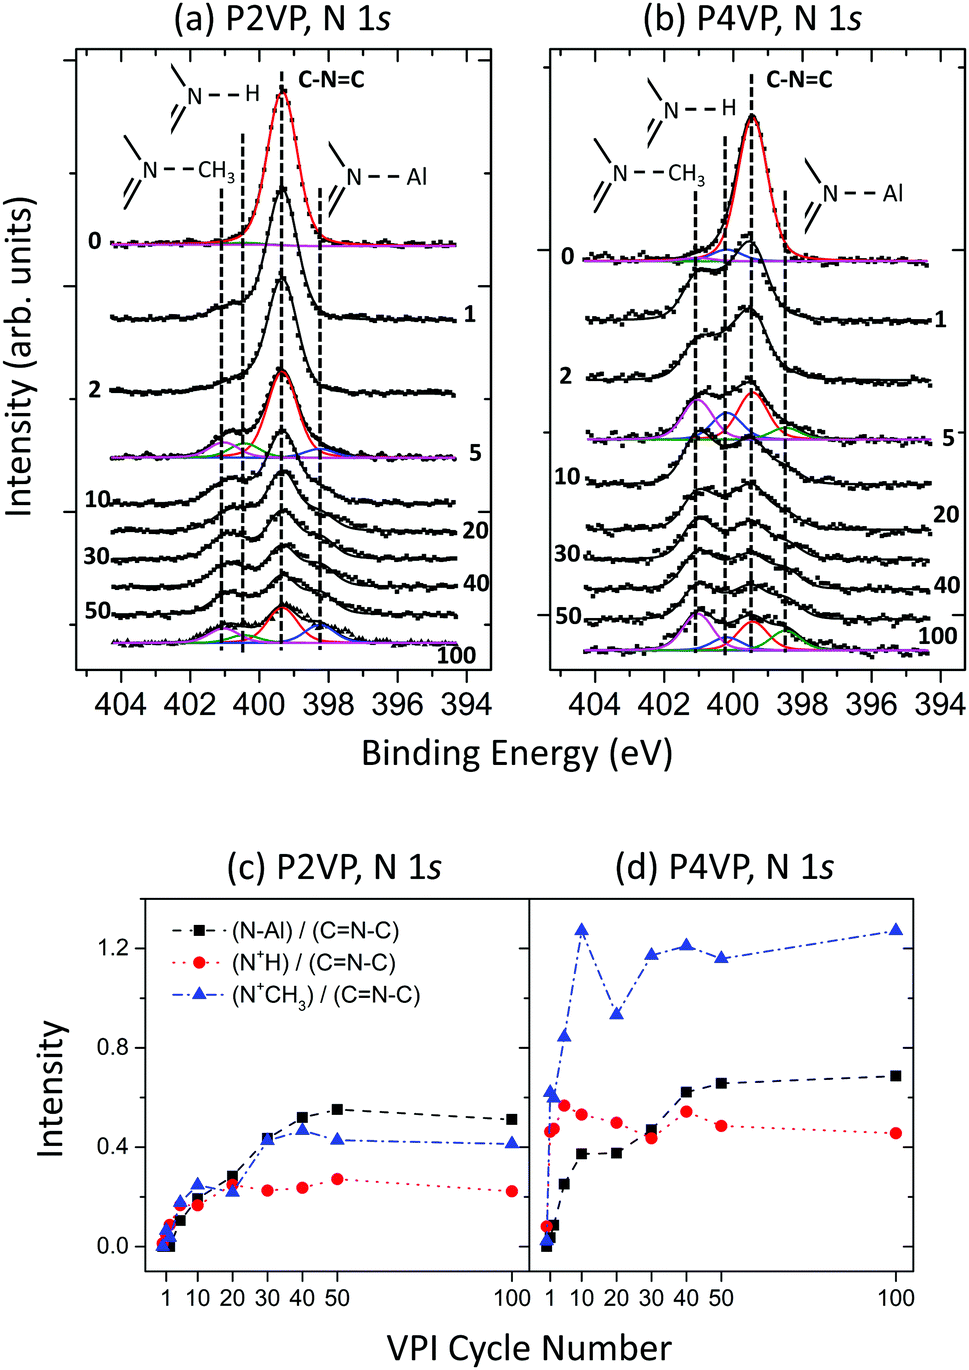 | ||
| Fig. 8 XPS N 1s spectra recorded at different stages of a 100 cycle VPI process for (a) P2VP and (b) P4VP. Area intensity versus VPI cycle number plots for P2VP (c) and P4VP (d). | ||
The results arising from experiment 2 reveal that active and inactive polymers will facilitate growth rapidly (relative to each polymer) in the initial number of cycles. This rate of growth will decrease with increasing cycles, with each polymer appearing to slowly reach a saturation point. For the PVPs, this process is driven by the precursor interaction with the pyridinic nitrogen, a reaction that occurs at a quicker pace in P4VP over the P2VP brush. Being more receptive to TMA interaction results in the P4VP incorporating more aluminium at lower cycle numbers.
The C 1s peak associated with the PS film is shown in Fig. 9(a). The spectra exhibit typical PS behaviour for all hold times except for 300 s, where asymmetry associated with a high BE component is observed. The three additional components arising from this asymmetry are associated with C–O like bonding. The low BE component at approximately 283.7 eV, observed at 60 s and higher, is attributed to Al–C bonding as observed previously. The sudden alteration in the C 1s profile is attributed to the PS losing selectivity and no longer blocking the TMA at such a long hold time, with Al now making up a larger portion of the chemical composition calculations also displayed in Fig. 9a.
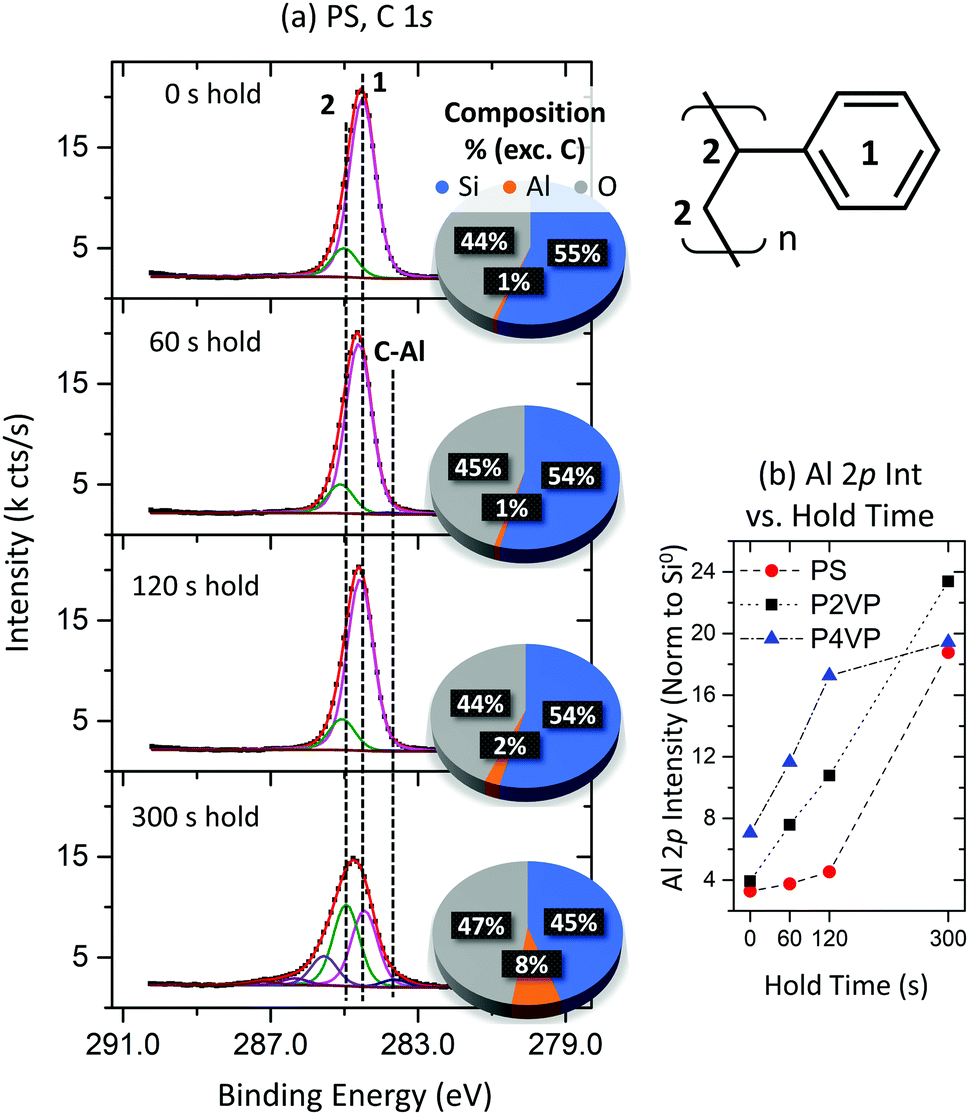 | ||
| Fig. 9 (a) XPS C 1s spectra of the PS for the 4 different hold times investigated; 0 s, 60 s, 120 s and 300 s. The carbon is unaffected except by the longest processing time, where asymmetry at high BE develops. The pie chart shows the chemical composition (excluding C) calculated from the survey scans for each hold time. (b) Al 2p intensity (normalized to the Si0 signal) for PS, P2VP and P4VP at the different VPI hold times. Good area selectivity is observed until somewhere in the region between 120–300 s. | ||
The Al 2p intensity (normalized to the Si0 2p signal) versus hold time for the three polymers is plotted in Fig. 9b. The difference in Al intensity between the pyridines and PS brush increases with increasing hold time, with low hold durations providing minimum difference between the PVPs and PS, highlighting the importance of VPI approaches in achieving maximum Al interaction. At a 300 s hold however, the Al intensity on the PS sample greatly increases. The increase in Al concentration is correlated with the asymmetry development in the C 1s seen in Fig. 9a, with the C–O bonding attributed to a byproduct forming as a result of TMA depositing upon the PS surface and interacting with the residual oxygen contained in the chamber. The significant change in the ratio of intensity between the carbon backbone and phenyl ring signals may also suggest the degradation of the phenyl ring as a result of prolonged TMA exposure. For this process, an optimal hold time is found to lie somewhere between 60 s and 300 s. Increasing the hold time initially results in the blocker polymers accumulating more Al, albeit at a slower rate than the reactive polymers. However, at some stage in this VPI process (between 120 and 300 s), the PS ceases to block growth and allows for Al deposition, taking in as much Al as the pyridines. Including a purge step before this occurs is of significance here, as the previous experiments involve longer total exposure time but at far smaller single precursor hold steps. To summarize experiment 3, thin-film polymer brush VPI processes require carefully chosen hold times to assure contrasting behaviour between reactive and non-reactive polymers. This hold time will depend on how readily the chosen precursor decomposes on the non-growth surface without requiring any significant sample–metal interaction.
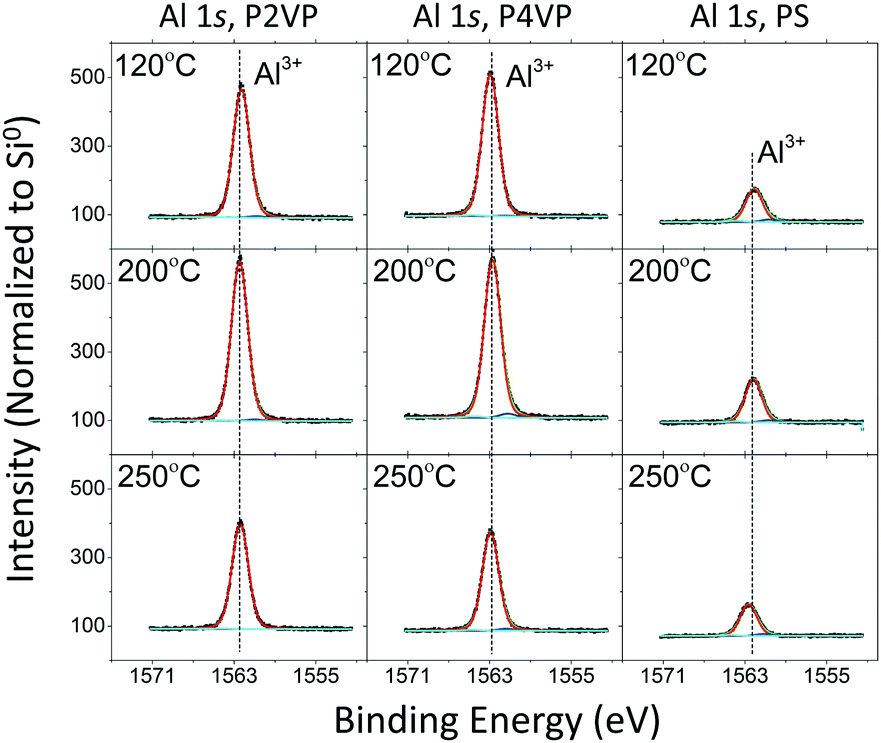 | ||
| Fig. 10 HAXPES spectra of the Al 1s (hv = 3 keV) for P2VP, P4VP, and PS at three different VPI processing temperatures. | ||
Negligible difference in Al concentration is observed between the two pyridine structures. Although the Al intake is slower initially with the P2VP brush, similar amounts of Al reside in both PVPs when sufficient cycles are completed. While there is significantly less Al residing on the PS sample, efforts must be made to reduce the amount of Al on the surface of the PS to improve area selectivity. AFM imaging of the 3 polymers from the 200 °C process (post plasma) is shown in Fig. 11. The three surfaces reveal the presence of smooth films (RMS roughness estimated <1 nm), with no defects visible or suggestion of islanding on the PS processed sample, suggesting a thin film of alumina exists upon all three samples.
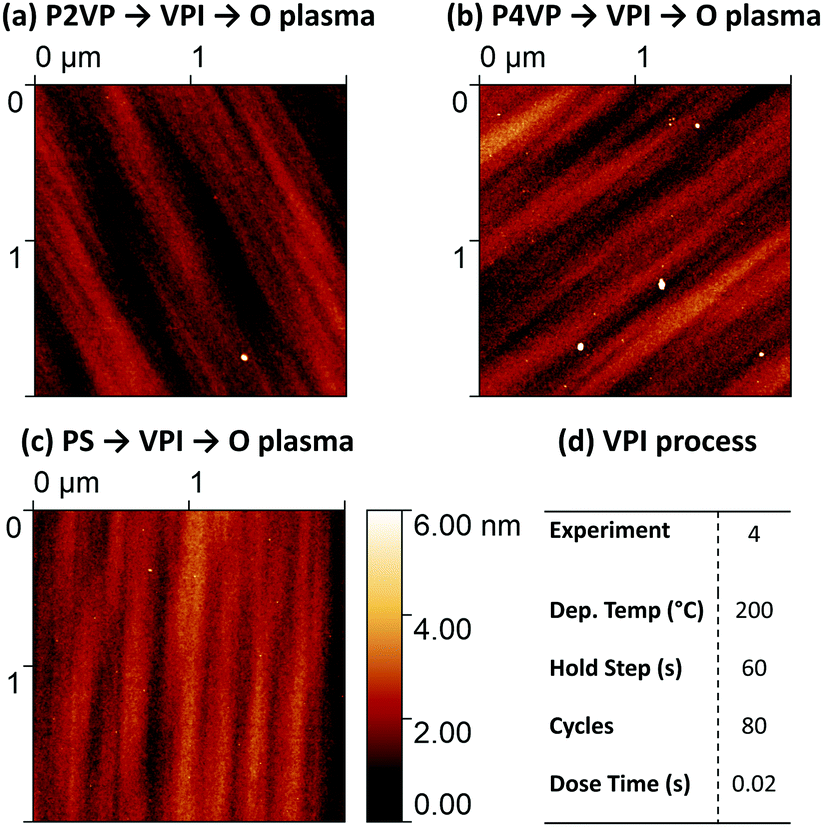 | ||
| Fig. 11 AFM height images of (a) P2VP, (b) P4VP and (c) PS. The images have been acquired after the polymers were exposed to a 200 °C, 80 cycle process shown in (d) and subsequent O plasma treatment. | ||
Changing the process temperature has a universal effect on the brush films. The resulting trend of aluminium intensity versus process temperature is the same regardless of the polymer under analysis. The maximum Al 1s area for all three polymers was observed from the 200 °C process, while the 250 °C process yielded the least. The reduction at 250 °C indicates that precursor interaction is directly affected by temperature regardless of the surface that is exposed to it. This decrease in aluminium at higher temperatures is consistent with previous studies concerning PMMA–TMA interaction, where precursor sorption into the polymer film lowers with temperature.14 The behaviour of the Al signal following 120 °C processing for the P4VP does not show any major changes, despite this process taking place below the polymer's glass transition temperature.
All spectra of the O 1s for the different depositions contain a dominant peak at 532.9 ± 0.15 eV BE, which is attributed to oxygen in SiO2. The second largest peak located at 531.9 ± 0.15 eV BE is associated with Al3+. As discussed in the Al 1s spectra, minor peaks at 530.7 ± 0.15 eV and 533.9 ± 0.15 eV represent surface-based Al–O bonding and aluminium sub oxides respectively. The intensity profile of the O 1s spectra complements that of the Al 1s spectra. There is significantly less Al3+ in the PS sample following oxygen plasma treatment compared to the pyridines, however the asymmetry of the O peak for all three samples is present, again highlighting that aluminium oxide formation is not completely limited to the pyridine films.
Selectivity considerations
Gladfelter69 defined selectivity (S) based on nucleation on active and inactive surfaces;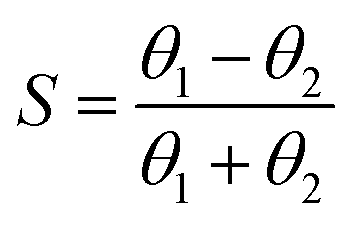 | (1) |
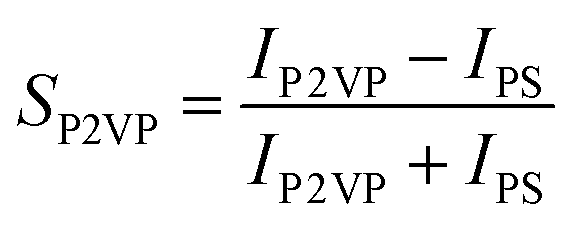 | (2a) |
 | (2b) |
Correlating with the XPS results, changing the dose time does not affect the selectivity of either brush (experiment 1). VPI processes with a low cycle number show that the P2VP brush is less selective than P4VP (experiment 2). Varying the hold time in experiment 3 has a significant effect on the selectivity for both brushes, with the optimal hold time for this process suggested to be above 60 s but below 300 s. Experiment 3 reveals that the polymer brushes are influenced more by the length of the hold time rather than the increase in dose time as analysed in experiment 1. VPI deposition temperature has a minimal effect on selectivity, however high process temperatures appear to reduce the ASD compatibility for both pyridines.
It is important to mention that an additional experiment (5) to measure the impact of adding a co-reactant (H2O) to the process to analyse a more conventional ALD-like procedure was performed. A 200 °C, 80 cycle process was edited so that after a precursor dose (0.02 s), hold (0 s) and purge, H2O was admitted to the chamber with a 0.1 s dose, followed by an Ar purge. While this increased the amount of Al incorporation in both pyridine brushes, the effect was seen to reduce the area selectivity of the process significantly, with the Al core level signal intensities on the PS sample being of similar intensity to both PVPs (SP2VP, SP4VP ≈ 0).
GA-FTIR
GATR-FTIR analysis was performed on the PS, P2VP and P4VP pre- and post-VPI process of 0.02 s dose time, 50 cycles and a 60 s hold time at 200 °C. The spectra are displayed in Fig. 12. P2VP and P4VP exhibit near-identical behaviour and are shown in Fig. 12a and b respectively. Both PVPs contain a aliphatic C–H stretching peak at 2930 cm−1, associated with the PVP backbone.70 CC stretching vibrations (attributed to the pyridine ring) are observed at 1726 cm−1 and pyridine associated stretching modes at 1600 cm−1.29,71–73 Peaks at 1416 cm−1 and 1232 cm−1 are associated with C–H deformation vibrations.
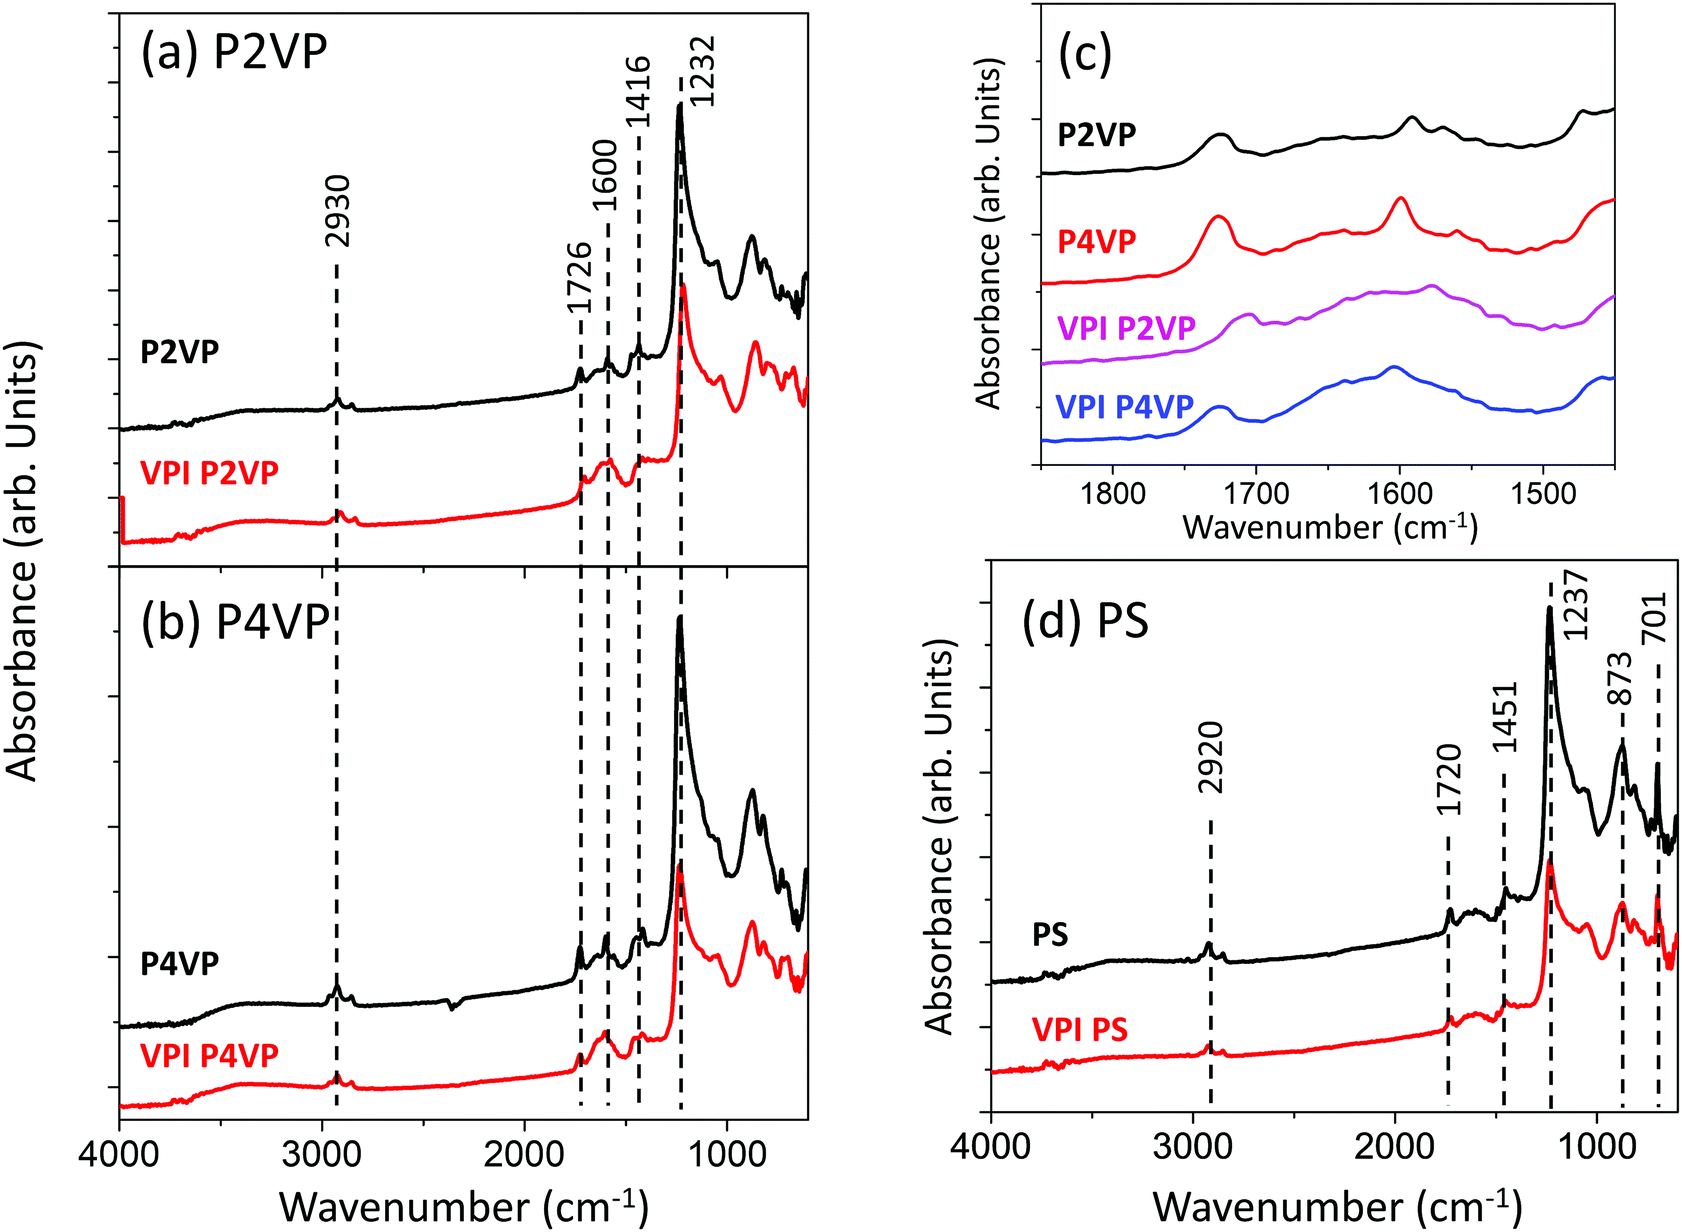 | ||
| Fig. 12 GATR-FTIR spectra of (a) P2VP and (b) P4VP pre and post VPI processing. The region 1450–1850 cm−1 in (a) and (b) shows considerable change pre and post VPI, and an inset of this region is shown in (c), highlighting the broadening occurring in the spectra. PS pre and post VPI is shown in (d), with no change observed between the two spectra. | ||
It is observed in Fig. 12c that the region 1500–1800 cm−1 undergoes changes after the VPI processing for both PVPs. Pre VPI, the region contained a single, clearly distinguishable peak at 1600 cm−1, attributed to pyridine. After VPI exposure, a new broad peak at a higher wavenumber can be observed. This change has been attributed to the quaternization and protonation of pyridine,29,71,73 which correlates with the observations made from the photoemission analysis that that PVP is undergoing quaternisation and protonation when exposed to the TMA VPI process.
The PS spectra in Fig. 12d does not change after VPI processing, with the exception of a slight loss in intensity, associated with the development of Al building atop of the PS brush. The C–H stretching peak at 2920 cm−1 is associated with the aromatic carbon in the PS backbone70 CC stretching vibrations are associated with the peak at 1720 cm−1.74 C–H deformation vibrations are observed at 1451 cm−1, while C–O stretching vibrations are located at 1237 cm−1. C–H bending is attributed to peaks at 873 cm−1 and 701 cm−1.74
Conclusions
Vapour phase polymer infiltration has been demonstrated using a commercial ALD system, with in situ XPS analysis presenting several important contributions to the field. Firstly, increasing the precursor dose time does not yield more uptake of TMA by the active polymers P2VP and P4VP. All polymers displayed the most interaction with the precursor during the initial (below 30) cycles of a VPI process, with the rate of Al incorporation decreasing with an increasing number of cycles. P4VP was shown to incorporate Al at a quicker rate than P2VP during the initial VPI cycles, with the N 1s spectra analysis agreeing with literature that metal bonding and the rate of interaction with TMA is determined by the pyridinic N and its position within the ring. A window for optimal precursor hold time was identified, with extremely short hold times insufficient to encourage pyridine–TMA interaction. However, it was found that increasing hold times too much will result in undesired TMA deposition onto PS, showing that the polymer brushes used for blocking growth purposes exhibit similar behaviour to that for self-assembled monolayers, where selectivity can be lost during metal exposure processes. HAXPES measurements revealed that better area selectivity was observed at lower temperatures. PS appeared to facilitate the deposition of thin, oxygen rich alumina films, highlighting the need for increased efforts in ensuring better area selectivity.The results have shown that controllable and area selective alumina films can be acquired through synchronised PS and PVP TMA exposure. Where possible, P4VP should be chosen above P2VP when designing TMA VPI processes, particularly when rapid metal incorporation procedures are desired. Exposure time should be prioritised over exposure amount (within reason) when designing a polymer process for area selectivity. Varying substrate temperature has less impact on the area selectivity of the procedure, however additional work must be focused on achieving VPI processes at lower temperatures. It should be noted that studying the pyridine–precursor reaction mechanism as a function of depth is desirable to further increase the scalability of the technique. Finally, this work has shown that it is not necessary for the introduction of a co-reactant to the precursor, with the introduction of H2O leading to complications in the achievement of polymer brush area selective infiltration.
Conflicts of interest
There are no conflicts of interest to declare.Acknowledgements
This publication has emanated from research conducted with the financial support of Science Foundation Ireland (SFI) under Grant No. 12/RC/2278 and 16/SP/3809. The authors would like to thank the NSLS-II for the use of their facilities in making experimental measurements as well as the support given by the beamline scientists (NSLS-II proposal number 305645) and the National Institute of Standards and Technology (NIST). This research used NIST beamline 7-ID-2 of NSLS-II, a U.S. Department of Energy (DOE) Office of Science User Facility operated for the DOE Office of Science by Brookhaven National Laboratory under Contract No. DE-SC0012704.Notes and references
- R. W. Johnson, A. Hultqvist and S. F. Bent, Mater. Today, 2014, 17, 236–246 CrossRef CAS.
- A. J. M. Mackus, A. A. Bol and W. M. M. Kessels, Nanoscale, 2014, 6, 10941–10960 RSC.
- J. A. van Delft, D. Garcia-Alonso and W. M. M. Kessels, Semicond. Sci. Technol., 2012, 27, 13 CrossRef.
- X. Jiang, H. Huang, F. B. Prinz and S. F. Bent, Chem. Mater., 2008, 20, 3897–3905 CrossRef CAS.
- A. J. M. Mackus, M. J. M. Merkx and W. M. M. Kessels, Chem. Mater., 2019, 31, 2–12 CrossRef CAS.
- R. M. M. Hasan and X. Luo, Nanomanuf. Metrol., 2018, 1, 67–81 CrossRef.
- B. J. Lin, Microelectron. Eng., 2015, 143, 91–101 CrossRef CAS.
- C. Cummins, M. T. Shaw and M. A. Morris, Macromol. Rapid Commun., 2017, 38, 1–6 CrossRef.
- M. A. Morris, Microelectron. Eng., 2015, 132, 207–217 CrossRef CAS.
- C. Cummins and M. A. Morris, Microelectron. Eng., 2018, 195, 74–85 CrossRef CAS.
- C. Cummins, R. Lundy, J. J. Walsh, V. Ponsinet, G. Fleury and M. A. Morris, Nano Today, 2020, 35, 100936 CrossRef CAS.
- J. D. Ferguson, A. W. Weimer and S. M. George, Chem. Mater., 2004, 16, 5602–5609 CrossRef CAS.
- J. C. Spagnola, B. Gong, S. A. Arvidson, J. S. Jur, S. A. Khan and G. N. Parsons, J. Mater. Chem., 2010, 20, 4213–4222 RSC.
- C. Z. Leng and M. D. Losego, Phys. Chem. Chem. Phys., 2018, 20, 21506–21514 RSC.
- C. Z. Leng and M. D. Losego, Mater. Horiz., 2017, 4, 747–771 RSC.
- Q. Peng, Y. C. Tseng, S. B. Darling and J. W. Elam, ACS Nano, 2011, 5, 4600–4606 CrossRef CAS.
- M. Biswas, J. A. Libera, S. B. Darling and J. W. Elam, Chem. Mater., 2014, 26, 6135–6141 CrossRef CAS.
- J. J. Eldridge, R. M. Crockett, J. R. Maund, D. Leonard, R. H. Mcnaught, W. Li, A. V. Filippenko, R. H. Lupton, J. A. Frogel, R. M. Humphreys, G. C. Clayton, J. S. Mathis, M. Richmond, J. J. L. Hsu, P. C. Joss, R. R. Ross, R. G. Eastman, T. A. Weaver, P. A. Pinto, S. J. Smartt, R. P. Kudritzki, P. Podsiadlowski, G. F. Gilmore, C. A. Tout, M. Bolte and D. Koester, Science, 2012, 324, 488–492 Search PubMed.
- B. Gong, Q. Peng, J. S. Jur, C. K. Devine, K. Lee and G. N. Parsons, Chem. Mater., 2011, 23, 3476–3485 CrossRef CAS.
- Z. Zhang, T. Dwyer, S. M. Sirard and J. G. Ekerdt, J. Vac. Sci. Technol., A, 2019, 37, 020905 CrossRef.
- R. Lundy, P. Yadav, A. Selkirk, E. Mullen, T. Ghoshal, C. Cummins and M. A. Morris, Chem. Mater., 2019, 31, 9338–9345 CrossRef CAS.
- J. G. Kennemur, Macromolecules, 2019, 52, 1354–1370 CrossRef CAS.
- Y. Wang, X. Xu, P. Xu, X. Feng, Y. Zhang, F. Fu and X. Liu, Polym. Int., 2018, 67, 619–626 CrossRef CAS.
- S. G. Jang, A. Khan, C. J. Hawker and E. J. Kramer, Macromolecules, 2012, 45, 1553–1561 CrossRef CAS.
- P. Mokarian-Tabari, R. Senthamaraikannan, C. Glynn, T. W. Collins, C. Cummins, D. Nugent, C. O’Dwyer and M. A. Morris, Nano Lett., 2017, 17, 2973–2978 CrossRef CAS.
- R. Lundy, P. Yadav, N. Prochukhan, E. C. Giraud, T. F. O’Mahony, A. Selkirk, E. Mullen, J. Conway, M. Turner, S. Daniels, P. G. Mani-Gonzalez, M. Snelgrove, J. Bogan, C. McFeely, R. O’Connor, E. McGlynn, G. Hughes, C. Cummins and M. A. Morris, Langmuir, 2020, 36(41), 12394–12402 CrossRef CAS.
- N. Bhuvanesh, S. Suresh, K. Kannan, V. Rajesh Kannan, N. Maroli, P. Kolandaivel and R. Nandhakumar, New J. Chem., 2019, 43, 2519–2528 RSC.
- D. Y. Osadchii, A. I. Olivos-Suarez, A. V. Bavykina and J. Gascon, Langmuir, 2017, 33, 14278–14285 CrossRef CAS.
- P. Ramar, S. Jana, S. Chatterjee, S. N. Jaisankar and D. Samanta, New J. Chem., 2019, 43, 15935–15945 RSC.
- J. S. Stevens, L. K. Newton, C. Jaye, C. A. Muryn, D. A. Fischer and S. L. M. Schroeder, Cryst. Growth Des., 2015, 15, 1776–1783 CrossRef CAS.
- C. Sinturel, F. S. Bates and M. A. Hillmyer, ACS Macro Lett., 2015, 4, 1044–1050 CrossRef CAS.
- S. P. Flynn, J. Bogan, R. Lundy, K. E. Khalafalla, M. Shaw, B. J. Rodriguez, P. Swift, S. Daniels, R. O’Connor, G. Hughes and S. M. Kelleher, Nanotechnology, 2018, 29, 355302 CrossRef.
- M. Aizawa and J. M. Buriak, J. Am. Chem. Soc., 2006, 128, 5877–5886 CrossRef CAS.
- A. Subramanian, G. Doerk, K. Kisslinger, D. H. Yi, R. B. Grubbs and C. Y. Nam, Nanoscale, 2019, 11, 9533–9546 RSC.
- D. Berman, S. Guha, B. Lee, J. W. Elam, S. B. Darling and E. V. Shevchenko, ACS Nano, 2017, 11, 2521–2530 CrossRef CAS.
- Y. C. Tseng, Q. Peng, L. E. Ocola, D. A. Czaplewski, J. W. Elam and S. B. Darling, J. Mater. Chem., 2011, 21, 11722–11725 RSC.
- Q. Peng, Y. C. Tseng, S. B. Darling and J. W. Elam, Adv. Mater., 2010, 22, 5129–5133 CrossRef CAS.
- E. Cianci, D. Nazzari, G. Seguini and M. Perego, Adv. Mater. Interfaces, 2018, 5, 1801016 CrossRef.
- I. Weisbord, N. Shomrat, R. Azoulay, A. Kaushansky and T. Segal-Peretz, Chem. Mater., 2020, 32, 4499–4508 CrossRef CAS.
- M. Biswas, J. A. Libera, S. B. Darling and J. W. Elam, Chem. Mater., 2014, 26, 55 CrossRef.
- J. Molina-Reyes, H. Uribe-Vargas, R. Torres-Torres, P. G. Mani-Gonzalez and A. Herrera-Gomez, Thin Solid Films, 2017, 638, 48–56 CrossRef CAS.
- E. P. Gusev, E. Cartier, D. A. Buchanan, M. Gribelyuk, M. Copel, H. Okorn-Schmidt and C. D’Emic, Microelectron. Eng., 2001, 59, 341–349 CrossRef CAS.
- E. C. Dandley, C. D. Needham, P. S. Williams, A. H. Brozena, C. J. Oldham and G. N. Parsons, J. Mater. Chem. C, 2014, 2, 9416–9424 RSC.
- F. J. Himpsel, F. R. McFeely, A. Taleb-Ibrahimi, J. A. Yarmoff and G. Hollinger, Phys. Rev. B: Condens. Matter Mater. Phys., 1988, 38, 6084–6096 CrossRef CAS.
- J. C. Woicik, P. Pianetta and T. Kendelewicz, Phys. Rev. B: Condens. Matter Mater. Phys., 1989, 40, 12463–12467 CrossRef CAS.
- K. C. Prince, I. Ulrych, M. Peloi, B. Ressel, V. Cháb, C. Crotti and C. Comicioli, Phys. Rev. B: Condens. Matter Mater. Phys., 2000, 62, 6866–6868 CrossRef CAS.
- T. Susi, T. Pichler and P. Ayala, Beilstein J. Nanotechnol., 2015, 6, 177–192 CrossRef.
- L. I. Johansson and H. I. P. Johansson, J. Electron Spectrosc. Relat. Phenomena, 1996, 80, 237–240 CrossRef CAS.
- M. Snelgrove, P. G. Mani-Gonzalez, J. Bogan, R. Lundy, J.-P. Rueff, G. Hughes, P. Yadav, E. McGlynn, M. Morris and R. O’Connor, J. Phys. D: Appl. Phys., 2019, 52, 435301 CrossRef CAS.
- P. G. Mani-Gonzalez, M. Snelgrove, J. P. Rueff, R. Lundy, P. Yadav, J. Bogan, R. O’Connor, M. Morris and G. Hughes, J. Phys. D: Appl. Phys., 2020, 53, 115105 CrossRef CAS.
- N. Jiang, M. Sen, M. K. Endoh, T. Koga, E. Langhammer, P. Bjöörn and M. Tsige, Langmuir, 2018, 34, 4199–4209 CrossRef CAS.
- C. F. Huang, S. W. Kuo, J. K. Chen and F. C. Chang, J. Polym. Res., 2005, 12, 449–456 CrossRef CAS.
- A. Herrera-Gomez, M. Bravo-Sanchez, O. Ceballos-Sanchez and M. O. Vazquez-Lepe, Surf. Interface Anal., 2014, 46, 897–905 CrossRef CAS.
- A. Herrera-Gomez, Y. Sun, F.-S. Aguirre-Tostado, C. Hwang, P.-G. Mani-Gonzalez, E. Flint, F. Espinosa-Magaña and R. M. Wallace, Anal. Sci., 2010, 26, 267–272 CrossRef CAS.
- C. D. Wagner, L. E. Davis, M. V. Zeller, J. A. Taylor, R. H. Raymond and L. H. Gale, Surf. Interface Anal., 1981, 3, 211–225 CrossRef CAS.
- W. Theis and K. Horn, Phys. Rev. B: Condens. Matter Mater. Phys., 1993, 47, 16060–16063 CrossRef CAS.
- G. Beamson and D. Briggs, High Resolution XPS of Organic Polymers. The Scienta ESCA300 Database, John Wiley & Sons, Chichester, 1992 Search PubMed.
- A. Furlan, U. Jansson, J. Lu, L. Hultman and M. Magnuson, J. Phys.: Condens. Matter, 2015, 27, 045002 CrossRef.
- D. J. Miller, M. C. Biesinger and N. S. McIntyre, Surf. Interface Anal., 2002, 33, 299–305 CrossRef CAS.
- H. Shi, Q. Ouyang, J. Wang, P. Zhu, J. Hao and X. Huang, Mater. Res. Express, 2020, 7, 055309 CrossRef CAS.
- R. Dalmau, R. Collazo, S. Mita and Z. Sitar, J. Electron. Mater., 2007, 36, 414–419 CrossRef CAS.
- J. X. Liao, L. F. Xia, M. R. Sun, W. M. Liu, T. Xu, C. R. Yang, H. W. Chen, C. L. Fu and W. J. Leng, Appl. Surf. Sci., 2005, 240, 71–76 CrossRef CAS.
- J. Andrés, P. Taborda and L. P. Vera, IEEE Sens. J., 2016, 16, 359–364 Search PubMed.
- J. Bogan, R. Lundy, A. McCoy, R. O’Connor, C. Byrne, L. Walsh, P. Casey and G. Hughes, J. Appl. Phys., 2016, 120, 105305 CrossRef.
- C. Byrne, B. Brennan, A. P. McCoy, J. Bogan, A. Brady and G. Hughes, ACS Appl. Mater. Interfaces, 2016, 8, 2470–2477 CrossRef CAS.
- F. S. Aguirre-Tostado, M. Milojevic, B. Lee, J. Kim and R. M. Wallace, Appl. Phys. Lett., 2008, 93, 1–4 Search PubMed.
- G. Faraci, S. La Rosa, A. R. Pennisi, Y. Hwu and G. Margaritondo, J. Appl. Phys., 1995, 78, 4091–4098 CrossRef CAS.
- Z. W. Lebens-Higgins, D. M. Halat, N. V. Faenza, M. J. Wahila, M. Mascheck, T. Wiell, S. K. Eriksson, P. Palmgren, J. Rodriguez, F. Badway, N. Pereira, G. G. Amatucci, T. L. Lee, C. P. Grey and L. F. J. Piper, Sci. Rep., 2019, 9, 1–12 CrossRef CAS.
- W. L. Gladfelter, Chem. Mater., 1993, 5, 1372–1388 CrossRef CAS.
- B. Stuard, Infrared Spectroscopy: Fundamentals and Applications Analytical Techniques in the Sciences, 2004 Search PubMed.
- M. I. Toral, J. González-Navarrete, A. Leiva, H. E. Ríos and M. D. Urzúa, Eur. Polym. J., 2009, 45, 730–737 CrossRef CAS.
- L. C. Cesteros, J. R. Isasi and I. Katime, Macromolecules, 1993, 26, 7256–7262 CrossRef CAS.
- X. Zhou, S. H. Goh, S. Y. Lee and K. L. Tan, Appl. Surf. Sci., 1998, 126, 141–147 CrossRef CAS.
- N. A. Yusof, N. D. Zakaria, N. A. M. Maamor, A. H. Abdullah and M. J. Haron, Int. J. Mol. Sci., 2013, 14, 3993–4004 CrossRef CAS.
Footnote |
| † Commercial equipment is identified in this report in order to specify the experimental procedure adequately and does not imply recommendation or endorsement by the National Institute of Standards and Technology, nor is it intended to imply that the equipment identified is necessarily the best available for the purpose. |
| This journal is © The Royal Society of Chemistry 2021 |