 Open Access Article
Large transition state stabilization from a weak hydrogen bond†
Erik C.
Vik
 a,
Ping
Li
 a,
Josef M.
Maier
a,
Daniel O.
Madukwe
a,
Vitaly A.
Rassolov
a,
Josef M.
Maier
a,
Daniel O.
Madukwe
a,
Vitaly A.
Rassolov
 a,
Perry J.
Pellechia
a,
Eric
Masson
a,
Perry J.
Pellechia
a,
Eric
Masson
 b and
Ken D.
Shimizu
*a
aDepartment of Chemistry and Biochemistry, University of South Carolina, Columbia, SC 29208, USA. E-mail: shimizu@mail.chem.sc.edu
bDepartment of Chemistry and Biochemistry, Ohio University, Athens, OH 45701, USA
First published on 2nd July 2020
Abstract
A series of molecular rotors was designed to study and measure the rate accelerating effects of an intramolecular hydrogen bond. The rotors form a weak neutral O–H⋯O![[double bond, length as m-dash]](https://www.rsc.org/images/entities/char_e001.gif) C hydrogen bond in the planar transition state (TS) of the bond rotation process. The rotational barrier of the hydrogen bonding rotors was dramatically lower (9.9 kcal mol−1) than control rotors which could not form hydrogen bonds. The magnitude of the stabilization was significantly larger than predicted based on the independently measured strength of a similar O–H⋯O
C hydrogen bond in the planar transition state (TS) of the bond rotation process. The rotational barrier of the hydrogen bonding rotors was dramatically lower (9.9 kcal mol−1) than control rotors which could not form hydrogen bonds. The magnitude of the stabilization was significantly larger than predicted based on the independently measured strength of a similar O–H⋯O![[double bond, length as m-dash]](https://www.rsc.org/images/entities/char_e001.gif) C hydrogen bond (1.5 kcal mol−1). The origins of the large transition state stabilization were studied via experimental substituent effect and computational perturbation analyses. Energy decomposition analysis of the hydrogen bonding interaction revealed a significant reduction in the repulsive component of the hydrogen bonding interaction. The rigid framework of the molecular rotors positions and preorganizes the interacting groups in the transition state. This study demonstrates that with proper design a single hydrogen bond can lead to a TS stabilization that is greater than the intrinsic interaction energy, which has applications in catalyst design and in the study of enzyme mechanisms.
C hydrogen bond (1.5 kcal mol−1). The origins of the large transition state stabilization were studied via experimental substituent effect and computational perturbation analyses. Energy decomposition analysis of the hydrogen bonding interaction revealed a significant reduction in the repulsive component of the hydrogen bonding interaction. The rigid framework of the molecular rotors positions and preorganizes the interacting groups in the transition state. This study demonstrates that with proper design a single hydrogen bond can lead to a TS stabilization that is greater than the intrinsic interaction energy, which has applications in catalyst design and in the study of enzyme mechanisms.
Introduction
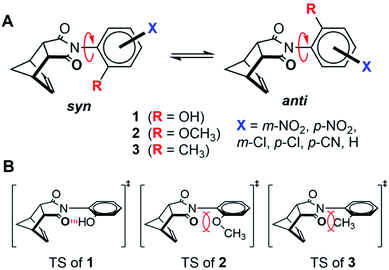
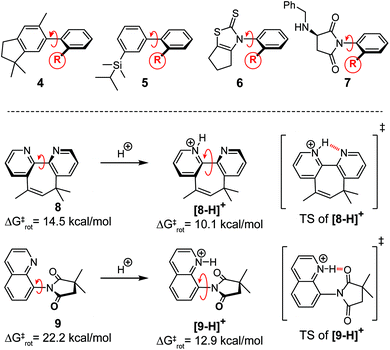
Hydrogen bonds are key contributors to the large rate accelerations observed in enzyme and synthetic organocatalyst systems.1–8 However, studying and measuring the kinetic effects of a hydrogen bond is challenging due to the instability and fleeting nature of transition states (TS). To address this problem, a series of molecular rotors 1–3 were synthesized, which measure the TS stabilizing effects of a weak intramolecular hydrogen bond on the rates of rotation (Fig. 1A). The rotors have an N-phenyl unit attached via a C–N single bond to a 5-membered imide ring. During bond rotation of the C–N single bond, R-groups at the ortho-position on the N-phenyl rotor are forced into close proximity to the imide carbonyl oxygens in the planar TS (Fig. 1B). The rate of rotation depends on the destabilizing steric and stabilizing non-covalent interactions between the R-groups and the imide carbonyls. Thus, the study of rotors 1–3 provide a simple and potentially accurate method of measuring the TS stabilizing intramolecular hydrogen bond.Molecular rotors have been used as molecular machines to measure steric effects.9–11 For example, Sternhell, Roussel, and Mazzanti developed molecular rotors 4, 5, and 6 to develop and compare new empirical steric parameters (Fig. 2).12–15 The rotational barriers of the rotors were primarily determined by the steric size of the R-groups adjacent to the atropisomeric bond.9,12–22 Deviations from the steric trends were attributed to the presence of stabilizing TS interactions such as hydrogen bonding and n → π* interactions.15,19–22 For example, Rebek and co-workers designed molecular device 8 (Fig. 2), where the rate of isomerization is controlled by stabilizing TS interactions.17,18 The rate of isomerization was greatly accelerated in the presence of a proton or metal ions which binds to the planar TS of the 2,2′-bipyridine unit. More recently, we developed molecular rotor 9 which has a greatly accelerated rate of rotation upon protonation due to the formation of a stabilizing TS hydrogen bond.20
Based on the above examples, the TS hydrogen bond in phenol rotor 1 was predicted to increase the rate of rotation.19,21 Our expectations were that the increase in rate due to the hydrogen bond would be similar to the thermodynamic strength of the hydrogen bond. However, the magnitude of the TS stabilization (9.9 kcal mol−1) was 3 to 6.6 times larger than the measured strength of a hydrogen bond between the phenolic hydroxy group and a carbonyl (1.5 to 3.4 kcal mol−1 in chlorinated organic solvents).23 Therefore, the goal of this study was to verify and examine the origins of the unexpectedly large TS stabilization in rotor 1. We were particularly interested in whether hydrogen bonds could have ‘amplified’ effects on transition states that could be used in the design of new hydrogen bonding catalysts and could provide insight into the catalytic mechanism of enzymatic systems.
The use of molecular rotors to study TS interactions has a number of advantages. First, bond rotation is a simple and easy to measure kinetic process. The rate equation is unimolecular, which reduces the number of experimental variables and simplifies the kinetic analysis. In addition, the rate of bond rotation is easily and accurately measured using dynamic NMR methods such as lineshape analysis, coalescence temperature and exchange spectroscopy experiments.24,25 Second, the bond rotation transition states can be accurately modelled due to their relatively simple structure, rigid geometrical constraints, and minimal degrees of freedom. Finally, the TS hydrogen bond strengths can be systematically modulated using electron withdrawing substituents on the phenyl rotors (X = H, p-Cl, m-Cl, p-CN, m-NO2, p-NO2) that increase the acidity and hydrogen bond donating ability of the phenolic proton.26
As in previous systems, the rotational barriers of the molecular rotors were primarily determined by the steric interactions of the ortho-substituents (R-groups).9,15–21 Therefore, the key to the analysis was separating the hydrogen bonding contributions from the steric contributions to the rotational barriers. Our first approach was to compare the rotational barriers of rotors that had similar steric TS interactions but varying hydrogen bonding abilities. Thus, the barriers for hydrogen bonding rotor 1 was compared with non-hydrogen bonding rotors 2 and 3. Rotor 1 has an ortho-OH group that can form an intramolecular hydrogen bond with the imide carbonyl oxygen. Control rotors 2 and 3 have ortho-OCH3 and ortho-CH3 groups that lack acidic hydrogens and, thus, cannot form TS hydrogen bonds. The similar steric sizes of the ortho-groups in the three rotors was established by comparison of their B-values, which is an empirical steric parameter developed by Mazzanti.13,14 The B-values for the OH, OCH3, and CH3 groups were similar at 5.4, 5.6, and 7.4 kcal mol−1, respectively.13,14 Mazzanti's steric parameter is particularly well-suited to our analysis as B-values are based on the rotational barriers for a series of very similar biphenyl rotors 5.
Rotors 1, 2, and 3 were synthesized via a one-step thermal condensation of the appropriately substituted aniline with cis-5-norbornene-endo-2,3-dicarboxylic anhydride.27,28 The rotational barriers were measured by monitoring the rate of syn–anti interconversion using variable temperature 1H NMR methods. The large difference in rotational barriers of hydrogen bonding 1versus non-hydrogen bonding controls 2 was immediately evident by their rate of exchange (Fig. 3). At room temperature (25 °C), the protons for 1 were in fast exchange in the 1H NMR spectra, as the peaks for the syn- and anti-rotamers were coalesced. In contrast, protons for rotors 2 were in slow exchange at 25 °C, as the syn- and anti-rotamers displayed separate sets of peaks.
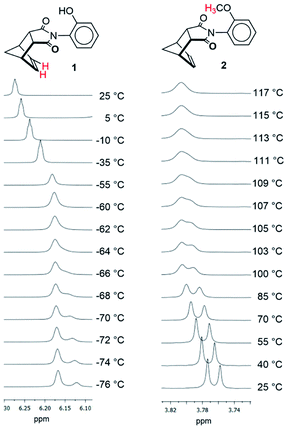 | ||
| Fig. 3 Variable temperature 1H NMR of rotors 1 and 2 measured in CD2Cl2 and TCE-d2. The protons corresponding to the peaks in each set of spectra are highlighted in red in the structures. | ||
The large difference in barriers between 1 and 2 were quantitatively measured using three separate dynamic 1H NMR methods. Coalescence temperature, lineshape analysis, and EXSY all yielded similar barriers (Table 1). The barrier for 1 was 10.8–11.1 kcal mol−1 and the barrier for 2 was 20.1–20.8 kcal mol−1. Thus, each method consistently measured a large difference in barrier  between rotors 2 and 1. The minor variations in the individual barriers can be attributed to the TΔS‡ term of ΔG‡ which are characteristically small for rotational barriers.29,30
| Rotor | ΔG‡ lineshapeb | ΔG‡ coalescenceb | ΔG‡ EXSYb | ΔG‡calcc | ΔE‡calcc |
|---|---|---|---|---|---|
| a All energy in kcal mol−1. b Measured by VT 1H NMR. c Geometry optimized at (B3LYP-D3(BJ)/def2-TZVP) level. Energies calculated at (B2GP-PLYP-D3(BJ)/def2-TZVP) level. d Coalescence occurred at −55 °C. e Coalescence occurred at 113 °C. f Coalescence occurred at 137.5 °C. | |||||
| 1 | 10.8 | 10.9d | 11.1 | 10.1 | 10.1 |
| 2 | 20.1 | 20.8e | 20.2 | 20.1 | 18.6 |
| 3 | 19.1 | 21.4f | 21.0 | 20.3 | 19.2 |
| 1* | NA | NA | NA | NA | 19.7 |

|
9.3 | 9.9 | 9.1 | 10.0 | 9.6 |
Several alternative hypotheses were explored for the large difference in barriers  First, the higher barrier of 2 could due to repulsion between the lone pairs on the oxygens of the carbonyl and ortho-OCH3 groups (Fig. 1B).31–33 In contrast, these destabilizing lone pair–lone pair (lp–lp) interactions are not formed in rotor 1 due to the formation of the TS hydrogen bond. To assess the importance of the lp–lp interactions, a second control rotor 3 was examined which had an ortho-CH3 group that could not form lp–lp interactions. The rotational barrier of control 3 (21.0 kcal mol−1 by EXSY) was very similar to the barrier of non-hydrogen bonding control 2 (20.2 kcal mol−1 by EXSY), which were consistent with the projected barriers based on the size of the ortho-groups from Mazzanti's steric parameters.22 More importantly, the barriers of control 3 was also significantly higher than hydrogen bonding rotor 1 (11.1 kcal mol−1, by EXSY). Thus, the dramatically higher barrier for control rotor 2 does not appear to be due to lp–lp interactions.
The second hypothesis for the large rotational barrier difference for 1 and 2 was the different solvents (CD2Cl2 and TCE-d2) used in the NMR barrier studies. Solvents with very different freezing and boiling points were required because of the large differences in the coalescence temperatures of rotors 1 and 2. The first argument against solvent effects is the similarity in solvent polarity and hydrogen bonding ability of CD2Cl2 and TCE-d2 as both are chlorinated organic solvents.19 The second argument against the solvent effect hypothesis is the relative insensitivity of rotational barriers to solvent environment. For example, Kishikawa examined the solvent effect on the rotational barrier for a series of very similar N-phenylimide rotors 7 over a much broader range of solvent polarities (Fig. 2).34 The differences in barrier measured between a very non-polar (toluene) and polar solvent (DMSO) was only 1.2 kcal mol−1, which was significantly smaller than the observed difference in barrier for 1 and 2.34 The possibility that the higher barrier of control rotor 2 was due to hydrogen bonding in the ground state to residual water in the samples was examined. We examined the solvent effects of the rotational a barrier of similar N-arylimide rotor with an ortho-benzyl ether group in a previous study.19 The barrier of the ortho-benzyl ether rotor remained constant when measured in different solvent systems, even those that form strong hydrogen bonds such as acetic acid and triethylamine. This suggests that the high barrier of control rotor 2 is not due to solvent effects. Finally, computational estimates of the barriers made in the absence of solvent were able to accurately reproduce the large barrier difference between 1 and 2 (vide infra), providing support that the difference was not due to the different solvent environments.
The inability of the lp–lp and solvent hypotheses to explain the lower barrier of rotor 1 left the intramolecular hydrogen bond as the most likely explanation. Therefore, the next set of experiments examined the correlation between the strength of the hydrogen bond and the TS stabilization. The hydrogen bond strength of the phenolic OH was systematically modulated by attaching electron withdrawing substituents of varying strengths (X = H, p-Cl, m-Cl, p-CN, m-NO2, p-NO2) to the N-phenyl rotor (Fig. 1A). The substituents increase the acidity and hydrogen bonding ability of the OH proton.26 An analogous series of similarly substituted control rotors 2 were prepared, and their barriers were measured to assess the substituent effects in the absence of the intramolecular hydrogen bond.
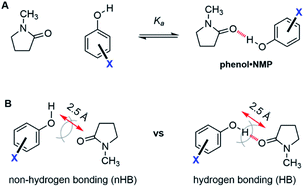
The ability of the substituents to modulate the hydrogen bond strength of the phenolic OH was separately assessed using a series of phenol·NMP (N-methylpyrrolidinone) complexes (Fig. 4, top). These bimolecular complexes form the same OH⋯O![[double bond, length as m-dash]](https://www.rsc.org/images/entities/char_e001.gif) C hydrogen bond as the TS hydrogen bond in rotor 1. The association energies (ΔGKa) of the substituted complexes with substituted phenols (X = H, p-Cl, m-Cl, p-CN, m-NO2, p-NO2) were measured by 1H NMR titration in CD2Cl2.
C hydrogen bond as the TS hydrogen bond in rotor 1. The association energies (ΔGKa) of the substituted complexes with substituted phenols (X = H, p-Cl, m-Cl, p-CN, m-NO2, p-NO2) were measured by 1H NMR titration in CD2Cl2.
The association energy (ΔGKa) of the unsubstituted phenol·NMP complex (X = H) confirmed that the kinetic effects of the TS hydrogen bonds in the molecular rotors were significantly larger than the strength of the hydrogen bonding interaction. The hydrogen bond strengths in the phenol·NMP complex were −1.5 to −3.4 kcal mol−1, which were consistent with previous measures of the phenol hydrogen bond strengths in chlorinated organic solvents.23 More importantly these values were considerably lower than the hydrogen bonding effects on the rotational barrier of rotor 1 even when taking into account the difference in strength of an inter- versus intramolecular interaction (which have been estimated to be 1.4 kcal mol−1).35
The association energies of the substituted phenol·NMP complexes confirmed the ability of the substituents systematically modulate the strength of the phenol hydrogen bond in a predictable manner. A strong correlation was observed between the electron withdrawing abilities of the substituents and the hydrogen bonding interaction energies as seen by the linear Hammett plot with a negative slope (Fig. 5).
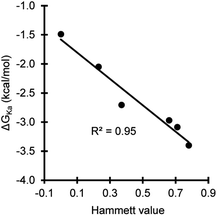 | ||
| Fig. 5 Hammett plot of the association energies (ΔGKa) for the phenol·NMP hydrogen bonding complex versus the electrostatic Hammett parameter values for the phenolic substituents. | ||
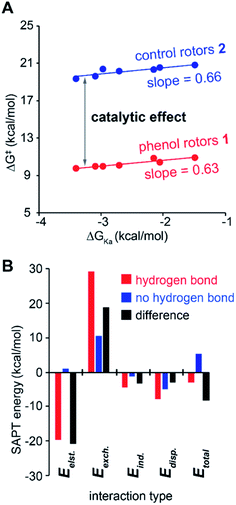
The substituent effects measured for the phenol·NMP complexes (ΔGKa) were used to assess the influence of the hydrogen bond strength on the TS stabilizing effects in rotor 1. First, the rotational barriers for similarly substituted rotors 1 and 2 were measured (X = H, p-Cl, m-Cl, p-CN, m-NO2, p-NO2). As expected, the barriers for rotor 1 decreased with increasing strength of the intramolecular hydrogen bond from 10.9 kcal mol−1 (X = H) to 9.7 kcal mol−1 (X = p-NO2). This trend was confirmed by the linear correlation between the rotational barriers and the biomolecular association energies (ΔGKa) for similarly substituted (Fig. 6A). However, the magnitude of the decrease was much smaller than expected. The slope of the trendline for rotor 1 was 0.63, which means that a change in intermolecular hydrogen bond strength of 1.0 kcal mol−1 lead to only a decrease in rotational barrier of 0.63 kcal mol−1. In addition, the TS stabilization attributable to the hydrogen bond was even smaller as the control rotor 2 which cannot form TS hydrogen bonds displayed nearly identical substituent effects (Fig. 6A, blue circles). Surprisingly, the hydrogen bond induced TS stabilization defined as  remained constant (9.9 ± 0.3 kcal mol−1) across the series of substituted rotors.
A possible explanation for the similar substituent effects in rotors 1 and 2 is the ability of the substituent on the N-phenyl ring to modulate the rotational barrier by through-bond conjugation effects. In the planar TS, the more strongly electron withdrawing substituents of the N-phenyl ring form stabilizing resonance structures with the nitrogen of the imide. Support for the through-bond hypothesis was provided by the observation by Kishikawa and co-workers for a series of substituted N-phenylsuccinimide rotor 7.34 The rotational barriers of 7 had similar magnitude substituent effects even with a much less polarizable ortho-methyl group. Thus, through-bond substituent effects were observed but were relatively small. More importantly, similar magnitude effects were observed for rotors 1 and 2. Therefore, the large difference in barrier between rotors 1 and 2 cannot be attributed to these through-bond effects.
Next, the origins of the large TS stabilizing effect in rotor 1 were examined computationally using functionals and basis sets previously identified as providing accurate barriers for substituted biaryl rotors.29 The GS and TS geometries of the series of the substituted rotors 1 and 2 were optimized at the B3LYP-D3(BJ)/def2-TZVP level of theory and verified by vibrational analysis. Single point energies were then calculated on the B3LYP-D3(BJ) optimized structures at the B2GP-PLYP-D3(BJ)/def2-TZVP level or theory. From the entropies and enthalpies, the Gibbs free energies (ΔG‡calc) were calculated at the individual coalescence temperature for each rotor. The calculated barriers accurately reproduced the experimental barriers for the substituted rotors including the large difference between rotors 1 and 2 (Table 1). The calculated barriers only slightly underestimated the experimental barrier by an average of 0.63 kcal mol−1. Taking this systematic error into account, the calculated barriers reproduced the experimental barriers with an accuracy of ±0.19 kcal mol−1. For example, the calculated barriers for the unsubstituted (X = H) rotors 1 and 2 were 10.1 and 20.1 kcal mol−1versus the NMR line shape analysis barriers by of 10.8 and 20.1 kcal mol−1.
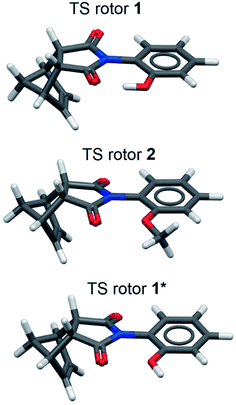
The accuracy of the calculated barriers suggests that theoretical model was accurately reproducing the TS and GS geometries (Fig. 7). In the TS of rotor 1, a well-defined intramolecular hydrogen bond was formed with O–H⋯O bond angles of 165.76° and a very short O⋯O distance of 2.50 Å (Fig. 3). For comparison, the equilibrium hydrogen bonding distance for an O–H⋯O hydrogen bond is typically 2.8 to 2.9 Å.36 The short O⋯O distance of the TS hydrogen bond did not vary across the substituent series (2.49 Å, ±0.005) even with the strongest electron withdrawing substituents such as p-NO2 or m-NO2. Interestingly, the TS geometry of the non-hydrogen bonding 2 was nearly identical to the TS of the hydrogen bonding 1. For example, the average O⋯O distances of 2 was 2.48 ± 0.003 Å, again with very little variance across the substituted series. The similarity in the TS distances and geometries of 1 and 2 demonstrates the ability of the rigid rotor framework to precisely position the interacting groups in the TS.
Two important conclusions were drawn from the computational studies. First, the non-hydrogen bonding rotor 2 was confirmed as a good control to isolate the hydrogen bonding effects in rotor 1. The large difference in barrier between rotors 1 and 2 were due the formation of the intramolecular hydrogen bond in 1 and not due to steric differences between the OH and OCH3 groups. To confirm the similarly in sterics size of the OH and OCH3 groups, a geometrically constrained phenol rotor 1* was calculated containing an OH group by constrained in a non-hydrogen bonding geometry with the phenolic proton pointing away from the imide carbonyl (Fig. 7, bottom structure). The barrier for 1* was calculated and compared with the previously calculated barriers for 1 and 2. Due to the constraint, the ΔG‡calc values for 1* were not readily estimated. Therefore, the ΔE‡calc for the barriers of the rotors were compared (Table 1, column 6). The barrier of 1* (ΔE‡calc = 19.7 kcal mol−1) was very similar to the non-hydrogen bonding control 2 (ΔE‡calc = 18.6 kcal mol−1). The similarity in barrier confirms that, in the absence of the hydrogen bond, the OH and OCH3 groups have similar steric effects. In addition, 1* had a much higher barrier (19.7 kcal mol−1) than unconstrained 1 (10.1 kcal mol−1), which provided further support for the dominant role of the hydrogen bond in lowering the barrier for rotor 1.
The effects of the hydrogen bond on the TS 1 were next examined using symmetry-adapted perturbation theory (SAPT) analysis, which separates the interaction energies into electrostatic, exchange, induction, and dispersion components. SAPT is designed for intermolecular interactions. Thus, the method was applied to study the O–H⋯O hydrogen bonding interaction in the phenol·NMP complex (Fig. 4B). The interacting atoms of the phenol and NMP amide were constrained in a planar geometry, and the O-to-O distance was fixed at 2.5 Å to mimic the TS distances in the rotors. Again, the hydrogen bonding effects were isolated by comparing hydrogen bonding (HB) and non-hydrogen bonding (nHB) geometries of the biomolecular complex. In the HB complex, the phenol proton was unconstrained and formed an intermolecular hydrogen bond with the NMP carbonyl oxygen. In the nHB complex, the phenol proton was fixed in a non-hydrogen bonding position pointing away from the NMP carbonyl. The total SAPT interaction energies (Etotal) and component energies (electrostatic (Eelst), exchange (Eexch), induction (Eind), and dispersion (Edisp)) were calculated using CCSD(T)/cc-VQZ for the HB complex, nHB complex, and the difference energy (nHB − HB) (Fig. 6).
The ability of the SAPT analyses of the phenol·NMP complexes to provide insight into the hydrogen bonding effects in the molecular rotors was confirmed by the similarity with previous trends. First, the SAPT component analysis of the HB complexes (Fig. 6B, red bars) matched previous component analyses of hydrogen bonding interactions.37 Specifically, the hydrogen bonding interaction in the phenol·NMP complex (Fig. 6A, red bars) was made up of large opposing attractive (−32.1 kcal mol−1) and repulsive (+29.2 kcal mol−1) terms, which largely cancel to yield a weakly stabilizing interaction (Etotal = −2.9 kcal mol−1). The attractive term is dominated by the electrostatic component with smaller contributions from the induction, and dispersion components. The repulsive term is made up entirely of the exchange component. Second, the bimolecular complexes showed the same discrepancy between the apparent strength of the hydrogen bonding interaction and its effect on the stability of the complexes. Specifically, the hydrogen bonding interaction energy, as measured by the difference in interaction energies (ESAPT Δ, Fig. 6A black bars) for the nHB and HB complexes, was significantly larger than the hydrogen bonding interaction energy (ESAPT HB, Fig. 6A red bars).
Analysis of the component energies revealed that the origin of the discrepancy in the ESAPT Δ and ESAPT HB energies was due to the repulsive exchange component of the hydrogen bonding interaction. The variation in the repulsive term is evident from a comparison of the SAPT component energies. Due to the magnitude of the repulsive component, even a small difference of 33% in the Eexch component of the HB complex (Fig. 6, red bars) and the difference energy (Fig. 6, black bars) has a large impact. By comparison, the attractive terms (Eelst, Eind, and Edisp) in the HB complex and the difference energies do not differ significantly.
The disparity in the exchange components is due to the constraints imposed on the biomolecular complexes, which mimic the rigid framework of the molecular rotors. These constraints ‘prepay’ the repulsive steric interactions by holding the heavy atom oxygens in close proximity in the hydrogen bonding and non-hydrogen bonding complexes. The repulsive interactions of the oxygen atoms in the OH⋯O![[double bond, length as m-dash]](https://www.rsc.org/images/entities/char_e001.gif) C interaction of the HB complex (2.50 Å) make up approximately one-third of the overall repulsive component of the hydrogen bonding interaction. Therefore, the difference energy between the HB and nHB complexes contains all of the attractive terms of the hydrogen bonding interaction but only two-thirds of the repulsive term. This helps explain how the effect of the hydrogen bond, which is simulated by the different energy between the nHB and HB complex, is significantly larger than the hydrogen bonding energy which is measured by the interaction energy in the HB complex. The rigid aromatic framework of the molecular rotors imposes similar position and distance constraints of the interacting groups in the planar TS. Thus, the trends and interaction energies observed in the bimolecular complexes should be similar to those in the molecular rotors.
C interaction of the HB complex (2.50 Å) make up approximately one-third of the overall repulsive component of the hydrogen bonding interaction. Therefore, the difference energy between the HB and nHB complexes contains all of the attractive terms of the hydrogen bonding interaction but only two-thirds of the repulsive term. This helps explain how the effect of the hydrogen bond, which is simulated by the different energy between the nHB and HB complex, is significantly larger than the hydrogen bonding energy which is measured by the interaction energy in the HB complex. The rigid aromatic framework of the molecular rotors imposes similar position and distance constraints of the interacting groups in the planar TS. Thus, the trends and interaction energies observed in the bimolecular complexes should be similar to those in the molecular rotors.
Another way to explain the larger than expected effects of the hydrogen bond is to compare the repulsive components in the two systems shown in Fig. 4. The top set of structures (Fig. 4A) is an equilibrium between hydrogen bonding phenol and NMP molecules. On the right-hand side of the equilibrium, the molecules are close together forming a hydrogen bonding interaction. On the left-hand side, the two molecules are far apart (left) and cannot form any interactions. Thus, the equilibrium energy (ΔGKa), which is the difference in energy between the right and left side of the equilibrium arrow, measures all of the attractive and repulsive components of the hydrogen bonding interaction. By comparison, the bottom set of structures (Fig. 4B) is representative of the kinetic measurements in our molecular rotor systems where the interacting groups are rigidly constrained by the N-arylimide framework. The structure on the right is the HB complex forms similar hydrogen bonding interactions as the above equilibrium system. The control structure on the left does not form a hydrogen bonding interaction. However, the interacting groups are still positioned in close proximity due to the geometric constraints and therefore still contains significant repulsive interactions. The oxygens of the phenol and carbonyl are closer (2.50 Å) than the sum of their VDW radii (3.04 Å). Therefore, the difference energy (ΔEHB − ΔEnHB) contains all of the attractive components of the hydrogen bond but only a fraction of the repulsive components. Therefore, the difference energy for the bottom set of constrained structure can be considerably larger than ΔGKa for the top set of equilibrium structures.
These molecular rotors demonstrate an alternative strategy for enhancing the kinetic effects of a hydrogen bonds via modulation of the repulsive component. More typically hydrogen bonding interaction are attenuated by modulation the attractive component. For example, the attractive electrostatic component of the hydrogen bond in the phenol·NMP complex was systematically strengthened using electronegative substituents.
A survey of the literature identified other examples (Fig. 8) of hydrogen bonds being modulated via the repulsive component. In these systems, like the molecular rotors, the interacting groups are fixed in close proximity in the hydrogen bonding and non-hydrogen bonding control structures. A common feature was the surprising strength or influence of the hydrogen bonds. The first example is proton sponge, 1,8-diaminonaphthalene (Fig. 8A). The unusually high proton affinity of proton sponge is not due to the strength of the hydrogen bonding interacting in the protonated structure. Instead, computational studies have attributed the high proton affinity to the relief of the extreme strain in the unprotonated diamine.38 A more recent example was provided by Perrin et al. (Fig. 8B). (±)-α,α′-di-tert-butylsuccinate also shows a very high proton affinity, which was initially attributed to the strong intramolecular hydrogen bond. However, more careful analysis found that the high proton affinity was due to the reduction of the large repulsive interactions in the non-hydrogen bonding dianion structure.39
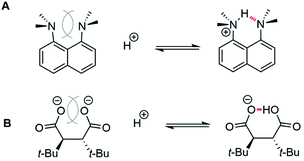 | ||
| Fig. 8 Protonation equilibria for (A) proton sponge and (B) (±)-α,α′-di-tert-butylsuccinate which form strong intramolecular hydrogen bonds due to the strong destabilizing repulsive interactions in the unprotonated structures.40 | ||
Conclusions
The study of the kinetic effects of a hydrogen bond using molecular rotor 1 demonstrates that a single neutral hydrogen bond can have a TS stabilization that appears to be many times larger than the thermodynamic strength of the hydrogen bond. The origins of the enhanced TS stabilization were examined, which provided new design strategies for hydrogen bonding catalysts. The traditional approach has been to optimize the attractive component of hydrogen bonding interactions. However, the molecular rotors demonstrate that large rate accelerations can be affected by reducing the large repulsive energy term of the hydrogen bond. A key question is whether the trends observed for the intramolecular hydrogen bonds in the molecular rotors are also relevant to bimolecular catalytic systems, which generally have longer atom–atom distances and greater flexibility. The extensive analysis of enzyme catalysis by Warshel suggest that similar strategies of reducing the repulsive component of non-covalent interactions are operative in biological systems.41 Specifically, Warshel has hypothesized that a significant portion of the large catalytic rate enhancements can be attributed to the ability of the enzyme framework to preorganize the interacting and catalytic groups in the transition state. Thus the protein framework positions polar and charged groups in close proximity overcoming the repulsive forces and creating a high energy ground state that is closer to the TS energy. Small molecule catalysts could also be designed to prepay repulsive energy during binding of the catalyst and ligand prior to the reaction preceding. Like in the enzyme, by forming a complex with key reacting groups positioned appropriately so the energy penalty is paid during the initial complex formation, a catalyst can more effectively drive a reaction forward.Conflicts of interest
There are no conflicts to declare.Acknowledgements
This work was supported by the National Science Foundation grants CHE 1709086, CHE-1507321, and CHE-1905238.Notes and references
- W. Li and J. Zhang, Chem. Soc. Rev., 2016, 45, 1657–1677 RSC.
- L. Simón and J. M. Goodman, J. Org. Chem., 2010, 75, 1831–1840 CrossRef PubMed.
- M. Nagar and S. L. Bearne, Biochemistry, 2015, 54, 6743–6752 CrossRef CAS PubMed.
- P. R. Schreiner, Chem. Soc. Rev., 2003, 32, 289–296 RSC.
- Y. Nishikawa, Tetrahedron Lett., 2018, 59, 216–223 CrossRef CAS.
- M. Raynal, P. Ballester, A. Vidal-Ferran and P. W. N. M. van Leeuwen, Chem. Soc. Rev., 2014, 43, 1660–1733 RSC.
- M. Raynal, P. Ballester, A. Vidal-Ferran and P. W. N. M. van Leeuwen, Chem. Soc. Rev., 2014, 43, 1734–1787 RSC.
- A. G. Doyle and E. N. Jacobsen, Chem. Rev., 2007, 107, 5713–5743 CrossRef CAS PubMed.
- S. Erbas-Cakmak, D. A. Leigh, C. T. McTernan and A. L. Nussbaumer, Chem. Rev., 2015, 115, 10081–10206 CrossRef CAS PubMed.
- E. R. Kay, D. A. Leigh and F. Zerbetto, Angew. Chem., Int. Ed., 2007, 46, 72–191 CrossRef CAS PubMed.
- V. Balzani, A. Credi, F. M. Raymo and J. F. Stoddart, Angew. Chem., Int. Ed., 2000, 39, 3348–3391 CrossRef CAS PubMed.
- G. Bott, L. D. Field and S. Sternhell, J. Am. Chem. Soc., 1980, 102, 5618–5626 CrossRef CAS.
- A. Mazzanti, L. Lunazzi, M. Minzoni and J. E. Anderson, J. Org. Chem., 2006, 71, 5474–5481 CrossRef CAS PubMed.
- A. Mazzanti, L. Lunazzi, R. Ruzziconi, S. Spizzichino and M. Schlosser, Chem.–Eur. J., 2010, 16, 9186–9192 CrossRef CAS PubMed.
- C. Roussel, N. Vanthuyne, M. Bouchekara, A. Djafri, J. Elguero and I. Alkorta, J. Org. Chem., 2008, 73, 403–411 CrossRef CAS PubMed.
- V. Singh and R. M. Singh, Indian J. Chem., Sect. B: Org. Chem. Incl. Med. Chem., 1984, 23, 782–784 Search PubMed.
- J. Rebek and J. E. Trend, J. Am. Chem. Soc., 1978, 100, 4315–4316 CrossRef CAS.
- J. Rebek, Acc. Chem. Res., 1984, 17, 258–264 CrossRef CAS.
- G. T. Rushton, E. C. Vik, W. G. Burns, R. D. Rasberry and K. D. Shimizu, Chem. Commun., 2017, 53, 12469–12472 RSC.
- B. E. Dial, P. J. Pellechia, M. D. Smith and K. D. Shimizu, J. Am. Chem. Soc., 2012, 134, 3675–3678 CrossRef CAS PubMed.
- Y. Wu, G. Wang, Q. Li, J. Xiang, H. Jiang and Y. Wang, Nat. Commun., 2018, 9, 1953 CrossRef PubMed.
- E. C. Vik, P. Li, P. J. Pellechia and K. D. Shimizu, J. Am. Chem. Soc., 2019, 141, 16579–16583 CrossRef CAS PubMed.
- R. Cabot, C. A. Hunter and L. M. Varley, Org. Biomol. Chem., 2010, 8, 1455–1462 RSC.
- I. R. Kleckner and M. P. Foster, Biochim. Biophys. Acta, Proteins Proteomics, 2011, 1814, 942–968 CrossRef CAS PubMed.
- K. Nikitin and R. O'Gara, Chem.–Eur. J., 2019, 25, 4551–4589 CrossRef CAS PubMed.
- C. Hansch, A. Leo and R. W. Taft, Chem. Rev., 1991, 91, 165–195 CrossRef CAS.
- W. R. Carroll, C. Zhao, M. D. Smith, P. J. Pellechia and K. D. Shimizu, Org. Lett., 2011, 13, 4320–4323 CrossRef CAS PubMed.
- C. Zhao, P. Li, M. D. Smith, P. J. Pellechia and K. D. Shimizu, Org. Lett., 2014, 16, 3520–3523 CrossRef CAS PubMed.
- E. Masson, Org. Biomol. Chem., 2013, 11, 2859–2871 RSC.
- D. C. Patel, R. M. Woods, Z. S. Breitbach, A. Berthod and D. W. Armstrong, Tetrahedron: Asymmetry, 2017, 28, 1557–1561 CrossRef CAS.
- R. J. Gillespie, J. Chem. Educ., 1963, 40, 295 CrossRef CAS.
- X. Yuan, K. Liu and C. Li, J. Org. Chem., 2008, 73, 6166–6171 CrossRef CAS PubMed.
- Y. Valadbeigi and J.-F. Gal, ACS Omega, 2018, 3, 11331–11339 CrossRef CAS PubMed.
- K. Kishikawa, K. Yoshizaki, S. Kohmoto, M. Yamamoto, K. Yamaguchi and K. Yamada, J. Chem. Soc., Perkin Trans. 1, 1997, 1233–1240 RSC.
- C. A. Hunter, Angew. Chem., Int. Ed., 2004, 43, 5310–5324 CrossRef CAS PubMed.
- P. Gilli, L. Pretto, V. Bertolasi and G. Gilli, Acc. Chem. Res., 2009, 42, 33–44 CrossRef CAS PubMed.
- B. Wang, W. Jiang, X. Dai, Y. Gao, Z. Wang and R.-Q. Zhang, Sci. Rep., 2016, 6, 22099 CrossRef CAS PubMed.
- R. W. Alder, Chem. Rev., 1989, 89, 1215–1223 CrossRef CAS.
- C. L. Perrin, Acc. Chem. Res., 2010, 43, 1550–1557 CrossRef CAS PubMed.
- C. L. Perrin, J. S. Lau, Y.-J. Kim, P. Karri, C. Moore and A. L. Rheingold, J. Am. Chem. Soc., 2009, 131, 13548–13554 CrossRef CAS PubMed.
- A. Warshel, P. K. Sharma, M. Kato, Y. Xiang, H. Liu and M. H. M. Olsson, Chem. Rev., 2006, 106, 3210–3235 CrossRef CAS PubMed.
Footnote |
| † Electronic supplementary information (ESI) available: Experimental details, compound characterization, and computational details for all calculated structures. CCDC 2003343–2003348. For ESI and crystallographic data in CIF or other electronic format see DOI: 10.1039/d0sc02806a |
| This journal is © The Royal Society of Chemistry 2020 |

