 Open Access Article
Synthesis of a three-dimensional cross-linked Ni–V2O5 nanomaterial in an ionic liquid for lithium-ion batteries
Yu Zhao *,
Dongru Gao,
Ruxin Guan,
Hongwei Li,
Ning Li,
Guixian Li and
Shiyou Li
School of Petrochemical Engineering, Lanzhou University of Technology, Lanzhou 730050, Gansu, China. E-mail: yzhao@lut.edu.cn; Fax: +86-931-7823001; Tel: +86-931-7823125
First published on 26th October 2020
Abstract
A three-dimensional cross-linked Ni–V2O5 nanomaterial with a particle size of 250–300 nm was successfully prepared in a 1-butyl-3-methylimidazole bromide ionic liquid (IL). The formation of this structure may follow the rule of dissolution–recrystallization and the ionic liquid, as both a dissolution and structure-directing agent, plays an important role in the formation of the material. After calcination of the precursor, the active material (Ni–V2O5–IL) was used as an anode for lithium-ion batteries. The designed anode exhibited excellent electrochemical performance with 765 mA h g−1 at a current density of 0.3 A g−1 after 300 cycles, which is much higher than that of a NiVO–W material prepared via a hydrothermal method (305 mA h g−1). These results show the remarkable superiority of this novel electrode material synthesized in an ionic liquid.
1. Introduction
With energy consumption increasing worldwide, there is a strong demand for efficient and advanced devices for energy conversion and storage. Lithium-ion batteries are considered to be one of the most important power sources for portable electronic equipment and electric vehicles owing to their high energy and power density, long cycle life and low self-discharge capacity.1–5Lithium-ion batteries are widely used in portable power supplies, electric vehicles and other fields,6,7 with graphite as the most commonly used commercial anode material. However, the theoretical electrode specific capacity of graphite is very low (372 mA h g−1) and cannot meet the requirements for large-scale energy storage applications, such as electric vehicles. Thus, there is an urgent need to develop anode materials with high specific capacity and a long cycle life. In this respect, transition-metal vanadate and V2O5 based materials8–10 have high specific capacity and wide potential windows owing to the multiple valence states of vanadium and the lamellar crystal structure of most metal vanadate materials, which is conducive to rapid insertion and desorption of lithium ions.11,12 Therefore, transition-metal vanadates are considered to be potential anode materials for lithium-ion batteries.13–21 The vanadate materials that have been most widely studied to date are nickel vanadate, cobalt vanadate and manganese vanadate.22–27 Among these, nickel vanadate electrode materials (e.g. Ni3V2O8 and NiV3O8) have attracted significant attention owing to their advantages, which include high specific capacity, excellent rate performance, environmental friendliness and low costs.28–30
Methods for synthesizing nickel vanadium compounds include hydrothermal, solid phase, precipitation and sol–gel approaches. Li et al. prepared a flower-like Ni3V2O8 material using a hydrothermal method at 150 °C for 5 h at pH ∼ 9 (adjusted with LiOH) for which Ni(NO3)2·6H2O and NH4VO3 were used as the raw materials.30 Kumar et al. obtained three-dimensional (3D) sea urchin-like Ni3V2O8 hollow nanospheres after calcinations at 600 °C for 2 h of a precursor, prepared using a hydrothermal method at 180 °C for 20 h with Ni(NO3)2·6H2O and NaVO4·12H2O as raw materials.31 Rogado et al. prepared Ni3V2O8 materials via solid-phase synthesis by fully mixing the raw materials and then heating them at 800 °C for 16 h in an air atmosphere.32 Sambandam et al. prepared Ni3V2O8 via a precipitation method with 2-methylimidazole as the precipitant and Ni(NO3)2·6H2O and NH4VO3 as raw materials in aqueous solution.33 Liu et al. prepared Ni3V2O8 using a sol–gel method with Ni(NO3)2·6H2O, NH4VO3, glycine and ethylene glycol as raw materials.34 However, these materials are limited by their very low specific surface area or poor morphology and low specific capacity. In addition, the hydrothermal method requires high temperature and high pressure reaction conditions. Therefore, a priority for technical progress for nickel vanadate compounds is to find a safe and simple preparation method that can produce materials with a high surface areas or a specific morphology.
Ionothermal synthesis is a new method for preparing inorganic nanomaterials. This method has many advantages over traditional hydrothermal synthesis and organic solvothermal synthesis, including mild conditions, simple operation, reaction under normal pressure and the elimination of potential safety hazards.35,36 In addition, because of the role of ionic liquids as templates, ionothermal preparation can effectively improve the specific surface area of materials synthesized. There are many types of ionic liquid. Different ionic liquids can be chosen as solvents (and as templates) to endow a synthetic material with new characteristics and applications, which opens a very broad field for the synthesis of new materials. In general, ionic liquids have stable properties and high decomposition temperatures (up to 200–300 °C), so ionothermal synthesis is more advantageous than hydrothermal approach, especially for high-temperature synthesis. In recent years, a large number of new materials with special properties have been prepared via ionic liquid thermal synthesis and have shown excellent performance in catalysis, adsorption, energy storage and other fields.
In this study, a 3D cross-linked Ni–V2O5 nanomaterial was successfully prepared in an ionic liquid (1-butyl-3-methylimidazole bromide ([Bmim]Br)) with ammonium metavanadate as the vanadium source and nickel nitrate as the nickel source. After calcination, the new synthetic material was used as an anode material for lithium-ion batteries and exhibited good electrochemical performance. The specific capacity of the new anode material was much higher than that of an anode material prepared using a traditional hydrothermal method or solid phase method, and the 3D cross-linked special morphology was obtained by carefully adjusting the reaction process conditions. In addition, the progress of ionothermal synthesis was carried out just under normal pressure, which makes the process more safe and simple. All the above thereby highlights the significant advantages of this synthesis method.
2. Experimental
2.1 Sample preparation
The ionic liquid [Bmim]Br was prepared according to the method described by Parnham and Morris.37The NiVO precursor was prepared in a three-neck flask using [Bmim]Br as the solvent and template, Ni(NO3)2·6H2O as the nickel source and NH4VO3 as the vanadium source. Specifically, 4.362 g (0.015 mol) of Ni(NO3)2·6H2O and 1.17 g (0.01 mol) of NH4VO3 were dissolved in 87.68 g (0.4 mol) of [Bmim]Br, and stirred at 80 °C for 2 h to obtain a clear solution. Then, the temperature of the solution was raised to 180 °C and maintained for 72 h under stirring. After the reaction, the solution was cooled to room temperature naturally and the precipitate obtained was filtered and washed thoroughly with deionized water and anhydrous ethanol. The solid sample was further dried at 70 °C for 12 h in a vacuum oven and was denoted as Ni–V2O5–IL-pre with the yield of about 98% based on the vanadium species. The effect of the reaction temperature was investigated by analyzing samples obtained at reaction temperatures of 120, 140, 160 and 180 °C for 72 h. In addition, the effect of reaction time was studied. Samples obtained after reaction times of 12, 24, 36, 48, 60 and 72 h at 180 °C were analyzed to gain an insight into the formation process underlying the sample morphology.
For comparison, a NiVO sample (denoted as NiVO–W-pre) was prepared via a hydrothermal method in a Teflon-lined autoclave using the same synthesis conditions and post-treatments as for Ni–V2O5–IL-pre.
The NiVO precursors obtained (Ni–V2O5–IL-pre and NiVO–W-pre) were calcined in air at 500 °C for 4 h to obtain the final electrode materials for the electrode tests and were denoted as Ni–V2O5–IL and NiVO–W, respectively.
2.2 Sample characterization
Scanning electron microscopy (SEM) was carried out using a JEOL-JSM-6700F electron microscope. The samples were coated with gold using a sputter coater and an energy-dispersive X-ray spectrometer (EDX) attachment was employed.The average oxidation states of vanadium and nickel in the samples were studied by X-ray photoelectron spectroscopy (XPS) using a Thermo ESCALAB 250 spectrometer with monochromatic Al Kα radiation (hν = 1486.6 eV) operating at 150 W with a 500 μm diameter analysis area and a pass energy of 20 eV. The binding energies for sample charging were calibrated using the C 1s peak at 284.8 eV.
N2 adsorption–desorption measurements were carried out at −196 °C using a Micromeritics Gemini V 2380 autosorption analyzer. The specific surface area was calculated according to the Brunauer–Emmett–Teller (BET) equation and pore distributions were obtained using the Barrett–Joyner–Halenda (BJH) method. Samples were degassed in flowing N2 at 200 °C for 5 h before measurements.
X-ray diffraction (XRD) patterns were obtained on a Shimadzu XRD-6000 powder diffractometer (Japan) using Cu Kα radiation (λ = 0.1541 nm). The 2θ scan range was 10°–80° with a step size of 0.02°.
The chemical composition of the samples was analyzed using an ARL-9800 X-ray fluorescence spectrometer (XRF) to confirm the EDX results.
2.3 Electrochemical measurements
The electrochemical performance of Ni–V2O5–IL and NiVO–W was characterized using CR2032-type coin cells. The active material (Ni–V2O5–IL or NiVO–W), acetylene black and a binder (poly(vinyl difluoride)) were uniformly dispersed in 1-methyl-2-pyrrolidone at a mass ratio of 70![[thin space (1/6-em)]](https://www.rsc.org/images/entities/char_2009.gif) :
:![[thin space (1/6-em)]](https://www.rsc.org/images/entities/char_2009.gif) 15
15![[thin space (1/6-em)]](https://www.rsc.org/images/entities/char_2009.gif) :
:![[thin space (1/6-em)]](https://www.rsc.org/images/entities/char_2009.gif) 15 to make the electrode material. Ni–V2O5–IL or NiVO–W was used as the test electrode, lithium metal foil was used as the counter electrode and a polypropylene membrane (Celgard 2400) as the separator. The electrolyte was prepared in a glove box filled with high-purity argon using 1 mol L−1 LiPF6 in a mixed solution of ethylene carbonate and diethyl carbonate (volume ratio 1
15 to make the electrode material. Ni–V2O5–IL or NiVO–W was used as the test electrode, lithium metal foil was used as the counter electrode and a polypropylene membrane (Celgard 2400) as the separator. The electrolyte was prepared in a glove box filled with high-purity argon using 1 mol L−1 LiPF6 in a mixed solution of ethylene carbonate and diethyl carbonate (volume ratio 1![[thin space (1/6-em)]](https://www.rsc.org/images/entities/char_2009.gif) :
:![[thin space (1/6-em)]](https://www.rsc.org/images/entities/char_2009.gif) 1). The CR2032 coin cell battery was charged and discharged at constant current using a LAMBO BT2018A battery test system (Wuhan, China). Cyclic voltammetry (CV) curves and electrochemical impedance were measured using a CHI660D electrochemical workstation (Shanghai Chenhua Instrument Co., China). All measurements were carried out at room temperature.
1). The CR2032 coin cell battery was charged and discharged at constant current using a LAMBO BT2018A battery test system (Wuhan, China). Cyclic voltammetry (CV) curves and electrochemical impedance were measured using a CHI660D electrochemical workstation (Shanghai Chenhua Instrument Co., China). All measurements were carried out at room temperature.
3. Results and discussion
3.1 Sample morphology
The morphology of samples synthesized at different reaction temperatures (120, 140, 160, and 180 °C, all for 72 h) was observed from SEM images. The results show that when the reaction was carried out at 120 °C, no solid was obtained. For reaction at 140 °C, particles with a uniform size were obtained (Fig. 1(a)). When the reaction was carried out at 160 °C, a large amount of 3D cross-linked products was produced; however, a certain number of particles were still present (Fig. 1(b)). When the temperature was further raised to 180 °C, uniform 3D cross-linked products were obtained with a particle size of 200–500 nm (Fig. 1(c) and (d)). Therefore, the best temperature for synthesis was identified as 180 °C and this was used for all subsequent experiments.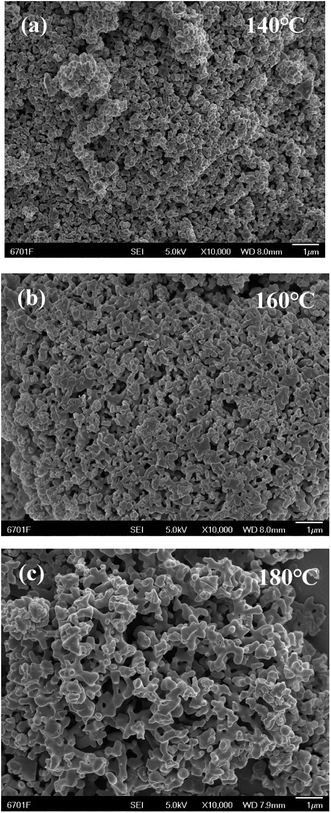 | ||
| Fig. 1 SEM images of as-prepared samples through ionothermal method at (a) 140, (b) 160 and (c) 180 °C. | ||
The morphology was then compared for samples synthesized via the ionothermal and hydrothermal methods at a reaction temperature of 180 °C. The results show that the NiVO–W-pre prepared via hydrothermal synthesis in aqueous solution had a large irregular shape and a much greater size than Ni–V2O5–IL-pre (Fig. 2). Thus, the template orientation of the ionic liquid played an important role in the morphology of the synthetic product. In addition, the ionothermal method involves atmospheric conditions, which is highly advantageous.
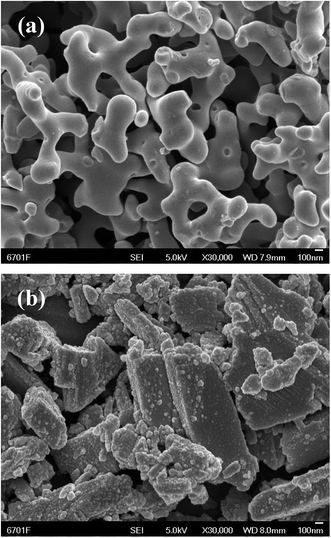 | ||
| Fig. 2 SEM images of as-prepared samples through (a) ionothermal method and (b) hydrothermal method at 180 °C. | ||
3.2 Formation mechanism underlying the sample morphology
To gain an insight into the mechanism underlying the formation of the 3D cross-linked coralline morphology, the effects of the reaction time (12, 24, 36, 48, 60, and 72 h) at a synthesis temperature of 180 °C were studied. The results are shown in Fig. 3. It can be seen that at 12 h, the product mainly consists of large particles. At 24 h, some particles have become smooth on the surface and changed to coral antennae, but the majority are still large particles. At 36–48 h, some parts have formed 3D cross-linked coralline structures, but there are still many irregular large particles. Finally, by 60–72 h, most of the product has developed into a 3D cross-linked coralline structure with a smooth surface and uniform morphology. The results suggest that the formation follows a dissolution–recrystallization process,38 in which the ionic liquid plays a role in controlling the growth of the morphology.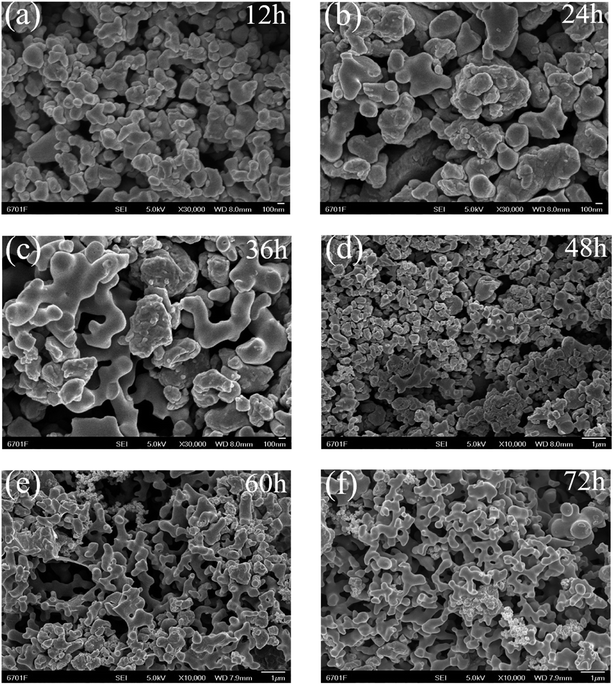 | ||
| Fig. 3 SEM images of as-prepared samples through ionothermal method at 180 °C for different reaction times of (a) 12, (b) 24, (c) 36, (d) 48, (e) 60 and (f) 72 h. | ||
The effect of temperature has also been examined and provides support for the proposed dissolution–crystallization mechanism. At low temperature, the solid matter dissolved but no crystallization reaction occurs. As the temperature increases, crystallization occurs but the energy is not sufficient for the formation of a specific shape, so uniform and irregular particles were observed. With a further increase in temperature and thus in energy, the particles could form 3D cross-linked coral-like products.
Therefore, from the results for the influence of the reaction time and temperature, it can be inferred that a dissolution–crystallization mechanism is responsible for the sample morphology.
3.3 Sample composition
The composition of the materials was studied using EDX and XRF methods. EDX data for Ni–V2O5–IL and NiVO–W after calcination of the precursors are shown in Fig. 4. The results show that the Ni–V2O5–IL sample was mainly composed of vanadium and oxygen, with only a small amount of nickel. The content of Ni, V and O was 0.96, 57.90 and 41.14 wt%, respectively. In contrast, EDX analysis of the NiVO–W showed that it contained Ni, V and O at 23.69, 44.41 and 34.91 wt%, respectively. The results show that elemental deposition differed greatly between the hydrothermal and ionothermal methods, in addition to the significant differences in morphology. In water, significant deposition of Ni in addition to V and O could occur, while in the ionic liquid, vanadium oxide was the main component and only a small amount of nickel was deposited. XRF analysis of Ni–V2O5–IL revealed 0.47, 55.64 and 43.89 wt% for Ni, V and O, respectively, which is essentially consistent with the EDX results.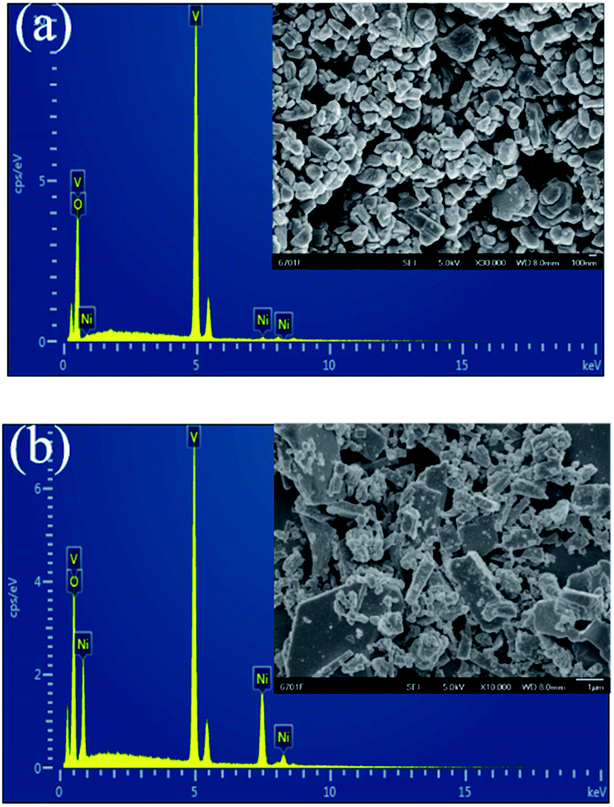 | ||
| Fig. 4 The EDX element content diagrams for the samples after calcinations of (a) Ni–V2O5–IL and (b) NiVO–W. Inset shows the corresponding SEM images. | ||
Considering that the composition of the Ni–V2O5–IL was basically vanadium oxide, synthesis of V2O5 with addition of the vanadium source alone into the ionic liquid was also carried out. However, no solid formation occurred in the synthesis system, so addition of nickel to the reaction mixture was an important condition for synthesis of the 3D cross-linked coralline Ni–V2O5, even though the material contained only a small amount of Ni-doped vanadium oxide.
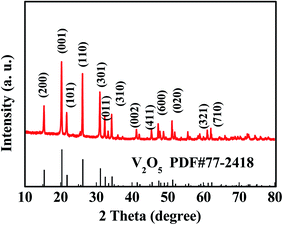
The Ni–V2O5–IL phases were determined via XRD analysis and Fig. 5 shows the XRD pattern. The diffraction peaks at 15.4, 20.3, 21.7, 26.2, 31.0, 32.4, and 34.3° corresponded to the (200), (001), (101), (110), (301), (011), and (310) crystal planes, respectively, of the V2O5 standard spectrum (JCPDS PDF77-2418). The sharp diffraction peaks indicate that the product had good crystallinity and the XRD pattern is almost consistent with the standard spectrum, indicating that the main component of the product was V2O5. Owing to the low nickel content, XRD did not reveal any information regarding nickel. Therefore, the material was denoted as Ni–V2O5–IL.
3.4 N2 adsorption–desorption measurements
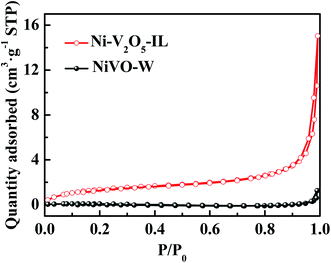
BET surface area and BJH pore distribution results for the samples were obtained from N2 adsorption–desorption measurements at 77 K. Fig. 6 shows N2 adsorption–desorption curves for Ni–V2O5–IL and NiVO–W. Both samples exhibited type II isotherms, indicating almost no pores in the materials. The BET specific surface areas of Ni–V2O5–IL and NiVO–W were ∼5 and 0.25 m2 g−1, respectively. The specific surface area was much higher for Ni–V2O5–IL than for NiVO–W, but owing to the large size of the 3D cross-linking structure, the specific surface area of Ni–V2O5–IL was not particularly high.3.5 XPS analysis
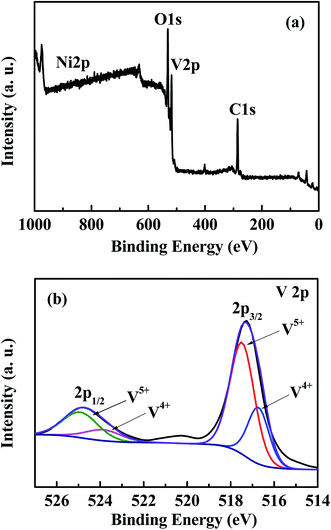
The chemical composition and oxidation state of each element in Ni–V2O5–IL were investigated using XPS analysis. Fig. 7(a) shows the full XPS spectrum. Four characteristic peaks can be observed at 285.5, 517.6, 531.6, and 856 eV, corresponding to C 1s, V 2p, O 1s, and Ni 2p orbitals, respectively. In this case the carbon was the external calibration standard and was not a component of the sample. Owing to the low content of nickel, the corresponding peak intensity was very weak, which is consistent with the element analysis results. Fig. 7(b) shows the fitting peak of the V 2p map for Ni–V2O5–IL. Two typical peaks at 517.3 and 524.8 eV at the center were observed, which corresponded to the 2p3/2 and 2p1/2 orbitals of vanadium, respectively. The peak fitted at ∼517.6 eV can be ascribed to V5+ 2p3/2 and the peak at 516.7 eV to V4+ 2p3/2.29,39 Thus, there was mainly V5+ and a small amount of V4+ in the Ni–V2O5–IL sample simultaneously, which is consistent with the reported literature.403.6 Electrochemical performance
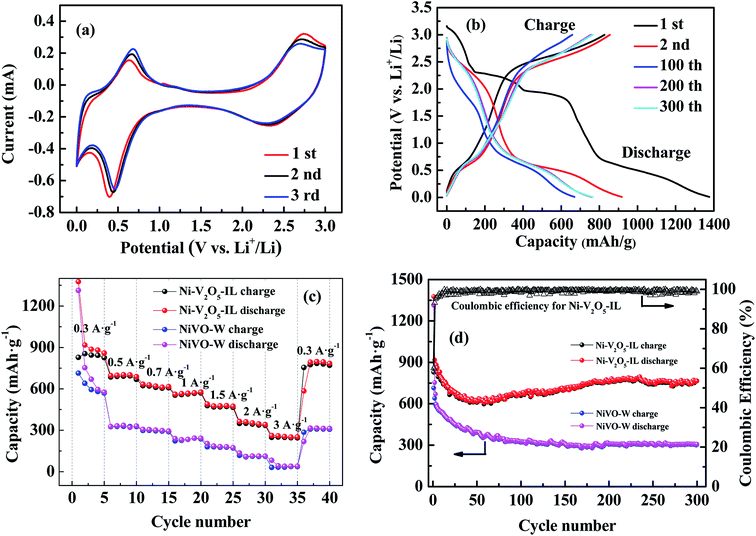
The prepared materials were used as anodes for lithium-ion batteries and assembled into button cells (CR2032) for electrochemical testing. Fig. 8(a) shows the first three CV curves for the Ni–V2O5–IL electrode in the potential window 0.01–3 V (vs. Li+/Li) at a scan rate of 0.5 mV s−1. For the first discharge process, two sharp reduction peaks for the Ni–V2O5–IL electrode were observed near 2.34 and 0.4 V, which can probably be attributed to Li+ intercalation into Ni–V2O5–IL.13,29,41 For the first charge process, there are also two obvious oxidation peaks at 0.63 and 2.74 V, corresponding to the process of lithium removal from Ni–V2O5–IL.30,42 For the process after the first cycle, the CV curves basically coincided (except for a little shift towards the high voltage region, probably due to the slight changes in the morphology or crystallinity of the anode during the charge–discharge process28,43), indicating that lithium-ion insertion, removal reversibility and cycle stability were good.Fig. 8(b) shows representative curves for five charge–discharge cycles for the Ni–V2O5–IL electrode at a current density of 0.3 A g−1. The first discharge and charge capacities of Ni–V2O5–IL were 1376.06 and 827.49 mA h g−1, respectively, and the Coulomb efficiency was 60.1%. As cycling continues, the Coulomb efficiency gradually increased to 98% after five cycles. However, the specific capacity of the charge–discharge electrode decreased first and then increased slowly. At the 100th cycle, the discharge and charge capacities of Ni–V2O5–IL were 668.23 and 658.34 mA h g−1, while at the 300th cycle, these increased to 765.03 and 764.90 mA h g−1, respectively. The capacity loss in the initial cycle may be mainly because of the irreversible phase transition and the formation of a solid electrolyte interphase (SEI) in the first cycle.13,44,45 The reversible capacity then increased gradually, which may be attributed to the gradual interaction between lithium ions and Ni–V2O5–IL from the surface to the interior.18,46 In addition, this phenomenon was usually attributed to the possible activation process in the electrode and reversible formation/decomposition of the SEI film.40
To evaluate the rate performance of Ni–V2O5–IL and NiVO–W, further charge–discharge tests were carried out by gradually increasing the current from 0.3 to 3 A g−1 and then back to 0.3 A g−1. The results are shown in Fig. 8(c). Compared with NiVO–W, Ni–V2O5–IL showed better rate performance. When the current density was increased from 0.3 to 0.5, 0.7, 1, 1.5, 2, 3 and then back to 0.3 A g−1, the Ni–V2O5–IL electrode provided 827.5, 685.5, 623.6, 553.5, 478.5, 349.1, 248.1 and 745.6 mA h g−1, respectively, while the NiVO–W electrode provided 713.8, 325.6, 298.5, 223.3, 179.8, 117.4, 31.0, and only 285.6 mA h g−1, respectively. It should be noted that the reversible capacity of the Ni–V2O5–IL electrode recovered to more than 740 mA h g−1 when the current density was restored to 0.3 A g−1, indicating that the Ni–V2O5–IL electrode had good reversibility and rate ability. The rate performance of Ni–V2O5–IL was much higher than that of NiVO–W, probably due to the reason that Ni–V2O5–IL had a smaller particle size, which would shorten the lithium transport path and improved the lithium transport rate.
The 300 charge–discharge cycles of Ni–V2O5–IL and NiVO–W at 0.3 A g−1 are shown in Fig. 8(d). On the first charge, the specific capacity of Ni–V2O5–IL and NiVO–W was 827.5 and 713.88 mA h g−1, respectively. After 300 cycles, the specific capacity of Ni–V2O5–IL was still retained at 765.0 mA h g−1, while that of NiVO–W was only 304.7 mA h g−1, corresponding to the retention rates of 92.45% and 42.68%, respectively. In the 2–60th cycle, the load-carrying capacity of the Ni–V2O5–IL material decreased slightly and then increased gradually. This phenomenon of increasing capacity may be due to the reversible formation of a polymer gel film from decomposition of the electrolyte47 and a possible activation process in the electrode.48,49 Compared with the NiVO–W material, the reversible specific capacity of Ni–V2O5–IL was much larger. The reason for this may be that the particle size of the Ni–V2O5–IL material synthesized in ionic liquid was smaller and the specific surface area and gap were larger, which could fully slow down the volume expansion of electrode materials during the charge–discharge progress and improve the electrochemical properties of the electrode material. In addition, the Coulomb efficiency increased significantly from 60.1% to nearly 100% after 300 cycles, indicating good cycle stability for the Ni–V2O5–IL electrode.
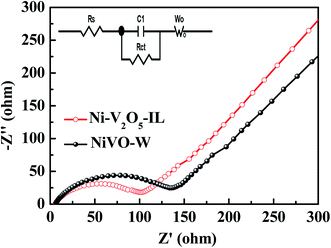
AC impedance is an important electrochemical measurement method that can be used to study the electrolyte impedance, charge transfer impedance and diffusion impedance of lithium ions in electrode materials. AC impedance diagrams for the Ni–V2O5–IL and NiVO–W electrodes are shown in Fig. 9. The two samples exhibited similar Nyquist curves, which were composed of semicircles in the high and intermediate frequency regions and an oblique line in the low frequency region. In general, the intercept on the Z′ axis in the high frequency region represents the ohmic impedance (RS) of the electrolyte. The RS values for Ni–V2O5–IL and NiVO–W were 6.01 and 6.86 Ω, respectively. The semicircle diameter in the intermediate frequency region represents the charge transfer impedance (RCT) and the RCT of Ni–V2O5–IL and NiVO–W was 102.3 and 135.6 Ω, respectively. The oblique line in the low-frequency region represents the Warburg impedance (ZW), which is related to the diffusion ability of lithium ions in the electrode material. The larger the slope, the higher is lithium-ion diffusion. Therefore, the results show that the lithium-ion diffusion was significantly higher in Ni–V2O5–IL than in NiVO–W. In conclusion, RS, RCT and ZW values were better for Ni–V2O5–IL than for NiVO–W, which is consistent with the electrochemical test results. The results show that the electrochemical performance of Ni–V2O5–IL prepared in ionic liquid as a solvent was excellent.
4. Conclusions
Nickel-doped V2O5 with a unique 3D cross-linked coralline structure was successfully prepared via an ionothermal synthesis method. In comparison, nickel vanadate obtained via hydrothermal synthesis under the same conditions had an irregular bulk morphology and a much larger particle size. Active Ni–V2O5–IL prepared via calcination of the precursor was used as an anode material for lithium-ion batteries and showed excellent electrochemical performance. At a current density of 0.3 A g−1, the specific capacity of Ni–V2O5–IL remained at 765.0 mA h g−1 after 300 cycles, while that of the NiVO–W material prepared hydrothermally was only 304.7 mA h g−1, which demonstrates the remarkable superiority of the novel electrode material synthesized in ionic liquid. This material prepared via a simple and safe synthesis method has the advantages of high reversible capacity and excellent cycle stability, and thus has significant potential as a high-performance anode material for lithium-ion battery.Conflicts of interest
There are no conflicts to declare.Acknowledgements
Financial support from the National Natural Science Foundation of China (21763016) and the Industrial Support Program for Colleges and Universities in Gansu Province (2020C-06) is acknowledged.References
- J. M. Tarascon and M. Armand, Nature, 2001, 414, 359–367 CrossRef CAS.
- M. Armand and J. M. Tarascon, Nature, 2008, 451, 652–657 CrossRef CAS.
- B. Scrosati and G. Jürgen, J. Power Sources, 2010, 195, 2419–2430 CrossRef CAS.
- Y. X. Wang, B. Liu, Q. Y. Li, S. Cartmell, S. Ferrara, Z. Q. D. Deng and J. Xiao, J. Power Sources, 2015, 286, 330–345 CrossRef CAS.
- Y. X. Tang, Y. Y. Zhang, W. L. Li, B. Ma and X. D. Chen, Chem. Soc. Rev., 2015, 44, 5926–5940 RSC.
- H. Hu, L. Yu, X. H. Gao, Z. Lin and X. W. Lou, Energy Environ. Sci., 2015, 8, 1480–1483 RSC.
- Y. M. Chen, X. Y. Li, K. Park, J. Song, J. H. Hong, L. M. Zhou, Y. W. Mai, H. T. Huang and J. B. Goodenough, J. Am. Chem. Soc., 2013, 135, 16280–16283 CrossRef CAS.
- X. Y. Liu, J. H. Zeng, H. N. Yang, K. Zhou and D. Pan, RSC Adv., 2018, 8, 4014–4031 RSC.
- S. Gautam, A. Kumar, V. K. Vashistha and D. K. Das, Nano LIFE, 2020, 10, 2050003 CrossRef.
- X. L. Ren, D. S. Ai, R. T. Lv, F. Y. Kang and Z. H. Huang, Electrochim. Acta, 2020, 336, 135723 CrossRef CAS.
- J. C. Zhang, B. Q. Yuan, S. F. Cui, N. N. Zhang, J. J. Wei, X. Wang, D. J. Zhang, R. C. Zhang and Q. S. Huo, Dalton Trans., 2017, 46, 3295–3302 RSC.
- L. Zhang, K. N. Zhao, Y. Z. Luo, Y. F. Dong, W. W. Xu, M. Y. Yan, W. H. Ren, L. Zhou, L. B. Qu and L. Q. Mai, ACS Appl. Mater. Interfaces, 2016, 8, 7139–7146 CrossRef CAS.
- G. Z. Yang, H. Cui, G. W. Yang and C. X. Wang, ACS Nano, 2014, 8, 4474–4487 CrossRef CAS.
- S. B. Ni, J. J. Ma, X. H. Lv, X. L. Yang and L. L. Zhang, J. Mater. Chem. A, 2014, 2, 8995–8998 RSC.
- G. Z. Yang, S. Y. Li, M. M. Wu and C. X. Wang, J. Mater. Chem. A, 2016, 4, 10974–10985 RSC.
- M. L. Li, Y. Gao, N. Chen, X. Meng, C. Z. Wang, Y. Q. Zhang, D. Zhang, Y. J. Wei, F. Du and G. Chen, Chem.–Eur. J., 2016, 22, 11405–11412 CrossRef CAS.
- R. Sahoo, T. H. Lee, D. T. Pham, T. H. T. Luu and Y. H. Lee, ACS Nano, 2019, 13, 10776–10786 CrossRef CAS.
- L. H. Gan, D. R. Deng, Y. J. Zhang, G. Li, X. Y. Wang, L. Jiang and C. R. Wang, J. Mater. Chem. A, 2014, 2, 2461–2466 RSC.
- S. C. Sekhar, G. Nagaraju, D. Narsimulu, B. Ramulu, S. K. Hussain and J. S. Yu, ACS Appl. Mater. Interfaces, 2020, 12, 27074–27086 CrossRef.
- Y. Lu, J. W. Nai and X. W. Lou, Angew. Chem., Int. Ed., 2018, 57, 2899–2903 CrossRef CAS.
- F. Y. Cheng and J. Chen, J. Mater. Chem., 2011, 21, 9841–9848 RSC.
- F. Gong, D. W. Xia, C. Bi, J. Yang, W. Zeng, C. Chen, Y. L. Ding, Z. Q. Xu, J. X. Liao and M. Q. Wu, Electrochim. Acta, 2018, 264, 358–366 CrossRef CAS.
- C. Zhu, Z. Q. Liu, J. Wang, J. Pu, W. L. Wu, Q. W. Zhou and H. G. Zhang, Small, 2017, 13, 1260–1269 Search PubMed.
- Q. Zhang, J. Pei, G. Chen, C. F. Bie, D. H. Chen, Y. Jiao and J. C. Rao, Electrochim. Acta, 2017, 238, 227–236 CrossRef CAS.
- F. Gong, Q. Zhou, J. H. Liu, D. D. Wang, S. L. Wu and D. W. Xia, Energy Fuels, 2020, 34, 7616–7621 CrossRef CAS.
- D. R. Deng, Y. J. Zhang, G. Li, X. Y. Wang, L. H. Gan, L. Jiang and C. R. Wang, Chem.–Asian J., 2014, 9, 1265–1269 CrossRef CAS.
- H. Chai, Y. C. Wang, Y. C. Fang, Y. Lv, H. Dong, D. Z. Jia and W. Y. Zhou, Chem. Eng. J., 2017, 326, 587–593 CrossRef CAS.
- S. B. Ni, J. J. Ma, J. C. Zhang, X. L. Yang and L. L. Zhang, Chem. Commun., 2015, 51, 5880–5882 RSC.
- Y. Li, L. B. Kong, M. C. Liu and L. Kang, RSC Adv., 2016, 6, 90197–90205 RSC.
- Y. Li, L. B. Kong, M. C. Liu, W. B. Zhang and L. Kang, Mater. Lett., 2017, 186, 289–292 CrossRef CAS.
- R. Kumar, P. Rai and A. Sharma, J. Mater. Chem. A, 2016, 4, 9822–9831 RSC.
- N. Rogado, G. Lawes, D. A. Huse, A. P. Ramirez and R. J. Cava, Solid State Commun., 2002, 124, 229–233 CrossRef CAS.
- B. Sambandam, V. Soundharrajan, J. J. Song, S. Kim, J. Jo, D. T. Pham, S. Kim, V. Mathew, K. H. Kim, Y. K. Sun and J. Kim, J. Electroanal. Chem., 2018, 810, 34–40 CrossRef CAS.
- F. M. Liu, R. Z. Sun, Y. H. Guan, X. Y. Cheng, H. Zhang, Y. Z. Guan, X. S. Liang, P. Sun and G. Y. Lu, Sens. Actuators, B, 2015, 210, 795–802 CrossRef CAS.
- E. R. Cooper, C. D. Andrews, P. S. Wheatley, P. B. Webb, P. Wormald and R. E. Morris, Nature, 2004, 430, 1012–1016 CrossRef CAS.
- G. M. Wang, M. Valldor, K. V. Dorn, M. Wilk-Kozubek, V. Smetana and A. V. Mudring, Chem. Mater., 2019, 31, 7329–7339 CrossRef CAS.
- E. R. Parnham and R. E. Morris, Chem. Mater., 2006, 18, 4882–4887 CrossRef CAS.
- H. X. Mai, L. D. Sun, Y. W. Zhang, R. Si, W. Feng, H. P. Zhang, H. C. Liu and C. H. Yan, J. Phys. Chem. B, 2005, 109, 24380–24385 CrossRef CAS.
- C. Wang, D. Fang, H. E. Wang, Y. H. Cao, W. L. Xu, X. Q. Liu, Z. P. Luo, G. Z. Li, M. Jiang and C. X. Xiong, Sci. Rep., 2016, 6, 20826–20834 CrossRef CAS.
- C. Lv, J. X. Sun, G. Chen, C. S. Yan and D. H. Chen, Nano Energy, 2017, 33, 138–145 CrossRef CAS.
- F. F. Wu, C. H. Yu, W. X. Liu, T. Wang, J. K. Feng and S. L. Xiong, J. Mater. Chem. A, 2015, 3, 16728–16736 RSC.
- J. Q. Liu, M. B. Zheng, X. Q. Shi, H. B. Zeng and H. Xia, Adv. Funct. Mater., 2016, 26, 919–930 CrossRef CAS.
- F. Gong, D. W. Xia, Q. Zhou, J. X. Liao and M. Q. Wu, J. Alloys Compd., 2018, 766, 442–449 CrossRef CAS.
- S. B. Ni, J. J. Ma, J. C. Zhang, X. L. Yang and L. L. Zhang, J. Power Sources, 2015, 282, 65–69 CrossRef CAS.
- A. Kumarasiri and G. Lawes, Phys. Rev. B: Condens. Matter Mater. Phys., 2011, 84, 064447 CrossRef.
- V. Soundharrajan, B. Sambandam, J. J. Song, S. Kim, J. Jo, S. Kim, S. Lee, V. Mathew and J. Kim, ACS Appl. Mater. Interfaces, 2016, 8, 8546–8553 CrossRef CAS.
- S. Grugeon, S. Laruelle, L. Dupont and J. M. Tarascon, Solid State Sci., 2003, 5, 895–904 CrossRef CAS.
- S. B. Ni, X. H. Lv, J. J. Ma, X. L. Yang and L. L. Zhang, J. Power Sources, 2014, 270, 564–568 CrossRef CAS.
- S. B. Ni, X. H. Lv, T. Li, X. L. Yang, L. L. Zhang and Y. Ren, Electrochim. Acta, 2013, 96, 253–260 CrossRef CAS.
| This journal is © The Royal Society of Chemistry 2020 |

