 Open Access Article
Fabrication of an antimony doped tin oxide–graphene nanocomposite for highly effective capacitive deionization of saline water†
Long Rena,
Bin Xub,
Guodong Wanga,
Xiaoshuang Yina,
Ying Liua,
Wenzhong Yang *a and
Yun Chen
 *a
*a
aSchool of Chemistry and Molecular Engineering, Nanjing Tech University, No. 30 Puzhu Road (S), Nanjing 211816, China. E-mail: yangwznjtech@163.com; ychen@njtech.edu.cn; Tel: +86-25-58139475
bNanjing Institute of Environmental Sciences, Ministry of Ecology and Environmental of the People's Republic of China, No. 8 Jiangwangmiao Street, Nanjing 210042, China
First published on 26th October 2020
Abstract
In this study, antimony doped tin oxide loaded reduced graphene oxide (ATO–RGO) nanocomposites were synthesized via a facile hydrothermal approach. As a typical N-type semiconductor, the ATO in the composite can enhance the conductivity between graphene sheets, thus improving the specific capacitance and electrosorption performance. Under the optimal conditions, the largest surface area was 445.2 m2 g−1 when the mass content of ATO in the nanocomposite was 20 wt%. The synthesized optimal ATO–RGO electrode displayed excellent specific capacity (158.2 F g−1) and outstanding electrosorptive capacity (8.63 mg g−1) in sodium chloride solution, which were much higher than the corresponding results of pristine graphene (74.3 F g−1 and 3.98 mg g−1). At the same applied voltage, electrosorption capacity and charge efficiency of the ATO–RGO (20 wt%) material were better than those of reported carbon materials in recent years.
Introduction
Capacitive deionization (CDI), an electro-sorption technology, has been developed as a promising method for removing salt ions due to its low energy consumption, high removal efficiency and small environmental impact.1,2 The mechanism of CDI is similar to that of energy storage in supercapacitors. It adsorbs salt ions through electrical double layers (EDLs) by electrostatic force formed from the oppositely charged electrodes.3,4 To enhance the performance of desalination, the electrodes of a CDI unit are usually made of porous materials which possess large surface area and excellent electrical conductivity.5In recent years, various carbon materials possessing extended surface area and reasonable porous structure have been investigated as CDI electrodes, since porous carbon materials can provide plenty of channels to accommodate ions.6 Especially, activated carbon,7,8 carbon nanotubes,9,10 mesoporous carbon,11,12 carbon aerogel13,14 and their composites represent the most attractive CDI electrode materials.15 Besides the aforementioned carbon materials, graphene, a two dimensional sheet with sp2-hybridized carbon material, is also widely considered in this field.16–18 Furthermore, graphene sheets can be easily self-assembled into 3D networks which could not only offer a large number of accessible open pores to salt ions in solution, but also act as the template for the growth of functionalized nanoparticles.19–21 However, because of the van der Waals forces between the pristine graphene sheets, the aggregation of graphene is irreversible during the reduction process, which leads to a frail pore structure and the low specific surface area.22 As a result, it would bring down the desalination performance of CDI electrodes.7 To alleviate this problem, incorporating nanoparticles or composites with good distribution into graphene sheets is widely applied to prevent graphene sheets from agglomeration.23,24 In the past few years, the researchers have found that the incorporation of metal oxides could significantly improve the electro-sorption capacity of graphene-based electrode materials.25 Several metal oxides have been successfully investigated such as MnO2,26 Fe3O4,27 TiO2 (ref. 28) and SnO2,29 and the electrodes made of these composite materials have shown the superior electro-sorption capacity than that of pristine graphene.30
Although the incorporation of metal oxides can prevent graphene sheets from aggregation, metal oxides have their own limitations.31 The main defect is that the incorporation of metal oxides would hamper the conductivity of the composite materials.2 Compared to the pure metal oxide, doping metal oxides could make up for the defect to a certain extent like N-type or P-type semiconductor.29,32 Among them, N-type semiconductor can improve the ion removal rate by changing zeta potential on the surface of electrode,33 which attracts the attention of researchers. Antimony-doped tin oxide (ATO), an N-type semiconductor, is an important member of transparent conductive oxides.34,35 It has good chemical, mechanical and environmental stabilities, especially the electron storage capacity and conductivity.36–38
Herein, to the best of our knowledge, ATO nanoparticles was firstly successfully incorporated into reduced graphene oxide (RGO) via a facile hydrothermal method and fabricated as electrodes for CDI unit. The intercalation of ATO nanoparticles can not only increase the layer spacing among graphene sheets, which plays a vital role to enlarge the contact area between graphene sheets and salt ions, but also promote the electron transfer rate among graphene sheets, as ATO is a N-type semiconductor in which Sb5+ replaced the location of Sn4+ in the tin oxide lattice to increase the quantity of electron and elevate the conductivity. Various ATO–RGO nanoparticles were fabricated by adjusting the loading amount of metal chloride, and their electrochemical properties were investigated to figure out the optimal ratio between ATO and RGO. It was found that the electrochemical properties reach to the maximum value when the weight percentage of ATO was 20% in ATO–RGO, and the electro-sorption capacity was twice as high as that of RGO.
Experimental section
Synthesis of ATO–RGO composite
ATO–RGO was synthesized by hydrothermal method as follows: firstly, 0.1 g graphene oxide (GO) powder, which was prepared as shown in ESI,† was dissolved in 100 mL ethanol and sonicated for 3 h. Specific amount of SnCl2·2H2O and SbCl3 were dissolved in ethanol to form 15 mg mL−1 and 1.5 mg mL−1 solution, respectively. Next, SnCl2 solution was added into GO solution and then a slight amount of NH3·H2O was added. After this, SbCl3 solution was supplemented into the above-mentioned solution. A series volume of SnCl2 and SbCl3 with the same ratio (1![[thin space (1/6-em)]](https://www.rsc.org/images/entities/char_2009.gif) :
:![[thin space (1/6-em)]](https://www.rsc.org/images/entities/char_2009.gif) 1) were added into the GO solution to prepare the products occupied with various weight percentages of ATO. The solutions were sonicated for 30 min. Then, the solutions were transformed into the autoclaves and treated by a hydrothermal process at 180 °C for 12 h. After cooling down to the room temperature, the ATO–RGO hydrogel was washed with DI water for several times, then the final product was treated by freeze-drying.
1) were added into the GO solution to prepare the products occupied with various weight percentages of ATO. The solutions were sonicated for 30 min. Then, the solutions were transformed into the autoclaves and treated by a hydrothermal process at 180 °C for 12 h. After cooling down to the room temperature, the ATO–RGO hydrogel was washed with DI water for several times, then the final product was treated by freeze-drying.
Electrochemical properties
Traditional three electrode system was used in this study, glass carbon electrode, platinum wire electrode and saturated calomel electrode (SCE) were acted as working electrode, counter electrode and reference electrode, respectively. Electrochemical Impedance Spectroscopy (EIS), cyclic voltammetry (CV) measurements and galvanostatic charge–discharge (GC) measurements were carried out in 1 M NaCl electrolyte solutions. To test the specific capacitance, the sweep potential range of CV and GC was adjusted from −0.4 to 0.6 V. The specific capacity was calculated by the equations in the ref. 10 and 26.CDI experiment
The electrode was prepared by coating graphite paper by a paste of the synthesized materials (90 wt%) with polytetrafluoroethylene (10 wt%) as a binder and ethanol as a solvent, then the electrode was dried at 60 °C overnight. Each electrode was loaded with an exact 90 mg of materials. The CDI experiments were investigated by batch-mode electrosorption experiments with a continuously recycling system.39 In each experiment, the analytical pure NaCl solution with a volume of 50 mL was employed as the target solution and the flow rate was 90 mL min−1. A direct voltage of 1.2 V was applied on the opposite electrodes. The initial conductivity of NaCl solution was 55 μS cm−1 and the solution temperature was kept at 298 K.28 The relationship between conductivity and concentration was obtained according to a calibration table made prior to the experiment.40 The concentration variation was continuously monitored and measured at the outlet of the unit cell by using an ion conductivity meter. The salt removal efficiency (η) and the electro-sorption capacity (Γ, mg g−1) of the electrode were calculated according to the following equations:15,41
 | (1) |
| Γ = (C0 − C)V/m | (2) |
Results and discussion
Morphology and structure
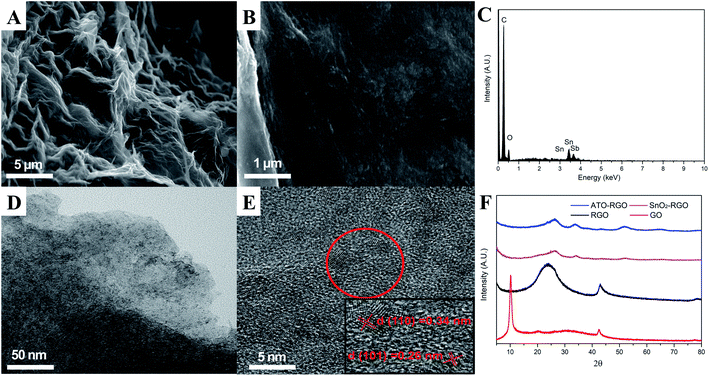
Fig. 1A showed the surface morphology of graphene. It could be seen that there are lots of folds on the surface of the material, indicating a larger specific area. Fig. 1B displayed the SEM image of ATO–RGO composite with 20 wt% ATO, and the good and uniform distribution of ATO nanoparticles on the surface of graphene sheets can be observed. Meanwhile, energy-dispersive X-ray spectroscopy (EDX) was applied in Fig. 1C to demonstrate the presence of Sn and Sb elements simultaneously in the corresponding area from the graphene sheet, which was different from SnO2–RGO (Fig. S1†).Fig. 1D and E showed the low and high magnification of TEM images for ATO–RGO (20 wt%) nanocomposite. It was easy to find that the ATO nanocomposites were successfully introduced, which matched the result shown in Fig. 1B. In Fig. 1E, it could be clearly revealed that the incorporated ATO nanoparticles were with the average size about 5 nm. The lattice spacings of 0.34 nm and 0.26 nm (inset in Fig. 1E) were relevant to the (110) and (101) planes of rutile structure of SnO2 crystal,42 indicating that the introduction of Sb element did not form a new compound and all antimony ions came into the lattice of bulk SnO2 to substitute for tin ions.43 This could also be proved by XRD, Fig. 1F showed the XRD patterns of GO, RGO, SnO2–RGO nanocomposites and ATO–RGO nanocomposite. It showed that an intense peak of GO centered at 10.35°, proving the existence of abundant oxygen-containing groups. However, after the reduction process, a broad weak reflection peak (002) of RGO located at 24.3° confirmed that most oxygen-containing groups had been removed and pristine graphene was obtained successfully. Notably, the XRD patterns of SnO2–RGO nanocomposites and ATO–RGO nanocomposites were quite the same, the diffraction peak centered at 26.5°, 33.8° and 51.7° were corresponding to the (110), (101) and (211) lattice plane of rutile structure of SnO2 crystal (JCPDS, no. 41-1445),44 which indicating that the addition of antimony chloride did not form a new phase.34,45,46
X-ray photoelectron spectroscopy (XPS) was shown in Fig. 2 to elaborate the chemical states of the detected elements in the synthesized ATO–RGO nanosheets. Fig. 2A showed the XPS spectrum of C 1s for ATO–RGO, which could be distinguished into four peaks (colored lines) with different carbon ratios: sp2 bonded carbon at 284.2 eV and 284.8 eV (C–C), epoxy/hydroxyls at 286.2 eV (C–O) and carbonyls at 288.2 eV (C![[double bond, length as m-dash]](https://www.rsc.org/images/entities/char_e001.gif) O). This spectrum could be verified with the pure RGO spectrum (Fig. S2†). Obviously, some oxygenated functional groups still existed due to incomplete reduction by hydrothermal reaction which could become the active sites for riveting ATO nanoparticles.47 Fig. 2B displayed the XPS spectrum of Sn 3d. Unlike Sn (485.2 eV) and Sn2+ (486 eV), two intense peaks located at 486.8 eV and 495.3 eV represented the binding energy of Sn 3d5/2 and Sn 3d3/2, respectively, indicating the existence of Sn4+ in the nanocomposites.48 Fig. 2C exhibited the characteristic of Sb element in the ATO nanoparticles. An intense peak located at 531.0 eV represented the binding energy of Sb 3d5/2, a weak peak centered at 540.3 eV indicating the binding energy of Sb 3d3/2, which was the binding energy of Sb2O5.49 From the conclusion of XRD and XPS, it was obvious that Sb ions, which assume the valence state of 5+, have been successfully intercalated into SnO2 lattice to substitute for Sn4+, proving the successful preparation of ATO nanoparticles.50
O). This spectrum could be verified with the pure RGO spectrum (Fig. S2†). Obviously, some oxygenated functional groups still existed due to incomplete reduction by hydrothermal reaction which could become the active sites for riveting ATO nanoparticles.47 Fig. 2B displayed the XPS spectrum of Sn 3d. Unlike Sn (485.2 eV) and Sn2+ (486 eV), two intense peaks located at 486.8 eV and 495.3 eV represented the binding energy of Sn 3d5/2 and Sn 3d3/2, respectively, indicating the existence of Sn4+ in the nanocomposites.48 Fig. 2C exhibited the characteristic of Sb element in the ATO nanoparticles. An intense peak located at 531.0 eV represented the binding energy of Sb 3d5/2, a weak peak centered at 540.3 eV indicating the binding energy of Sb 3d3/2, which was the binding energy of Sb2O5.49 From the conclusion of XRD and XPS, it was obvious that Sb ions, which assume the valence state of 5+, have been successfully intercalated into SnO2 lattice to substitute for Sn4+, proving the successful preparation of ATO nanoparticles.50
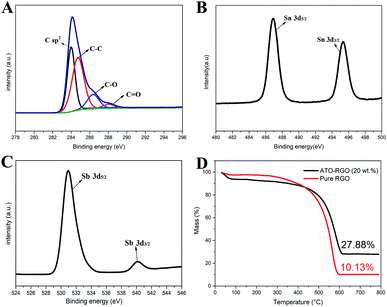 | ||
| Fig. 2 (A) C 1s (B) Sn 3d and (C) Sb 3d region in the XPS spectrum of the as-synthesized ATO–RGO nanocomposites. (D) TGA curves of pure RGO and ATO–RGO (20 wt%). | ||
At the same time, thermogravimetric analysis (TGA) was performed. As shown in Fig. 2D, both materials showed good stability until 400 °C, and they no longer lost mass at about 600 °C. The difference of the mass fraction of these two was 17.75%, which was almost consistent with the ATO mass fraction of the experimental design, indicating that almost all raw materials participated in the reaction to generate ATO. At the same time, it could be found that both materials experienced a period of mass fraction decline before 100 °C, which was attributed to the removal of water. Moreover, ATO–RGO (20 wt%) had a more obvious downward trend, which indicated that ATO–RGO (20 wt%) was more hydrophilic.
Fig. 3 showed the N2 sorption isotherms and pore size distribution plots of RGO and ATO–RGO with various mass ratio of ATO and RGO. For all the isotherms in Fig. 3A, the uniform pronounced capillary condensation step at relative pressure of 0.4–0.9 showed the typical IUPAC type-IV adsorption isotherm patterns. The presence of a H1-type hysteresis loop indicated the composite was the mesoporous materials.10 All the mesoporous structures of the RGO and ATO–RGO composite were well retained, and the pore size distribution plots were similar as shown in Fig. 3B, which meant the incorporation of the ATO can increase the percentage of mesopores and the accessible surface area. The BET surface area, pore volumes, and average pore size of all samples were shown in Table 1. It could be seen that the largest surface area was found at ATO–RGO (20 wt%) (445.2 m2 g−1), which was much higher than RGO (196.1 m2 g−1).
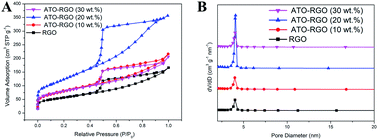 | ||
| Fig. 3 (A) N2 sorption isotherms at 77 K and (B) Barrett–Joyner–Halenda (BJH) mesopore size distribution plots of RGO and ATO–RGO with various ATO mass ratio. | ||
| Sample | SBET (m2 g−1) | VBJH (cm3 g−1) | Pore size (nm) |
|---|---|---|---|
| RGO | 196.1 | 0.2570 | 4.25 |
| ATO–RGO (10 wt%) | 281.9 | 0.3348 | 4.47 |
| ATO–RGO (20 wt%) | 445.2 | 0.5518 | 4.02 |
| ATO–RGO (30 wt%) | 276.9 | 0.3191 | 4.36 |
Meanwhile, the surface area for the pure ATO was also tested (53.2 m2 g−1). There was no obvious linear relationship between the ATO content and pore size, indicating that the introduction of ATO nanoparticles could not change the original structure of the material. The results suggested the ATO nanoparticles can effectively decrease the agglomeration of the RGO nanosheets, leading to a higher exposed surface area than RGO. But the surface area decreased with further increasing of the ATO content. This might be caused by the agglomeration between ATO nanoparticles on the RGO surface, thus decreasing the exposed surface area.15
Possible preparation principle
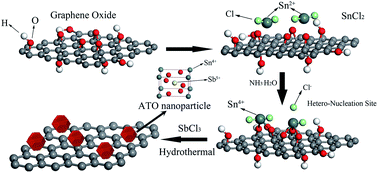
The detailed preparation process of ATO–RGO is illustrated in Scheme 1. It is noteworthy to mention that tin chloride precursor in the presence of NH3·H2O has strong reducing influence on graphene oxide to be converted to graphene.51,52 NH3·H2O could not only provide an alkaline atmosphere, but also promote hydrolysis of SnCl2 precursors, resulting in the formation of SnO2 nanoparticles. After adding SnCl2, graphene sheets absorb most Sn2+ ions through electrostatic interactions or coordination with abundant surface oxygen-containing groups. Then, the absorbed Sn2+ are oxidized to Sn4+ by graphene oxide, giving rise to the nucleation sites of SnO2 nanoparticles.47 In this route, graphene sheets acted as the heterogeneous nucleation sites for growth of ATO nanoparticles. In the following hydrothermal process, graphene oxide was further reduced, and the Sb ions came into SnO2 lattice to substitute Sn ions, respectively.Electrochemical properties and CDI performance
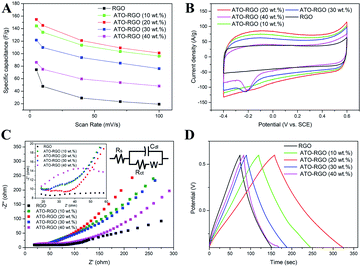
Because the specific capacitance of the electrode materials in NaCl solution is an important factor for evaluating ions adsorption capacity,53 cyclic voltammetry (CV) and galvanostatic charge–discharge measurements were employed to investigate the electrochemical performance of the ATO–RGO composites. As mentioned in the experimental part, the specific capacitance was calculated from I–V cycles.10 Briefly, the lower scan rate corresponds to higher specific capacity value. As shown in Fig. 4A and B, the ATO–RGO (20 wt%) composite was superior to others. Typically, the specific capacitance of ATO–RGO (20 wt%) was 154.7 F g−1 while they were 144.4 F g−1, 121.6 F g−1, 86.1 F g−1 and 74.3 F g−1 for ATO–RGO (10 wt%), ATO–RGO (30 wt%), ATO–RGO (40 wt%) and pristine RGO at 5 mV s−1 scan rate in 1 M NaCl, respectively. Fig. 4B showed the CV curves of pristine RGO and ATO–RGO composites with different ATO mass ratio electrodes with the potential from −0.4 to 0.6 V, other CV curves at different scan rate were displayed in Fig. S3A–S3E.† Obviously, all the CV curves exhibited nearly rectangular shapes, while reduction peaks can be detected in the CV curves of ATO–RGO (30 wt%) and ATO–RGO (40 wt%), which was the same as the expression in the ref. 54 and 55, and it could be attributed to the reduction of Sn4+ to Sn2+, which revealed that the ions adsorbed on the electrode surface by forming an electric double layer due to coulombic interaction only within a certain ATO content. The presence of excessive amounts of ATO will result in more pseudo-capacitances and decrease the total specific capacitances due to the agglomeration between nanoparticles.26 All these result above showed that only proper loading amount of ATO nanoparticles can lead to significant enhancement of the specific capacitance of the hybrid materials. It is apparent that ATO–RGO (20 wt%) composites retained the largest area of CV curve, which indicated the highest specific capacitance and optimal electrosorption performance. In Fig. S3C,† all CV curves of ATO–RGO (20 wt%) electrode remain almost rectangular shape when the scan rate changes from 5 to 100 mV s−1, and there is no obvious deformation and redox peaks at high scan rates implying ideal electric double-layer capacitive behavior and good reversible ion adsorption/desorption characteristics. The specific capacitance of SnO2–RGO (20 wt%) was also tested for comparison. As shown in Fig. S4,† the calculated specific capacitance was 95.7 F g−1, which was significantly lower than ATO–RGO (20 wt%), possibly due to the poor conductivity of SnO2.56Fig. 4C was the image of electrochemical impedance spectroscopy (EIS) of ATO–RGO nanocomposites, it further provided insights into the electrical resistance and diffusion limitation. The Nyquist plots showed that all the electrodes were with the low charge transfer resistance in high frequency region, which was attributed to the good connectivity of RGO. The high frequency intercept on the real axis region was the equivalent series resistance (ESR) or the sum of the interfacial resistance at the active material/current collector and ionic resistance of the electrolyte.57 It was clear that the introduction of ATO makes the ESR of the electrodes lower, indicating the good connectivity of ATO nanoparticles, and it could improve the charge transfer efficiency of the electrode. Notably, ATO–RGO (20 wt%) performed larger slope than the other fabricated electrodes in low frequency, which was indicative of primarily capacitive behavior, suggesting a faster ion diffusion and adsorption.58 Fig. 4D was the image of galvanostatic charge–discharge of fabrication materials. As shown in Fig. 4D, except the ATO–RGO (40 wt%) modified electrode, the GC curves of all the other electrodes exhibit nearly regular triangle shapes, thereby suggesting a low inner resistance and reversible charge–discharge capacitive behavior of the electrode.26 ATO–RGO (20 wt%) had the maximum charge–discharge time, the specific capacitance calculated from the galvanostatic charge–discharge measurement26 was 158.2 F g−1, which was consistent with the conclusion of CV testing.
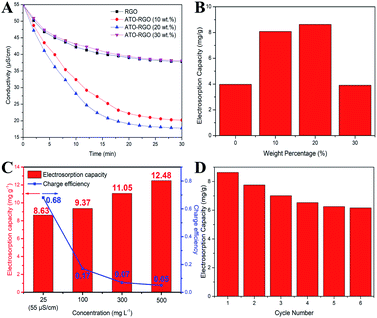
To investigate the desalination performance of the fabricated electrodes, batch mode experiments were conducted in a NaCl aqueous solution with an initial conductivity of 55 μS cm−1 at a working voltage of 1.2 V. The total mass of the electrode was 0.1 g and the volume of NaCl aqueous solution was 50 mL. As shown in Fig. 5A, a dramatic decrease of the conductivity at the beginning corresponded to the quick adsorption of the salt ions. The conductivity changed weakly after 20 min and remained at a constant value until 30 min, indicating the saturation of the electrosorption. Fig. 5B displayed the electrosorptive capacity of fabricated electrodes, and it is clearly that ATO–RGO (20 wt%) electrode had the optimal desalination performance of 8.63 mg g−1, which was more than two times than 3.98 mg g−1 for pristine graphene. Fig. S5† showed the desalination performance of ATO–RGO (20 wt%) electrode at different applied voltages from 1.0 to 1.4 V. The adsorption process was completely electric double-layer capacitive behavior by electrostatic force. Therefore, the higher voltage applied, the higher salt removal capacity was. As shown in Fig. 5C, tests were also made under different salt solution concentrations.39,40 Although the electrosorption capacity increased under higher concentration of salt solution, the charge efficiency decreased rapidly. Therefore, the NaCl concentration of 25 mg L−1 (55 μS cm−1) was regarded as the ideal condition for ATO–RGO (20 wt%) with high CDI effective. To evaluate the electrosorption stability of ATO–RGO (20 wt%) electrode, repeating charge–discharge experiment was carried out in a NaCl aqueous solution with an initial conductivity of 55 μS cm−1 at a working voltage of 1.2 V for 6 cycles. As shown in Fig. 5D, after 6 times of cycling, the electrosorption capacity was stable at 6.16 mg g−1, showing good stability. Furthermore, the electrosorption capacities and charge efficiencies of ATO–RGO nanocomposite were compared with those of other advanced carbon materials, and the results were shown in Table 2. Clearly, at the same applied voltage, ATO–RGO material had both good electrosorption capacity and charge efficiency, indicating a superior desalination performance.
| Materials | Voltage (V) | Electrosorption capacity (mg g−1) | Charge efficiency | Reference |
|---|---|---|---|---|
| P-doped carbon nanofiber aerogels | 1.2 V | 8.31 | ∼0.65 | 59 |
| Active carbon/nickel hexacyanoferrate/reduced graphene oxide | 1.2 V | 31.8 | 0.11 | 60 |
| Nitrogen-doped tin oxide intercalated activated carbon | 1.2 V | 3.42 | ∼0.6 | 61 |
| Porous carbons obtained from Zn fumarate | 1.2 V | 8.1 | 0.55 | 62 |
| Nitrogen-doped porous hollow carbon spheres | 1.2 V | 6.87 | 0.55 | 63 |
| ATO–RGO (20 wt%) | 1.2 V | 8.63 | 0.68 | This paper |
The intercalation of ATO nanoparticles between graphene sheets plays a vital role to increase the adsorption capacity of salt ions on the surface of the electrode. First, the pore structure of pure graphene is easily destructed by the agglomeration during the reduction progress owing to the π–π stacking interactions among the graphene sheets.57 It is observable that the introduction of ATO nanoparticles can effectively obstruct the agglomeration of graphene sheets and increase the interfacial contact area of the electrode. Secondly, ATO nanoparticles can promote the electron transfer rate among the interlayer space because the doped Sb5+ replaced the location of Sn4+ in the tin oxide lattice, which formed an N-type semiconductor to increase the quantity of electron and elevate the electron conductivity between the graphene sheets.37
Conclusion
In summary, ATO–RGO nanocomposite has been successfully synthesized via a facile hydrothermal method and applied as CDI electrode. The ATO–RGO (20 wt%) electrode exhibited superior electrochemical properties than those of pristine graphene. Specifically, the intercalation of ATO nanoparticles can efficiently prevent graphene sheets from restacking which strongly increased the total surface area; moreover, as an N-type semiconductor, ATO can increase the quantity of electron and enhance the electron conductivity between the graphene sheets. Therefore, ATO–RGO (20 wt%) electrode achieved the highest specific capacity (158.2 F g−1) and possessed the maximum electrosorption capacity (8.63 mg g−1), which was more than two folds higher than that of pristine graphene (3.93 mg g−1). Under the same applied voltage, compared with other reported carbon materials of recent years, ATO–RGO (20 wt%) material represents better electrosorption capacity and charge efficiency. ATO–RGO nanocomposite can be a promising electrode material for capacitive deionization.Conflicts of interest
There are no conflicts to declare.Acknowledgements
Financial supports from the National Water Pollution Control and Treatment Science and Technology Major Projects of China (2017ZX07301006), the National Natural Science Foundation of China (Grant No. 21605084 and No. 51808251), the Natural Science Foundation for Young Scholars of Jiangsu Province, China (Grant No. BK20160983 and BK20170111), and Research Start-up Funds for Talent Scholars of Nanjing Tech University (No. 39837104) are highly appreciated.References
- G. M. Geise, D. R. Paul and B. D. Freeman, Prog. Polym. Sci., 2014, 39, 1–42 CrossRef CAS.
- A. Subramani and J. G. Jacangelo, Water Res., 2015, 75, 164–187 CrossRef CAS.
- Y. Oren, Desalination, 2008, 228, 10–29 CrossRef CAS.
- K. Laxman, M. T. Z. Myint, R. Khan, T. Pervez and J. Dutta, Electrochim. Acta, 2015, 166, 329–337 CrossRef CAS.
- L. Han, K. G. Karthikeyan, M. A. Anderson, J. J. Wouters and K. B. Gregory, Electrochim. Acta, 2013, 90, 573–581 CrossRef CAS.
- Y. Liu, L. Pan, T. Chen, X. Xu, T. Lu, Z. Sun and D. H. C. Chua, Electrochim. Acta, 2015, 151, 489–496 CrossRef CAS.
- H. Li, L. Pan, C. Nie, Y. Liu and Z. Sun, J. Mater. Chem., 2012, 22, 15556–15561 RSC.
- X. Wen, D. Zhang, L. Shi, T. Yan, H. Wang and J. Zhang, J. Mater. Chem., 2012, 22, 23835–23844 RSC.
- Y. Liu, H. Li, C. Nie, L. Pan and Z. Sun, Desalin. Water Treat., 2013, 51, 3988–3994 CrossRef CAS.
- Z. Peng, D. Zhang, T. Yan, J. Zhang and L. Shi, Appl. Surf. Sci., 2013, 282, 965–973 CrossRef CAS.
- Z. Peng, D. Zhang, L. Shi, T. Yan, S. Yuan, H. Li, R. Gao and J. Fang, J. Phys. Chem. C, 2011, 115, 17068–17076 CrossRef CAS.
- C. Tsouris, R. Mayes, J. Kiggans, K. Sharma, S. Yiacoumi, D. DePaoli and S. Dai, Environ. Sci. Technol., 2011, 45, 10243–10249 CrossRef CAS.
- P. Xu, J. E. Drewes, D. Heil and G. Wang, Water Res., 2008, 42, 2605–2617 CrossRef CAS.
- M. C. Zafra, P. Lavela, G. Rasines, C. Macías, J. L. Tirado and C. O. Ania, Electrochim. Acta, 2014, 135, 208–216 CrossRef CAS.
- D. Zhang, T. Yan, L. Shi, Z. Peng, X. Wen and J. Zhang, J. Mater. Chem., 2012, 22, 14696–14704 RSC.
- Y. Yang, L. Ren, C. Zhang, S. Huang and T. Liu, ACS Appl. Mater. Interfaces, 2011, 3, 2779–2785 CrossRef CAS.
- H. Bi, S. Sun, F. Huang, X. Xie and M. Jiang, J. Mater. Chem., 2012, 22, 411–416 RSC.
- Z. H. Ni, T. Yu, Y. H. Lu, Y. Y. Wang, Y. P. Feng and Z. X. Shen, ACS Nano, 2008, 2, 2301–2305 CrossRef CAS.
- S. Nardecchia, D. Carriazo, M. L. Ferrer, M. C. Gutierrez and F. del Monte, Chem. Soc. Rev., 2013, 42, 794–830 RSC.
- H. Sun, Z. Xu and C. Gao, Adv. Mater., 2013, 25, 2554–2560 CrossRef CAS.
- H.-P. Cong, X.-C. Ren, P. Wang and S.-H. Yu, ACS Nano, 2012, 6, 2693–2703 CrossRef CAS.
- J. Chen, K. Sheng, P. Luo, C. Li and G. Shi, Adv. Mater., 2012, 24, 4569–4573 CrossRef CAS.
- J. Liang, W. Wei, D. Zhong, Q. Yang, L. Li and L. Guo, ACS Appl. Mater. Interfaces, 2012, 4, 454–459 CrossRef CAS.
- Y. Si and E. T. Samulski, Chem. Mater., 2008, 20, 6792–6797 CrossRef CAS.
- Z.-S. Wu, G. Zhou, L.-C. Yin, W. Ren, F. Li and H.-M. Cheng, Nano Energy, 2012, 1, 107–131 CrossRef CAS.
- M. Liu, W. W. Tjiu, J. Pan, C. Zhang, W. Gao and T. Liu, Nanoscale, 2014, 6, 4233–4242 RSC.
- T. W. Lin, C. S. Dai and K. C. Hung, Sci. Rep., 2014, 4, 7274–7283 CrossRef CAS.
- A. G. El-Deen, J.-H. Choi, K. A. Khalil, A. A. Almajid and N. A. M. Barakat, RSC Adv., 2014, 4, 64634–64642 RSC.
- H. Seema, K. Christian Kemp, V. Chandra and K. S. Kim, Nanotechnology, 2012, 23, 355705–355712 CrossRef.
- C. Kim, J. Lee, S. Kim and J. Yoon, Desalination, 2014, 342, 70–74 CrossRef CAS.
- S. Porada, R. Zhao, A. van der Wal, V. Presser and P. M. Biesheuvel, Prog. Mater. Sci., 2013, 58, 1388–1442 CrossRef CAS.
- K. Y. Rajpure, M. N. Kusumade, M. N. Neumann-Spallart and C. H. Bhosale, Mater. Chem. Phys., 2000, 64, 184–188 CrossRef CAS.
- K. C. Leonard, J. R. Genthe, J. L. Sanfilippo, W. A. Zeltner and M. A. Anderson, Electrochim. Acta, 2009, 54, 5286–5291 CrossRef CAS.
- J. Rockenberger, U. zum Felde, M. Tischer, L. Tröger, M. Haase and H. Weller, J. Chem. Phys., 2000, 112, 4296–4304 CrossRef CAS.
- T. Nütz, U. z. Felde and M. Haase, J. Chem. Phys., 1999, 110, 12142–12150 CrossRef.
- Z. C. Orel, B. Orel, M. Hodoscek and V. Kaucic, J. Mater. Sci., 1992, 27, 313–318 CrossRef CAS.
- H. S. Varol and A. Hinsch, Sol. Energy Mater. Sol. Cells, 1996, 40, 273–283 CrossRef CAS.
- A. C. Bose, D. Kalpana, P. Thangadurai and S. Ramasamy, J. Power Sources, 2002, 107, 138–141 CrossRef CAS.
- A. B. Ganganboina and R. A. Doong, Environ. Sci.: Nano, 2020, 7, 228–237 RSC.
- X. Xu, Y. Liu, M. Wang, C. Zhu, T. Lu, R. Zhao and L. Pan, Electrochim. Acta, 2016, 93, 88–95 CrossRef.
- Z. U. Khan, T. Yan, J. Han, L. Shi and D. Zhang, Environ. Sci.: Nano, 2019, 6, 3442–3453 RSC.
- L. Gao, C. Gu, H. Ren, X. Song and J. Huang, Electrochim. Acta, 2018, 290, 72–81 CrossRef CAS.
- Y. Li, J. Wang, B. Feng, K. Duan and J. Weng, J. Alloys Compd., 2015, 634, 37–42 CrossRef CAS.
- L. Shi, Y. Xu and Q. Li, Nanoscale, 2010, 2, 2104–2108 RSC.
- Y. Zhang, Q. Shao, B. Zhao, B. Zhang, V. Murugadoss, S. Wu and Z. Guo, Colloids Surf., A, 2019, 583, 123965–123971 CrossRef CAS.
- Y. Yan, J. Lin, S. Chen, S. Zhang, R. Yang, Y. Xu and T. Han, J. Nanosci. Nanotechnol., 2020, 20, 7027–7033 CrossRef.
- M. Zhang, D. Lei, Z. Du, X. Yin, L. Chen, Q. Li and T. Wang, J. Mater. Chem., 2011, 21, 1673–1676 RSC.
- M. Batzill and U. Diebold, Prog. Surf. Sci., 2005, 79, 47–154 CrossRef CAS.
- F. Li, D.-M. Tang, Z. Jian, D. Liu, D. Golberg, A. Yamada and H. Zhou, Adv. Mater., 2014, 26, 4659–4664 CrossRef CAS.
- L. Wang, A. Palacios-Padros, R. Kirchgeorg, A. Tighineanu and P. Schmuki, Chemsuschem, 2014, 7, 421–424 CrossRef CAS.
- J. Liang, Y. Zhao, L. Guo and L. Li, ACS Appl. Mater. Interfaces, 2012, 4, 5742–5748 CrossRef CAS.
- N.-S. Kwak, J. S. Koo, T. S. Hwang and E. M. Choi, Desalination, 2012, 285, 138–146 CrossRef CAS.
- H. Yin, S. Zhao, J. Wan, H. Tang, L. Chang, L. He, H. Zhao, Y. Gao and Z. Tang, Adv. Mater., 2013, 25, 6270–6276 CrossRef CAS.
- H. Cui, J. Xue, W. Ren and M. Wang, J. Alloys Compd., 2015, 645, 11–16 CrossRef CAS.
- A. G. El-Deen, N. A. Barakat, K. A. Khalil, M. Motlak and H. Y. Kim, Ceram. Int., 2014, 40, 14627–14634 CrossRef CAS.
- S. K. Sami, J. Y. Seo, S. E. Hyeon, M. S. A. Shershah, P. J. Yoo and C. H. Chung, RSC Adv., 2018, 8, 4182–4190 RSC.
- M. Boota, K. B. Hatzell, M. Alhabeb, E. C. Kumbur and Y. Gogotsi, Carbon, 2015, 92, 142–149 CrossRef CAS.
- M.-W. Ryoo, J.-H. Kim and G. Seo, J. Colloid Interface Sci., 2003, 264, 414–419 CrossRef CAS.
- Y. Li, Y. Liu, M. Wang, X. Xu, T. Lu, C. Q. Sun and L. Pan, Carbon, 2018, 130, 377–383 CrossRef CAS.
- Z. Ding, X. Xu, Y. Li, K. Wang, T. Lu and L. Pan, Desalination, 2019, 468, 114078–114087 CrossRef CAS.
- A. S. Yasin, J. Jeong, I. M. Mohamed, C. H. Park and C. S. Kim, J. Alloys Compd., 2017, 729, 764–775 CrossRef CAS.
- S. Zhao, T. Yan, H. Wang, G. Chen, L. Huang, J. Zhang, L. Shi and D. Zhang, Appl. Surf. Sci., 2016, 369, 460–469 CrossRef CAS.
- W. Chen, S. Li, C. Chen and L. Yan, Adv. Mater., 2011, 23, 5679–5683 CrossRef CAS.
Footnote |
| † Electronic supplementary information (ESI) available: Specific materials used in the experiment and instrument used for characterization. Specific preparation of graphene oxide. All the CV curves of pristine RGO and ATO–RGO composites with different mass ratios between ATO and graphene at different scan rates. CDI performance at different applied voltage in the testing solution. See DOI: 10.1039/d0ra08339a |
| This journal is © The Royal Society of Chemistry 2020 |

