 Open Access Article
Recently synthesized (Ti1−xMox)2AlC (0 ≤ x ≤ 0.20) solid solutions: deciphering the structural, electronic, mechanical and thermodynamic properties via ab initio simulations
M. A. Ali *a and
S. H. Naqib
 *b
*b
aDepartment of Physics, Chittagong University of Engineering and Technology (CUET), Chattogram 4349, Bangladesh. E-mail: ashrafphy31@cuet.ac.bd
bDepartment of Physics, University of Rajshahi, Rajshahi-6205, Bangladesh. E-mail: salehnaqib@yahoo.com
First published on 26th August 2020
Abstract
The structural, electronic, mechanical and thermodynamic properties of (Ti1−xMox)2AlC (0 ≤ x ≤ 0.20) were explored using density functional theory. The obtained lattice constants agree well with the experimental values. The electronic band structure confirms the metallic nature. Strengthening of covalent bonds due to Mo substitution is confirmed from the study of band structure, electronic density of states and charge density mapping. The elastic constants satisfy the mechanical stability criteria. Strengthening of covalent bonds leads to enhanced mechanical properties. (Ti1−xMox)2AlC compounds are found to exhibit brittle behavior. The anisotropic nature of (Ti1−xMox)2AlC is revealed from the direction dependent Young's modulus, compressibility, shear modulus and Poisson's ratio as well as the shear anisotropic constants and the universal anisotropic factor. The Debye temperature, minimum thermal conductivity, Grüneisen parameter and melting temperature of (Ti1−xMox)2AlC have been calculated for different Mo contents. Our calculated values are compared with reported values, where available.
1. Introduction
Intrinsically nanolaminated MAX phase compounds have drawn significant attention from the materials science community because of their unusual combination of physical properties such as damage tolerance, high stiffness, resistance to corrosion and thermal shock like ceramics as well as fairly high electrical and thermal conductivity, and machinability like metallic compounds.1,2 This outstanding combination of these properties makes MAX compounds suitable for extensive use in a number of applications mentioned in the literature.1–6 In the 1960s, the powder forms of these carbides/nitrides were first discovered,7–10 but interest was reinvigorated after the studies of Barsoum and coworkers in the 1990s6,11 which disclosed their interesting properties in detail for the first time. The physical properties of these systems originate mainly due to the layered structure of MAX phases that have A-layers (Sn, Al, Ge, etc.) sandwiched in between Mn+1Xn sheets (e.g., Ti2C) with the stacking of atomic layers along the c-axis.12,13 To date, a number of compounds (around 80) belonging to MAX phases have already been synthesized,1,14 theoretically around 155 are known15 out of a possible 665 viable MAX phases (Mn+1AXn, n = 1–4)16 and the number of reports performed theoretically as well as experimentally are increasing tremendously.3,17–38 The study of the existing and potentially viable MAX phase nanolaminates has established itself as an important subfield of materials science research.The Ti2AlC compound belongs to the Ti–Al–C system representing a large family of solids with overall advantages of MAX phases and thus becomes one of widely studied compounds from the 211 MAX phase materials.39 The M–Al–X phases are most attractive for high-temperature applications, such as Ti2AlC and Cr2AlC because of their high oxidation resistant (up to 1400 °C) resulted from the slow growing protective alumina (Al2O3) layers.40,41 The coefficient of thermal expansion (8.2 × 10⁻⁶ K−1) of Ti2AlC42 is almost equal to that of α-Al2O3 (9.3 × 10⁻⁶ K−1),43 gives it another advantage by making it resistant to thermal stresses upon thermal cycling.44 However, low hardness and strength limit its potential use as a structural component like other binary carbide ceramics.45 Therefore, an increase of hardness and bonding strength along with melting temperature of Ti2AlC will be highly advantageous to extend its domain of applications.
Scientific community are always keen on the reporting of new MAX phase solid solutions, one of the efficient ways of altering the properties of existing MAX phase materials, opening new wing of research and widening their field of applications. Enhancement of many important properties such as oxidation,46–50 fracture toughness,51,52 strength48,51 and self-healing properties47,53 are reported in the solid solutions. Attempts have also been made to increase the hardness and strength of Ti2AlC both theoretically and experimentally.42,45,54–57 A considerable increase in elastic modulus is reported by Nb substitution in Ti2AlC.42 Strengthening of  (M and M′ = Ti, V, and Cr) solid solutions has been reported by Wang et al.56 Meng et al.57 have investigated Ti2AlC and (Ti0.8V0.2)2AlC where enhancement of Vickers hardness, flexural strength, and shear strength were reported due to V substitution. A considerable improvement in compressive strength has already been reported for Ti2AlC1−xNx.58 Recently, Pan et al.59 have successfully synthesized the Mo substituted Ti2AlC solid solution where a significant increase of Vickers hardness, flexural strength, and fracture toughness were reported. The atom Mo has the possibility to form (Ti1−xMox)2AlC solids solutions because of its smaller atomic radius compared to Ti. The earlier reports also proved the ability of Mo to modify the microstructural and mechanical properties of MAX phase materials.45,60 Moreover, we have investigated the effect of M mixing on the physical properties of (Zr,Ti)2AlC in our previous study.27 Thus, the mechanical and thermodynamic properties are expected to be upgraded by substituting Mo into Ti2AlC.
Therefore, we aimed to study the structural, electronic, mechanical and thermodynamic properties of (Ti1−xMox)2AlC (0 ≤ x ≤ 0.20) solids solutions theoretically for the first time where the modification of mechanical and thermodynamic properties due to alloying with Mo are explored in details. The value of x is limited up to 0.20 and only the experimentally synthesized compositions are chosen to keep away from the controversy of the thermodynamical stability. The rest of the paper has been structured as follows. Section 2 describes the computational methodology in brief. Results are presented, analyzed and discussed in Section 3. Finally, important conclusions from this study are summarized in Section 4.
2. Calculation methods
The CAmbridge Sequential Total Energy Package (CASTEP) code61 was used to calculate the physical properties of (Ti1−xMox)2AlC solids solutions via the density functional theory (DFT)62,63 based on the plane–wave pseudopotential method. The generalized gradient approximation (GGA) of Perdew–Burke–Ernzerhof (PBE) is used as an exchange and correlation functional.64 The pseudo atomic calculation was performed for C – 2s22p2, Al – 3s23p1, Ti – 3s23p63d24s2 and Mo – 4s24p64d55s1 electronic orbitals. The cutoff energy of 400 eV and a k-point mesh of 12 × 12 × 3 (ref. 65) were set for good convergence using the Broyden Fletcher Goldfarb Shanno (BFGS) geometry optimization66 technique. The self-consistent convergence of the total energy was 5 × 10⁻⁶ eV per atom, and the maximum force on the atom was 0.01 eV Å−1. The maximum ionic displacement was set to 5 × 10⁻⁴ Å, and a maximum stress of 0.02 GPa was used. The Virtual Crystal Approximation (VCA) approach was employed to model the solid solutions. In the VCA the crystal preserves the primitive periodicity with mixture of atoms. VCA allows the study of crystals with mixed atoms by preserving unit cell of the unsubstituted parent material. The disorder due to alloying is modeled by defining mixture atoms or hybrid atoms where one atomic site is occupied by one of the two different types of atoms. The relative concentrations can be set for any number of atoms involved, where the total concentration of the substituted and substituent atoms (for instance, Ti and Mo, respectively, in (Ti1−xMox)2AlC solid solutions) is always 100%. In practice, this approximation works well when the level of alloying substitution is not very high and the Vegard's law is reasonably held. These conditions are satisfied for the alloys considered here. Moreover, a number of works have been published recently using the VCA27,28,67–70 which resulted in reliable estimates of thermo-physical and electronic band structure properties of MAX phase compounds.3. Results and discussion
3.1. Structural properties
The MAX phases are crystallized in hexagonal structure with the space group P63/mmc. There are 8 atoms (for 211 system) in the unit cell of which 4M, 2A and 2X atoms are contributed to the total 8 atoms. In case of Ti2AlC, the position of carbon atoms is 2a, Ti atoms is 4f and Al atoms is 2c Wyckoff positions,6 as shown schematically in Fig. 1(a). In order to calculate the ground state physical properties, we have to obtain the equilibrium structure by optimizing the total energy of the solids under consideration. Optimized lattice constants are presented in Table 1 together with values obtained by others.71–75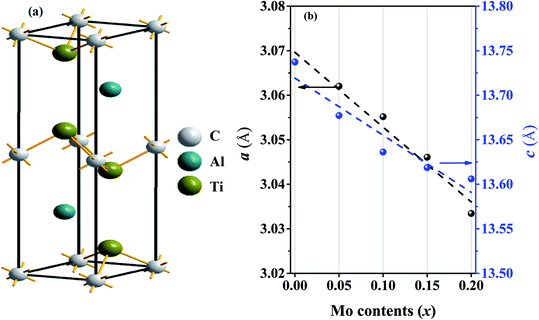 | ||
| Fig. 1 (a) Crystal structure (unit cell) of the Ti2AlC compound and (b) lattice constants a (Å) and c (Å) for different Mo contents (the linear fits to the lattice constants are also shown). | ||
| x | a (Å) | c (Å) | c/a | V (Å3) |
|---|---|---|---|---|
| a Expt.71b GGA.72c LDA.73d GGA.74e GGA.75 | ||||
| 0.00 | 3.0670 | 13.737 | 4.478 | 111.94 |
| 3.058a | 13.642a | 4.461a | 106.62a | |
| 3.066b | 13.694b | 4.466b | 111.49b | |
| 3.04c | 13.60c | |||
| 3.053d | 13.640d | 4.468d | ||
| 3.06e | 13.67e | 4.46e | ||
| 0.05 | 3.0620 | 13.677 | 4.466 | 111.06 |
| 0.10 | 3.0552 | 13.636 | 4.463 | 110.23 |
| 0.15 | 3.0461 | 13.618 | 4.470 | 109.43 |
| 0.20 | 3.0334 | 13.606 | 4.485 | 108.66 |
The calculated ground state lattice constants of Ti2AlC: a and c are just 0.29% and 0.69%, respectively, higher than the experimentally obtained values. This ensures very high level of consistency of present first-principles calculations. Fig. 1(b) illustrates the variation of a and c with Mo contents from which it is clear that the lattice constants a and c decrease with Mo content. The decrement of lattice constants can be largely attributed to the difference in ionic radii of Mo (0.69 Å) and Ti (0.74 Å). Since Mo is smaller than the Ti, its substitution causes shrinkage of the unit cell. The decrease of lattice constant c with Mo content is reported in experiment while the values of a have been found to vary by little.59 However, the compositions considered here follows the Vegard's law reasonably well.76
3.2. Electronic properties
Fig. 2(a) shows the electronic band structure of Ti2AlC in which no band gap is observed between valence and conduction bands and the density of states (DOS) at Fermi level is 3.04 states per eV [Fig. 2(c)]. Accordingly, Ti2AlC is found to be metallic in nature which is able to conduct electrically as well as thermally, which is in good accord with the experimental results of Barsoum et al.77 The electrical conductivity exhibited by Ti2AlC is direction dependent. The paths Γ–A, H–K and M–L are along the c-direction which exhibited much less degree of energy dispersion. On the other hand, the paths A–H, K–Γ, Γ–M and L–H are in the basal planes, exhibiting much greater degree of energy dispersion.73 This shows that the electronic effective mass tensor is higher for c-axis conduction compared to that in the ab-plane. Therefore, anisotropic electrical conductivity is predicted for Ti2AlC i.e., the electrical conductivity is higher in the basal plane than that along the c-direction.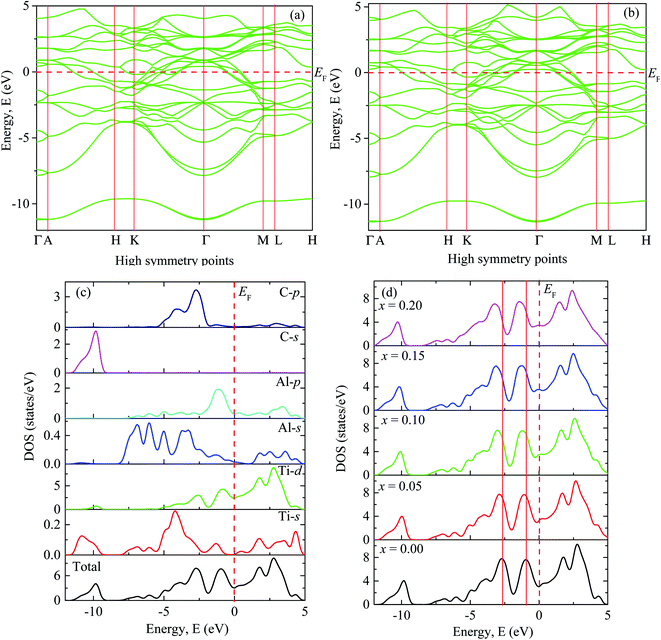 | ||
| Fig. 2 The electronic band structure of (a) Ti2AlC and (b) (Ti0.95Mo0.05)2AlC. Total and partial DOS of (c) Ti2AlC and (d) the total DOS for different Mo contents. | ||
Fig. 2(b) shows the band structure of (Ti0·95Mo0.05)2AlC exhibiting almost similar characteristics except that the position of some of the dispersion curves. These curves are observed to be shifted slightly to lower energy. The band structures (not shown) for other compositions (x = 0.10, 0.15 and 0.20) also show similar nature with shifting of the curves towards lower energy which increases with increasing Mo contents as can be observed from Fig. 2(d).
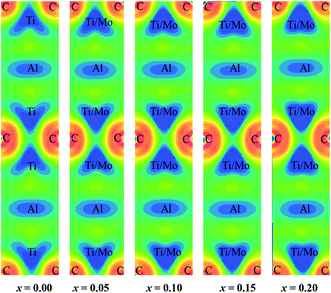
Fig. 2(c) shows total and partial DOS of Ti2AlC which gives better understanding of bonding characteristics in the system. The partial DOS is used to disclose the contribution from different electronic states. The dominating contribution comes from Ti-3d with a very small contribution from Al-3p orbital at the Fermi level. The hybridization among different states is observed in different energy ranges. The peak in the energy range −9 eV to −11.5 eV comes from hybridization of C-2s and Ti-4s states with a prime contribution from C-2s states. The peak in the range −1.8 eV to −3.6 eV comes from the hybridization of C-2p and Ti-3d states. This bonding is primarily covalent in nature resulting from strong mixing between C-2p and Ti-3d states which dominates the higher energy range. The peak just below the Fermi level is attributed from the hybridization of Ti-3d and Al-3p states that results in a comparatively weaker covalent bonding than the previous one.78 The energy range 0 to 5 eV is dominating by the metal-to-metal dd interactions and anti-bonding states. The covalent bond among the unlike atoms determines the overall bonding strength and consequently the mechanical properties of the MAX phases. The total and partial DOS of Mo substituted compositions are also calculated (not shown) and revealed the same qualitative nature of bonding except the positions of the peaks (energy range of hybridization) that comes from the contribution of Mo-4d sates. The shifting of these peaks can be visualized in Fig. 2(d). Fig. 2(d) shows the total DOS for different Mo contents in which two vertical red solid lines are drawn to refer the position of the peaks for the x = 0 compound. These two reference lines clearly demonstrate the shifting of the peaks towards lower energy with increasing Mo content. The hybridized energy states always give an indication of the bonding strength. In general, lower the energy states stronger the bonding strength. Therefore, lowering of the position of the peaks indicates the better hybridization among different states and stronger covalent bonds between them. The strengthening of the covalent bonds can also be observed from Fig. 3. Fig. 3 shows the charge density mapping (CDM) (in the units of e Å−3) in the (101) crystallographic plane. CDM is an important tool to describe the bonding nature of solids. The occupation positions of atoms have been labeled in the figure. A very clear change is observed in the charge density at the Ti/Mo positions with varying level of Mo substitution. It is quite clear from Fig. 3 that the accumulation of charges at the Ti sites increased to a considerable extent owing to Mo substitution and it increases gradually with increasing Mo contents. Therefore, the strength of covalent bond is expected to increase because of the better mixing of d and p electronic states. Hence, the dominating covalent bond between Ti/Mo-d and C-p states as well as comparatively weaker covalent bond between Ti/Mo-d and Al-p states is assumed to be strengthened. Hence, it is reasonable to expect that the overall bonding strength within (Ti1−xMox)2AlC (0 ≤ x ≤ 0.20) solid solutions will increase owing to Mo substitution and this should be reflected in the enhanced mechanical properties presented in the following section.
3.3. Mechanical properties
The knowledge of elastic properties e.g. stiffness constant, elastic moduli, elastic anisotropy factors and ductile or brittle characteristic is of scientific interest for practical use of engineering materials. The elastic constants studied here are obtained from linear finite strain–stress method as implemented in the CASTEP.79 The stiffness constants (Cij) of (Ti1−xMox)2AlC (0 ≤ x ≤ 0.20) solid solutions are calculated and presented in Table 2. The confirmation of mechanical stability is essential for studying the mechanical properties of a solid and we have checked the mechanical stability conditions of (Ti1−xMox)2AlC (0 ≤ x ≤ 0.20) solid solutions using the Born criteria80 for hexagonal system: C11 > 0, C11 − C12 > 0, C44 > 0, (C11 + C12)C33 − 2C13 > 0. To judge the accuracy of our calculations, the reported elastic constant values of Ti2AlC are also presented herein. Comparison with the calculated values presented here ensures the reliability of our theoretical estimations.| x | C11 | C12 | C13 | C33 | C44 | B | G | Y | υ | G/B | Cauchy pressure | Ref. |
|---|---|---|---|---|---|---|---|---|---|---|---|---|
| a Calculated using published data. | ||||||||||||
| 0.00 | 302 | 59 | 58 | 269 | 107 | 135 | 113 | 265 | 0.17 | 0.84 | −48 | This study |
| 308 | 55 | 60 | 270 | 111 | 137 | 118 | 275a | 0.17a | 0.86a | Ref. 56 and 74 | ||
| 309 | 72 | 68 | 284 | 112 | 146 | 115 | 273 | 0.19 | 0.78a | Ref. 72 | ||
| 301 | 69 | 62 | 266 | 106 | 139 | Ref. 81 | ||||||
| 306 | 59 | 59 | 272 | 109 | 138 | Ref. 82 | ||||||
| 302 | 68 | 64 | 268 | 107 | 141 | 111 | 264 | 0.18 | 0.79a | Ref. 83 | ||
| 0.05 | 304 | 68 | 66 | 277 | 116 | 143 | 116 | 274 | 0.18 | 0.81 | −49 | |
| 0.10 | 307 | 55 | 73 | 280 | 122 | 145 | 119 | 280 | 0.18 | 0.82 | −67 | |
| 0.15 | 304 | 54 | 84 | 272 | 128 | 148 | 120 | 283 | 0.18 | 0.81 | −74 | |
| 0.20 | 323 | 62 | 83 | 278 | 131 | 154 | 124 | 293 | 0.18 | 0.81 | −69 | |
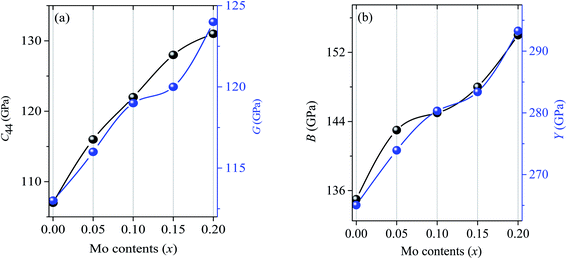
Additionally, the uniaxial directional elastic behaviors can also be understood from the elastic constants. Like the usual trends in MAX phases, the values of C11 are observed to be higher than C33 for (Ti1−xMox)2AlC solid solutions. The C11 and C33 measure the resistance required to compress the compound along100 (along a-axis) direction and along [001] (along c-axis) direction, respectively. The higher values of C11 and C33 are found in Mo substituted compositions revealing the increased bonding strength both along a and c directions. Another important stiffness constant C44 also known as shear stiffness, by itself corresponds to a change in shape keeping the volume unchanged and provides with the information regarding hardness directly.84 The C44 is also found to be increased by 8.4%, 14.0%, 19.6% and 22.4% for x = 0.05, 0.10, 0.15 and 0.20, respectively. The obtained values of C13 and C12 are close to each other as usually observed in MAX phases.21
The mechanical parameters such as bulk moduli (B), shear moduli (G), Young's moduli (Y), Poisson's ratio (υ) are calculated using the formalism that can be found elsewhere.85 The calculated elastic moduli are found in good agreement with the reported values as shown in Table 2. The two main mechanical parameters of polycrystalline solids are bulk and shear moduli. The ability to resist volume deformation and plastic deformation is represented by B and G which are found to be increased by 5.9%, 7.4%, 10.0%, 14.1% and 2.6%, 5.3%, 6.2%, 9.7% for x = 0.05, 0.10, 0.15 and 0.20, respectively. Another important mechanical parameter for polycrystalline solids is the Young's modulus, by itself representing the stiffness of solids where the higher value indicates the stiffer nature and vice versa. The value of Y is found to be increased by 3.3%, 5.6%, 6.8%, 10.6% for x = 0.05, 0.10, 0.15 and 0.20.
As we have already discussed that the direct information regarding hardness can be known from C44 which is found to be increased by 8.4%, 14.0%, 19.6% and 22.4% for x = 0.05, 0.10, 0.15 and 0.20, respectively. The enhancements of mechanical parameters B, G and Y are considerable due to alloying with Mo and are illustrated in Fig. 4. Although, these parameters cannot predict directly the actual hardness of solids, but all these elastic moduli are usually higher for comparatively harder solids.86 It should be noted that Pan et al.59 have measured the Vickers hardness, flexural strength and fracture toughness and found those to be increased with Mo contents with a maximum increase of 44, 34 and 136%, respectively for (Ti0.80Mo0.20)2AlC.
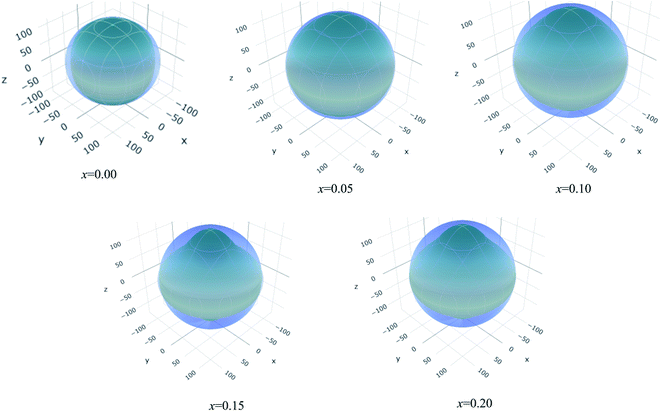
The values of Y, B, G and υ are direction depend that can be presented by three-dimensional (3D) plots. The plotting of 3D contour graphs is an attractive way of presenting the mechanical anisotropy where a perfect sphere designates perfect isotropy of solids and departure from it spherical shape measures the level of anisotropy.91 The 3D plots of Y, B (in terms of compressibility), G and υ of (Ti1−xMox)2AlC solid solutions obtained using the ELATE program92 are shown in Fig. 5–8. These plots were generated from the calculated values of Cij of (Ti1−xMox)2AlC. The anisotropy level of the studied materials can be understood from the figures where the most anisotropic composition is (Ti0.85Mo0.15)2AlC. Various anisotropy indices are also presented in Table 3 where the value of A is 1 for isotropic solids which represents a perfect sphere in the ELATE generated profile.
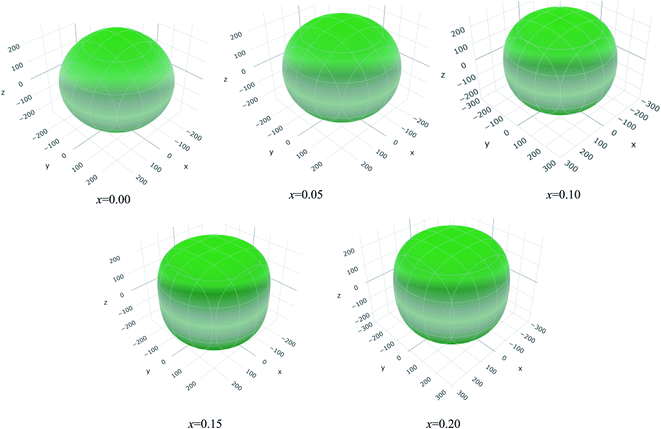 | ||
| Fig. 5 The three-dimensional contour plots of the Young's modulus for (Ti1−xMox)2AlC solid solutions. | ||
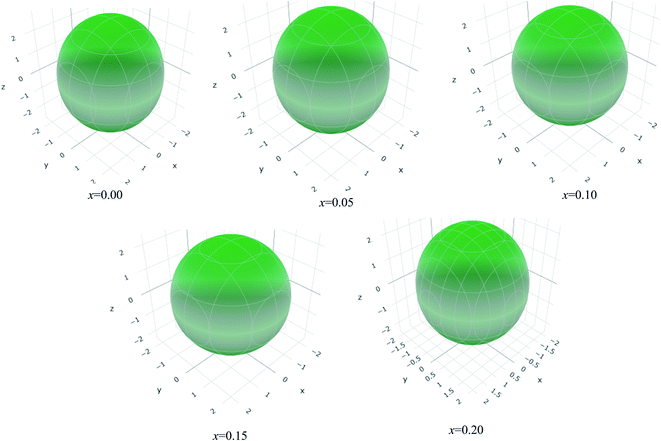 | ||
| Fig. 6 The three-dimensional contour plots of the 1/bulk modulus for (Ti1−xMox)2AlC solid solutions. | ||
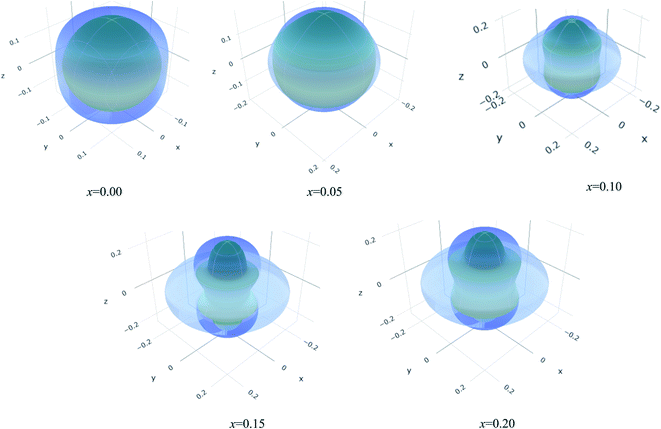 | ||
| Fig. 8 The three-dimensional contour plots of the Poisson's ratio for (Ti1−xMox)2AlC solid solutions. | ||
| x | Ymin (GPa) | Ymax (GPa) | A | (1/B)min (TPa−1) | (1/B)max (TPa−1) | A | Gmin (GPa) | Gmax (GPa) | A | υmin (GPa) | υmax (GPa) | A |
|---|---|---|---|---|---|---|---|---|---|---|---|---|
| 0.00 | 251 | 282 | 1.12 | 2.3 | 2.7 | 1.15 | 108 | 121 | 1.12 | 0.15 | 0.19 | 1.25 |
| 0.05 | 254 | 279 | 1.10 | 2.2 | 2.5 | 1.13 | 112 | 118 | 1.05 | 0.16 | 0.19 | 1.16 |
| 0.10 | 250 | 289 | 1.15 | 2.3 | 2.4 | 1.04 | 109 | 125 | 1.14 | 0.13 | 0.22 | 1.78 |
| 0.15 | 233 | 296 | 1.27 | 2.2 | 2.2 | 1.01 | 100 | 128 | 1.27 | 0.10 | 0.27 | 2.69 |
| 0.20 | 242 | 306 | 1.26 | 2.0 | 2.3 | 1.12 | 107 | 131 | 1.22 | 0.12 | 0.26 | 2.06 |
The three shear anisotropic factors A1, A2 and A3 correspond to three independent elastic shear constants for hexagonal crystals and are calculated using the formalism that can be found elsewhere.28 The values of Ai's are not 1 (for isotropic solids, Ai = 1), revealed the anisotropic nature of the (Ti1−xMox)2AlC solid solutions. The universal anisotropic index  of (Ti1−xMox)2AlC solid solutions are also calculated and found to have non-zero value, revealing the anisotropic nature of the (Ti1−xMox)2AlC solid solutions93 (Table 4).
| x | A1 | A2 | A3 | AU |
|---|---|---|---|---|
| 0.00 | 1.04 | 0.88 | 0.91 | 0.22 |
| 0.05 | 0.95 | 0.98 | 0.94 | 0.23 |
| 0.10 | 0.86 | 0.97 | 0.83 | 0.19 |
| 0.15 | 0.74 | 1.02 | 0.75 | 0.19 |
| 0.20 | 0.77 | 1.00 | 0.78 | 0.15 |
3.4. Thermodynamic properties
The important thermodynamic properties such as Debye temperature, minimum thermal conductivity, Grüneisen parameter and melting temperature of the (Ti1−xMox)2AlC solid solutions are studied in this section.One of the fundamental characteristics parameters of solids is the Debye temperature (ΘD) which promotes understanding of a number of important physical parameters by correlating the mechanical properties with thermodynamic properties such as phonons, lattice vibrations, enthalpy, thermal conductivity, melting point, specific heat etc.94 A simple but widely used method (details can be found elsewhere95–97) proposed by Anderson98 has been used to calculate ΘD using the average sound velocity in (Ti1−xMox)2AlC solid solutions. The sound velocities were determined from the elastic constants and crystal density of the compounds under consideration.
Table 5 displays the obtained values of sound velocities and ΘD for different Mo content along with the previously reported values for Ti2AlC to assess the reliability of our calculations. The values of transverse sound velocity is much lower than the longitudinal sound velocity;99 more energy is required to vibrate neighboring atoms during the propagation of transverse wave that results in the loss of wave energy and hence reduced the wave velocity. The calculated values of ΘD presented in Table 5 are observed to vary in opposing trend of mechanical properties. As we know, in general, ΘD are higher for harder solids100,101 and the hardness is assumed to be increased with increased elastic constants and moduli but the ΘD is observed to be decreased with Mo contents. This apparent contradiction vanishes when we take into consideration of the much larger atomic weight of Mo (95.95) compared to Ti (46.86). In fact, within the harmonic approximation, the Debye frequency (equivalently the Debye temperature) varies inversely with the square-root of the atomic weight. Therefore, the slight reduction in the ΘD with increasing Mo content does not imply that the lattice is becoming less stiff, it rather implies that the lattice is becoming relatively stiffer with Mo substitution when the huge difference in mass between Mo and Ti is properly taken into account. This follows from the harmonic approximation where the frequency (ν) of the phonon mode can be expressed roughly as, ν ∼ (k/M)1/2. Here, k is the stiffness constant or force constant and M is the mass of the atomic species.
| x | ρ (g cm−3) | vl (m s−1) | vt (m s−1) | vm (m s−1) | ΘD (K) | Kmin (W m−1 K−1) | γ | Tm (K) |
|---|---|---|---|---|---|---|---|---|
| a Ref. 72. | ||||||||
| 0.00 | 3.997 | 8453 | 5316 | 5853 | 723 | 8.47 | 1.18 | 1663 |
| 4.013a | 8640a | 5350a | 5900a | 729a | ||||
| 0.05 | 4.172 | 8446 | 5272 | 5808 | 719 | 8.45 | 1.21 | 1681 |
| 0.10 | 4.349 | 8356 | 5230 | 5761 | 715 | 8.43 | 1.20 | 1695 |
| 0.15 | 4.526 | 8248 | 5148 | 5672 | 706 | 8.34 | 1.21 | 1674 |
| 0.20 | 4.705 | 8238 | 5133 | 5656 | 705 | 8.35 | 1.22 | 1740 |
The MAX phase materials are promising candidates for high temperatures applications. Therefore, study of high temperature physical properties is of scientific interest. Like, ΘD, another fundamental physical parameter is the lattice thermal conductivity (Kph), resulting from role of phonon–phonon scattering on thermal transport. At high enough temperatures, the lattice thermal conductivity Kph assumes a minimum constant value (Kmin). The phonons become completely uncoupled and the thermal energy is distributed evenly among the atoms within the solid.102 We have calculated the Kmin using the following equation:103  , where kB, vm, NA and ρ are Boltzmann constant, average phonon velocity, Avogadro's number and density of crystal, respectively and presented those in Table 5. The values Kmin are observed to decrease very slowly with increasing Mo contents. This is largely due to the increase in the crystal density with increasing level of Mo substitution. The Grüneisen parameter (γ) provides the information regarding anharmonic effect in crystalline solids attributed from lattice dynamics. The Grüneisen parameter is calculated using Poisson's ratio:
  .104 The calculated values lie in the range of 0.85 to 3.53 for Poisson's ratio within the range 0.05–0.46 for diverse class of polycrystalline materials.105 Relatively low and almost constant values of γ of (Ti1−xMox)2AlC imply that anharmonic effects are low in all these alloys. The knowledge of melting temperature (Tm) of MAX phases is very important as they are potential candidates for high temperature applications. We have calculated the melting temperature of (Ti1−xMox)2AlC solid solutions via the empirical formula:106
  . The increased values of Tm owing to Mo substitution indicates that compared to Ti2AlC, Mo substituted alloys are more suitable for high temperature applications.
4. Conclusions
In this paper Mo-substituted MAX phase solid solutions (Ti1−xMox)2AlC (0 ≤ x ≤ 0.20) have been investigated by density functional theory. The calculated lattice constants of Ti2AlC, a and c are just 0.29% and 0.69%, respectively higher than the experimental values71 and also comparable with the reported values of the parent phase Ti2AlC.72–75 This demonstrates high level of reproducibility and reliability of our calculations. The nonexistence of energy band gap in the electronic band structure and finite DOS (∼3.0 states per eV) at the Fermi level clearly reveal the metallic nature of the studied solid solutions where the electrical conductivity is expected to be strongly anisotropic. The shifting of dispersion curves in the band structure and peaks in the TDOS towards lower energy and increased accumulation of charge carriers at Ti/Mo sites due to Mo substitution indicate the strengthening of the covalent bonds between unlike atoms (metal-d and C-p states and metal-d and Al-p states). As a consequence various mechanical properties are enhanced. The Fermi level is located in the middle of bonding and antibonding peaks in the TDOS curves (Fig. 2(d)), suggesting a high degree of electronic stability of the studied solid solutions. The computed stiffness constants (Cij) and polycrystalline elastic constants and ratios (B, G, Y, G/B and υ) are found in good accord with the reported values (for x = 0.0).56,72,74,81–83 The mechanical stability of the studied solid solutions is validated by Born criteria based on the values of Cij. The single crystal elastic constants (C11, C33 and C44) and other mechanical parameters of studied solid solutions are found to be increased by a considerable extent owing to Mo substitution for Ti which suggests enhanced mechanical hardness for the same. The values of C11, C33, C44, B, G and Y are increased by 6.5%, 3.3%, 22.4%, 14.0%, 9.7% and 10.5%, respectively for (Ti0.80Mo0.20)2AlC. The Pugh ratio (greater than 0.571), Poisson's ratio (less than 0.26) and Cauchy pressure (−48 to −74 GPa) confirm the brittleness of the studied compositions. The 3D contour plots of elastic moduli (B, G, Y and υ), shear anisotropic factors and universal anisotropy index reveal the anisotropic nature of the considered solid solutions. The values of Debye temperature (quite high compared to many other MAX phases107–110) and minimum thermal conductivity decrease (e.g., ΘD: from 723 K for x = 0.00 to 705 K for x = 0.20) while the Grüneisen parameter and melting temperature (γ: from 1.18 to 1.22 and Tm: from 1663 K to 1740 K for x = 0.00 and x = 0.20, respectively) are noted to be increased due to Mo substitution.To summarize, this study has found that Mo substitution can lead to significant improvement of the mechanical and thermo-physical properties of MAX phase (Ti1−xMox)2AlC solid solutions. Therefore, we hope that the scientific community will be inspired to synthesize and study the Mo substituted solids solutions of 211 MAX phases belonging to different sub-classes in future.
Author contributions
M. A. A. designed the project, performed the analysis and wrote the draft manuscript. S. H. N. finalized the draft paper and supervised the project.Data availability
The data sets generated and/or analyzed in this study are available from the corresponding authors on reasonable request.Conflicts of interest
The authors declare no competing interests.References
- M. W. Barsoum, MAX Phases, Properties of Machinable Ternary Carbides and Nitrides, Wiley, New York, 2013 Search PubMed.
- M. Magnuson and M. Mattesini, Thin Solid Films, 2017, 621, 108 CrossRef CAS.
- M. R. Khatun, M. A. Ali, F. Pervin and A. K. M. A. Islam, Results Phys., 2017, 7, 3634 CrossRef.
- M. Radovic and M. W. Barsoum, Am. Ceram. Soc. Bull., 2013, 92, 20 CAS.
- T. Cabioch, P. Eklund, V. Mauchamp, M. Jaouen and M. W. Barsoum, J. Eur. Ceram. Soc., 2013, 33, 897 CrossRef CAS.
- M. W. Barsoum, Prog. Solid State Chem., 2000, 28, 201 CrossRef CAS.
- W. Jeitschko, H. Nowotny and F. Benesovsky, J. Less-Common Met., 1964, 7, 133 CrossRef CAS.
- H. Wolfsgruber, H. Nowotny and F. Benesovsky, Monatsh. Chem., 1967, 98, 2401 CrossRef.
- H. Nowotny, Prog. Solid State Chem., 1970, 2, 27 CrossRef.
- H. Nowotny, J. C. Schuster and P. Rogl, J. Solid State Chem., 1982, 44, 126 CrossRef CAS.
- M. W. Barsoum and T. El-Raghy, J. Am. Ceram. Soc., 1996, 79, 1953 CrossRef CAS.
- P. Eklund, M. Beckers, U. Jansson, H. Högberg and L. Hultman, Thin Solid Films, 2010, 518, 1851 CrossRef CAS.
- M. W. Barsoum and T. El-Raghy, J. Am. Ceram. Sci., 2001, 89, 334 Search PubMed.
- C. Hu, H. Zhang, F. Li, Q. Huang and Y. Bao, Int. J. Refract. Met. Hard Mater., 2013, 36, 300 CrossRef CAS.
- M. Sokol, V. Natu, S. Kota and M. W. Barsoum, Trends Chem., 2019, 1, 210 CrossRef.
- S. Aryal, R. Sakidja, M. W. Barsoum and W. M. Ching, Phys. Status Solidi B, 2014, 251, 1480 CrossRef CAS.
- X. He, Y. Bai, C. Zhu, Y. Sun, M. Li and M. W. Barsoum, Comput. Mater. Sci., 2010, 49, 691 CrossRef CAS.
- D. Horlait, S. Grasso, A. Chroneos and W. E. Lee, Mater. Res. Lett., 2016, 4, 137 CrossRef CAS.
- D. Horlait, S. Grasso, N. Al Nasiri, P. A. Burr and W. E. Lee, J. Am. Ceram. Soc., 2016, 99, 682 CrossRef CAS.
- A. Talapatra, T. Duong, W. Son, H. Gao, M. Radovic and R. Arróyave, Phys. Rev. B, 2016, 94, 104106 CrossRef.
- M. Roknuzzaman, M. A. Hadi, M. A. Ali, M. M. Hossain, M. M. Uddin, J. A. Alarco and K. Ostrikov, J. Alloys Compd., 2017, 727, 616 CrossRef CAS.
- M. A. Rayhan, M. A. Ali, S. H. Naqib and A. K. M. A. Islam, J. Sci. Res., 2015, 7, 53 CrossRef CAS.
- M. A. Ali, M. T. Nasir, M. R. Khatun, A. K. M. A. Islam and S. H. Naqib, Chin. Phys. B, 2016, 25, 103102 CrossRef.
- M. S. Ali, M. A. Rayhan, M. A. Ali, R. Parvin and A. K. M. A. Islam, J. Sci. Res., 2016, 8, 109 CrossRef CAS.
- M. A. Ali, M. S. Ali and M. M. Uddin, Indian J. Pure Appl. Phys., 2016, 54, 386 Search PubMed.
- M. A. Ali, M. R. Khatun, N. Jahan and M. M. Hossain, Chin. Phys. B, 2017, 26, 033102 CrossRef.
- M. A. Ali, M. M. Hossain, M. A. Hossain, M. T. Nasir, M. M. Uddin, M. Z. Hasan, S. H. Naqib and A. K. M. A. Islam, J. Alloys Compd., 2018, 743, 146 CrossRef CAS.
- M. A. Ali, M. M. Hossain, N. Jahan, A. K. M. A. Islam and S. H. Naqib, Comput. Mater. Sci., 2017, 131, 139 CrossRef CAS.
- C. Zuo and C. Zhong, Mater. Chem. Phys., 2020, 250, 123059 CrossRef CAS.
- G. Qing-He, X. Zhi-Jun, T. Ling, Z. Xianjun, J. Guozhu, D. An, L. Rong-Feng, G. Yun-Dong and Y. Ze-Jin, Comput. Mater. Sci., 2016, 118, 77 CrossRef.
- M. Ashton, R. G. Hennig, S. R. Broderick, K. Rajan and S. B. Sinnott, Phys. Rev. B, 2016, 94, 054116 CrossRef.
- P. Chakraborty, A. Chakrabarty, A. Dutta and T. S. Dasgupta, Phys. Rev. Mater., 2018, 2, 103605 CrossRef.
- C. Lu, B. Yan, G. Hug, Z. Sun and P. Zhang, Mater. Res. Express, 2019, 6, 115213 CrossRef.
- D. Pinek, T. Ito, M. Ikemoto, K. Yaji, M. Nakatake, S. Shin and T. Ouisse, Phys. Rev. B, 2019, 100, 075144 CrossRef CAS.
- R. Benitez, W. H. Kan, H. Gao, M. O'Neal, G. Proust, A. Srivastava and M. Radovic, Acta Mater., 2020, 189, 154 CrossRef CAS.
- L.-C. Zhang, L.-Y. Chen and L. Wang, Adv. Eng. Mater., 2019 DOI:10.1002/adem.201901258.
- W. Yu, M. Vallet, B. Levraut, V. G. Brunet and S. Dubois, J. Eur. Ceram. Soc., 2020, 40, 1820 CrossRef CAS.
- J. Haemers, R. Gusmão and Z. Sofer, Small Methods, 2020, 4, 1900780 CrossRef CAS.
- X. H. Wang and Y. C. Zhou, Corros. Sci., 2003, 45, 891 CrossRef CAS.
- M. Haftani, M. S. Heydari, H. R. Baharvandi and N. Ehsani, Int. J. Refract. Met. Hard Mater., 2016, 61, 51 CrossRef CAS.
- M. Sundberg, G. Malmqvist, A. Magnusson and T. El-Raghy, Ceram. Int., 2004, 30, 1899 CrossRef CAS.
- T. H. Scabarozi, S. Amini, O. Leaffer, A. Ganguly, S. Gupta, W. Tambussi, S. Clipper, J. E. Spanier, M. W. Barsoum, J. D. Hettinger and S. E. Lofland, J. Appl. Phys., 2009, 105, 013543 CrossRef.
- Y. Fei, Thermal Expansion, American Geophysical Union, 1995, p. 29 Search PubMed.
- D. R. Clarke, M. Oechsner and N. P. Padture, MRS Bull., 2012, 37, 891 CrossRef CAS.
- J. Zhu, R. Pan and F. Wang, J. Mater. Res., 2013, 28, 2164 CrossRef CAS.
- I. Salama, T. El-Raghy and M. W. Barsoum, J. Electrochem. Soc., 2003, 150, C152 CrossRef CAS.
- G. Bei, B.-J. Pedimonte, T. Fey and P. Greil, J. Am. Ceram. Soc., 2013, 96, 1359 CrossRef CAS.
- J. Gu, L. Pan, J. Yang, L. Yu, H. Zhang, W. Zou and C. Xu, J. Eur. Ceram. Soc., 2016, 36, 1001 CrossRef CAS.
- H. B. Zhang, Y. C. Zhou, Y. W. Bao and M. S. Li, Acta Mater., 2004, 52, 3631 CrossRef CAS.
- Y. Zhou, H. Zhang, M. Liu, J. Wang and Y. Bao, Mater. Res. Innovations, 2004, 8, 97 CrossRef CAS.
- W. Yu, S. Li and W. G. Sloof, J. Mater. Sci. Eng. A, 2010, 527, 5997 CrossRef.
- T. Lapauw, D. Tytko, K. Vanmeensel, S. Huang, P.-P. Choi, D. Raabe, E. N. Caspi, O. Ozeri, M. Baben, J. M. Schneider, K. Lambrinou and J. Vleugels, Inorg. Chem., 2016, 55, 5445 CrossRef CAS PubMed.
- O. Berger, C. Leyens, S. Heinze, M. Baben and J. M. Schneider, Proc. 4th Int. Conf. Self-healing Matter. (ICSHM 2013), 2013, p. 319 Search PubMed.
- I. Salama, T. El-Raghy and M. W. Barsoum, J. Alloys Compd., 2002, 347, 271 CrossRef.
- M. W. Barsoum, M. Ali and T. El-Raghy, Metall. Mater. Trans. A, 2000, 31, 1857 CrossRef.
- J. Y. Wang and Y. C. Zhou, J. Phys.: Condens. Matter, 2004, 16, 2819 CrossRef CAS.
- F. L. Meng, Y. C. Zhou and J. Y. Wang, Strengthening of Ti2AlC by substituting Ti with V, Scr. Mater., 2005, 53, 1369 CrossRef CAS.
- M. W. Barsoum, T. El-Raghy and M. Ali, Metall. Mater. Trans. A, 2000, 31, 1857 CrossRef.
- R. Pan, J. Zhu and Y. Liu, Mater. Sci. Technol., 2018, 34, 1064 CrossRef CAS.
- Y. Li, N. Liu and X. B. Zhang, et al., Int. J. Refract. Met. Hard Mater., 2008, 26, 190 CrossRef CAS.
- S. J. Clark, M. D. Segall, C. J. Pickard, P. J. Hasnip, M. I. Probert, K. Refson and M. C. Payne, Z. Kristallogr. - Cryst. Mater., 2005, 220, 567 CAS.
- P. Hohenberg and W. Kohn, Phys. Rev., 1964, 136, B864 CrossRef.
- W. Kohn and L. J. Sham, Phys. Rev., 1965, 140, A1133 CrossRef.
- J. P. Perdew, K. Burke and M. Ernzerhof, Phys. Rev. Lett., 1996, 77, 3865 CrossRef CAS PubMed.
- H. J. Monkhorst and J. D. Pack, Phys. Rev. B: Solid State, 1976, 13, 5188 CrossRef.
- T. H. Fischer and J. Almlöf, J. Phys. Chem., 1992, 96, 9768 CrossRef CAS.
- M. A. Ali and A. K. M. A. Islam, Phys. B, 2012, 407, 1020 CrossRef CAS.
- S.-Y. Liu, Y. Meng, S. Liu, D.-J. Li, Y. Li, Y. Liu, Y. Shen and S. Wang, Phys. Chem. Chem. Phys., 2017, 19, 22190 RSC.
- Z. J. Yang, R. F. Linghu, Q. H. Gao, H. N. Xiong, Z. J. Xu, L. Tang and G. Z. Jia, Comput. Mater. Sci., 2017, 127, 251 CrossRef CAS.
- S.-Y. Liu, Y. Meng, S. Liu, D.-J. Li, Y. Li, Y. Liu, Y. Shen and S. Wang, J. Am. Ceram. Soc., 2017, 100, 1221 CrossRef CAS.
- G. Hug, M. Jaouen and M. Barsoum, Phys. Rev. B: Condens. Matter Mater. Phys., 2005, 71, 024105 CrossRef.
- J. Tan, H. Han, D. Wickramaratne, W. Liu, M. Zhao and P. Huai, J. Phys. D: Appl. Phys., 2014, 47, 215301 CrossRef.
- Y. Zhou and Z. Sun, Phys. Rev. B: Condens. Matter Mater. Phys., 2000, 61, 12570 CrossRef CAS.
- J. Wang and Y. Zhou, Phys. Rev. B: Condens. Matter Mater. Phys., 2004, 69, 214111 CrossRef.
- Z. M. Sun, R. Ahuja, S. Li and J. M. Schneider, Appl. Phys. Lett., 2003, 83, 899 CrossRef CAS.
- L. Vegard, Z. Phys., 1921, 5, 17 CrossRef CAS.
- M. W. Baroum, D. Brodkin and T. El-Raghy, Scr. Mater., 1997, 36, 535 CrossRef.
- J. Emmerlich, D. Music, A. Houben, R. Dronskowski and J. Schneider, Phys. Rev. B: Condens. Matter Mater. Phys., 2007, 76, 224111 CrossRef.
- F. D. Murnaghan, Finite Deformation of an Elastic Solid, Wiley, New York, 1951 Search PubMed.
- M. Born, Math. Proc. Cambridge Philos. Soc., 1940, 36, 160 CrossRef CAS.
- W. Y. Ching, Y. Mo, S. Aryal and P. Rulis, J. Am. Ceram. Soc., 2013, 96, 2292 CrossRef CAS.
- J. Wang, J. Wang, A. Li, J. Li and Y. Zhou, J. Am. Ceram. Soc., 2014, 97, 1202 CrossRef CAS.
- T. Duong, S. Gibbons, R. Kinra and R. Arróyave, J. Appl. Phys., 2011, 110, 093504 CrossRef.
- S. H. Jhi, J. Ihm, S. G. Louie and M. L. Cohen, Nature, 1999, 399, 132 CrossRef CAS.
- M. A. Ali, A. K. M. A. Islam and M. S. Ali, J. Sci. Res., 2012, 4, 1 Search PubMed.
- M. A. Ali, A. K. M. A. Islam, N. Jahan and S. Karimunnesa, Int. J. Mod. Phys. B, 2016, 30, 1650228 CrossRef CAS.
- S. F. Pugh, Philos. Mag., 1954, 45, 823 CAS.
- I. N. Frantsevich, F. F. Voronov and S. A. Bokuta, Elastic constants and elastic moduli of metals and insulators handbook, Naukova Dumka, Kiev, 1983, vol. 60, p. 180 Search PubMed.
- D. G. Pettifor, J. Mater. Sci. Technol., 1992, 8, 345 CrossRef CAS.
- H. M. Ledbetter and A. Migliori, J. Appl. Phys., 2006, 100, 063516 CrossRef and the references therein.
- W. C. Hu, Y. Liu, D. J. Li, X. Q. Zeng and C. S. Xu, Comput. Mater. Sci., 2014, 83, 27 CrossRef CAS.
- R. Gaillac, P. Pullumbi and F. X. Coudert, J. Phys. Condens. Matter., 2016, 28, 275201 CrossRef PubMed.
- S. I. Ranganathan and M. Ostoja-Starzewski, Phys. Rev. Lett., 2008, 101, 055504 CrossRef PubMed.
- X. Luo and B. Wang, J. Appl. Phys., 2008, 104, 073518 CrossRef.
- M. A. Ali, M. A. Hadi, M. M. Hossain, S. H. Naqib and A. K. M. A. Islam, Phys. Status Solidi B, 2017, 254, 1700010 CrossRef.
- M. T. Nasir, M. A. Hadi, M. A. Rayhan, M. A. Ali, M. M. Hossain, M. Roknuzzaman, S. H. Naqib, A. K. M. A. Islam, M. M. Uddin and K. Ostrikov, Phys. Status Solidi B, 2017, 254, 1700336 CrossRef.
- P. Barua, M. M. Hossain, M. A. Ali, M. M. Uddin, S. H. Naqib and A. K. M. A. Islam, J. Alloys Compd., 2019, 770, 523 CrossRef CAS.
- O. L. Anderson, J. Phys. Chem. Solids, 1963, 24, 909 CrossRef CAS.
- V. K. Lakhani and K. B. Modi, Solid State Sci., 2010, 12, 2134 CrossRef CAS.
- M. A. Ali, N. Jahan and A. K. M. A. Islam, J. Sci. Res., 2014, 6, 407 CrossRef.
- X. H. Deng, B. B. Fan and W. Lu, Solid State Commun., 2009, 149, 441 CrossRef CAS.
- A. Du, C. Wan, Z. Qu and W. Pan, J. Am. Ceram. Soc., 2009, 92, 2687 CrossRef CAS.
- G. A. Slack, Solid State Phys., 1979, 34, 1 CAS.
- V. Belomestnykh and E. Tesleva, Tech. Phys., 2004, 49, 1098 CrossRef CAS.
- S. Y. Mikitishin, Fiz.-Khim. Mekh. Mater., 1982, 18, 84 Search PubMed.
- M. E. Fine, L. D. Brown and H. L. Marcus, Scr. Metall., 1984, 18, 951 CrossRef CAS.
- M. A. Hadi, M. A. Rayhan, S. H. Naqib, A. Chroneos and A. K. M. A. Islam, Comput. Mater. Sci., 2019, 170, 109144 CrossRef CAS.
- M. A. Hadi, U. Monira, A. Chroneos, S. H. Naqib, A. K. M. A. Islam, N. Kelaidis and R. V. Vovk, J. Phys. Chem. Solids, 2019, 132, 38 CrossRef CAS.
- M. A. Hadi, N. Kelaidis, S. H. Naqib, A. Chroneos and A. K. M. A. Islam, J. Phys. Chem. Solids, 2019, 129, 162 CrossRef CAS.
- M. A. Hadi, S.-R. G. Christopoulos, S. H. Naqib, A. Chroneos, M. W. Fitzpatrick and A. K. M. A. Islam, J. Alloys Compd., 2018, 748, 804 CrossRef CAS.
| This journal is © The Royal Society of Chemistry 2020 |

