
 Open Access Article
 This Open Access Article is licensed under a Creative Commons Attribution-Non Commercial 3.0 Unported Licence
A dual-mode resonance Rayleigh scattering and colorimetric alkaline phosphatase assay based on in situ ascorbic acid-induced signal generation from manganese dioxide nanosheets†
Shiyu Liu‡
a,
Xiaoxiao Song‡a,
Jinping Lib,
Jiahong Zhoua,
Weidan Na*a and
Dawei Deng *ab
*ab
aDepartment of Biomedical Engineering, School of Engineering, China Pharmaceutical University, Nanjing 211198, China
bDepartment of Pharmaceutical Engineering, School of Engineering, China Pharmaceutical University, Nanjing 211198, China. E-mail: dengdawei@cpu.edu.cn
First published on 26th August 2020
Abstract
Multimode sensing has attracted extensive attention because they provide more than one transduction channel, thus improving accuracy and sensitivity. Due to the structural diversity, MnO2 nanosheets and nanoneedles were successively obtained via one-step redox reaction and different self-assembly methods. MnO2 nanosheets possess outstanding optical properties including extremely strong resonance Rayleigh scattering (RRS) and absorbance signal, and were selected as a dual-mode sensing material. Inspired by the selectivity of alkaline phosphatase (ALP) towards dephosphorylate ascorbic acid 2-phosphate (AAP) to generate ascorbic acid (AA), which has the ability to decompose MnO2 nanosheets along with optical signals and colour change, a dual-mode optical ALP sensing platform has been designed. Therefore, MnO2 nanosheets can serve as colorimetric probes by directly visualizing the colour variation with bare eyes. Moreover, the detection limit obtained by the RRS sensing mode can be as low as 0.17 mU L−1, which is far superior to that obtained by previously reported methods. The strategy not only has good feasibility and sensitivity, but also shows good prospects for a series of ALP-extended sensing applications.
1 Introduction
Alkaline phosphatase (ALP), an important hydrolase in phosphate metabolism, can catalyze the dephosphorylation of numerous substrates.1 It plays an important role in modulating intracellular processes and signal transduction.2 In addition, abnormal ALP expression in serum is tightly related to the occurrence and development of many critical diseases, which make it a crucial diagnostic biomarker.3–5 Moreover, ALP is extensively used as a signal amplifier in immunoassays because of its high turnover rate, good stability, wide substrate specificity and easy antibody labeling.6 To date, various sensing strategies have been fabricated for the quantification of ALP activity. Among them, colorimetric and fluorescence assays have become the first choice in clinical practice due to their simple operation, intuitive reading, rapid response, and high throughput.7–12 However, due to their low sensitivity and limited linear range, they are still not practical.13 Based on the above-mentioned facts, multi-mode and highly sensitive protocols for ALP activity monitoring with rapid qualitative and accurate quantitative characteristics will benefit the diagnoses of diseases and analytical applications.14Resonance Rayleigh scattering is an elastic photon scattering that occurs near the absorption wavelength of the photon.15 Moreover, this scattering can resonate with the absorption of light and consequently induce the enhancement of the scattering intensity.16 Compared with other spectroscopic techniques, the detection limit obtained by the RRS technique is lower by several orders of magnitude.17,18 Furthermore, the RRS intensity is closely related to changes in molecular conformation, shape, size, and interfacial properties. In addition, it can be exploited to investigate hydrogen bonding, hydrophobic interactions, electrostatic attractions, aggregation and decomposition of components in an analyzed system.19–21 Nanomaterials are potential candidates for analyte sensing because their size reduction results in unusually large surface areas and adjustable surface chemistry, which greatly increase the sensitivity of the sensor to changes in the surrounding chemical environment.22,23 In the light of above-mentioned properties, the nanomaterial-based RRS detection method can provide a new pathway for the detection of target.
As a typical nanomaterial with diverse structures, manganese dioxide has excellent properties, such as large specific surface area, excellent biocompatibility, strong oxidation, and catalytical ability.24,25 Notably, with broad and intense absorption spectrum and reductant response degradability, manganese dioxide is frequently exploited either as a quencher in fluorometry or as a probe in colorimetry.26–29 With these aforementioned merits, manganese dioxide is a promising candidate to serve as an excellent RRS sensing material due to its shape and conformation changes. Various methods have been established to synthesize manganese dioxide nanomaterials with different morphological structures, such as spheres, cubes, rods, wires, and flowers.30,31 However, very little research has been done on designing a green, easy-to-handle method for simultaneously preparing manganese dioxide with different shapes and morphologies. Moreover, differences in optical properties among diverse structures need to be studied extensively.
To address the aforementioned issues, MnO2 nanosheets and nanoneedles were synthesized using a facile and green method and were employed as corresponding nanomaterials to study the effect of morphology on optical properties. Based on the excellent optical properties of MnO2 nanosheets, we fabricated an ALP sensing platform via a target-triggered cascade reaction (Scheme 1). Firstly, ALP catalyzed the hydrolysis of AAP to produce AA through an enzymatic dephosphorylation reaction. Then, taking advantage of the in situ generated AA, the sensitive and selective dual-mode assay of ALP activity was realized via the decomposition of MnO2, which was accompanied by a decrease in the RRS intensity and color fading. Subsequently, the activity of ALP could be calculated via the quantitative relation between the RRS intensity and ALP activity. To the best of our knowledge, there is no report on any RRS-colorimetric dual-mode detection system that allows a naked-eye readout and accurate measurement via the ALP-triggered decomposition of MnO2 nanosheets, which serve both as a recognizer and an indicator.
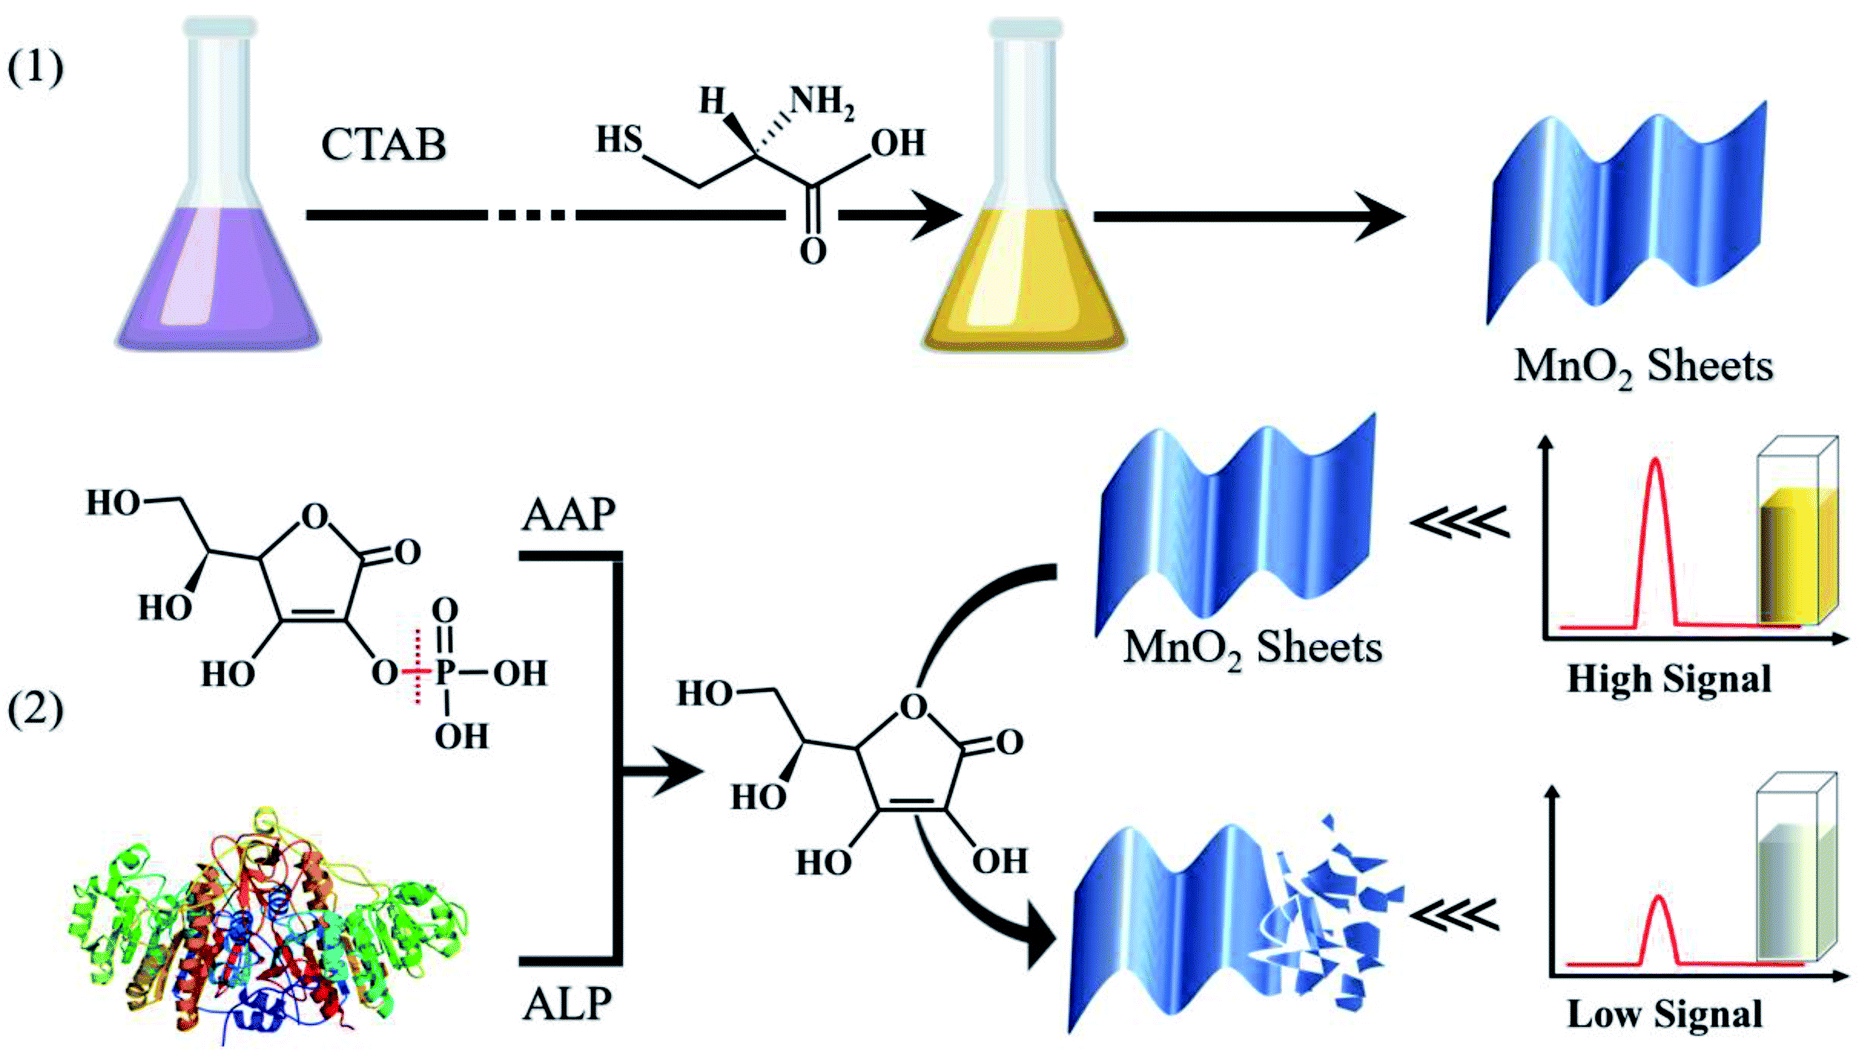 | ||
| Scheme 1 The principle of in situ ALP-induced dual signal generation from MnO2 nanosheets. | ||
2 Experimental section
2.1 Chemicals and reagents
L-Cysteine, cetyltrimethyl ammonium bromide (CTAB), and KMnO4 were obtained from Beijing Chemical Corporation (Beijing, China). Peroxidase from horseradish (HRP), alkaline phosphatase (ALP, from intestinal mucosa), L-ascorbic acid (AA), bovine serum albumin (BSA), tyrosinase, IgG (from human serum), acetylcholinesterase (AChE), glucose oxidase (GOx), dopamine (DA), glutathione (GSH), cysteine (Cys), and trypsin trichloroacetic acid were purchased from Sigma-Aldrich (Shanghai, China). 2-Phosphate trisodium salt (AAP) and reduced N-ethylmaleimide (NEM) were purchased from Aladdin Industrial Corporation (Shanghai, China). Human blood samples were provided by Nanjing Jiangning Hospital. All other chemicals were of analytical grade and used directly without further purification. Ultra-pure water obtained from a Millipore system was used in all experiments.Remark: Human serum samples were provided by Nanjing Jiangning Hospital, and all patients gave informed consent. This study was conducted under the guidance of the Declaration of Helsinki and regulations of the Composition of the Ethics Committee of China Pharmaceutical University (Trial). The experiment was approved by all research centers.
2.2 Apparatus and characterization
Scattered signals were measured with a F97 Pro fluorescence spectrophotometer. The UV-Vis absorption spectra were tested with a ZF-20D7 Dark Box Ultraviolet Analyzer. The TEM images were acquired by an HT7700 transmission electron microscope (Hitachi, Japan, 100 kV). High-resolution TEM (HR-TEM) images were recorded using a JEM-2010 (HR, 200 kV) microscope. FT-IR spectra were recorded using a Bruker Optics VERTEX 70 spectrometer (Ettinger, Germany).2.3 Synthesis of MnO2 nanosheets
The following are the detailed synthesis steps to obtain MnO2 nanosheets. Typically, 1 mL of KMnO4 solution (0.1 mol L−1) was added to 50 mL of the CTAB solution (0.02 mol L−1) in a 100 mL round-bottomed flask. After ultrasonication for uniform dispersion, the colour of the solution gradually changed to claret. Then, 1 mL of L-cysteine solution (0.1 mol L−1) was added into the above mixed solution. The final solution was kept in a 25 °C water bath for 0.5 h and MnO2 nanosheets were obtained after centrifugation at 3000 rpm for 15 min. The precipitate was successively washed three times with ethanol and ultrapure water. Finally, the MnO2 nanosheets were dried in a vacuum freeze-dryer.2.4 Synthesis of MnO2 nanoneedles
The following are the detailed synthesis steps to obtain MnO2 nanoneedles. 2 mL of KMnO4 solution (0.1 mol L−1) was added to 30 mL of CTAB solution (0.02 mol L−1) in a 100 mL round-bottomed flask. After ultrasonication for uniform dispersion, the colour of the solution gradually changed to pink. Then, 2 mL of the L-cysteine solution (0.1 mol L−1) was added into the above solution. The final solution was kept in a 25 °C water bath for 0.5 h and the MnO2 nanoneedles were obtained after centrifugation at 3000 rpm for 15 min. Finally, the precipitate was successively washed three times with ethanol and ultrapure water and then dried in a vacuum freeze-dryer.2.5 Dual mode detection of ALP activity
In the colorimetry-based ALP detection mode, 20 μL of the as-prepared MnO2 nanosheet brown solution (1.8 mmol L−1) and 10 μL of the AAP solution (20 mmol L−1) were mixed with 60 μL of PBS solution (pH 7.4, 1 mmol L−1). Then, the mixture was heated for 5 min in a 37 °C water bath. Next, 5 μL of different volumes of the ALP solution was added to the above mixture. The mixture was placed in the dark at 37 °C and shaken for 30 min. UV-Vis absorption spectra were recorded from 200 to 700 nm.In the RRS-based ALP detection mode, 20 μL of the as-prepared MnO2 nanosheet brown solution (0.06 mmol L−1) and 10 μL of the AAP solution (0.1 mmol L−1) were mixed with 60 μL of PBS solution (pH 7.4, 1 mmol L−1). Then, the mixture was heated for 5 min in a 37 °C water bath. Next, 5 μL of different volumes of the ALP solution were added to the above mixture. Then, the sample was placed in dark at 37 °C and shaken for 30 min. The RRS signals were obtained from 500 to 700 nm using an excitation wavelength of 600 nm.
2.6 ALP activity assay in real sample
10 mg L−1 of N-ethylmaleimide and trichloroacetic acid (quality fraction 1%) were added to 1 mL of the serum samples to deactivate the enzymes/proteins in the serum. Then, the human blood sample was diluted 1000 times with PBS (10 mmol L−1, pH 7.4). Finally, different amounts of ALP spiked with the above diluted FBS solution was used for RRS detection.3 Results and discussion
3.1 Characterization of MnO2 nanostructure
In this work, MnO2 nanosheets were prepared by a simple one-pot chemical reduction of KMnO4 using L-cysteine as the reductant in a diluted CTAB aqueous solution. Initially, the nanostructure and morphology of the as-prepared manganese dioxide were characterized by transmission electron microscopy. Fig. 1A shows that the sample is typically composed of a transparent lamellar structure with sufficient folds and wrinkles, displaying a typical two-dimensional morphology of manganese dioxide. High-resolution TEM evidently showed that the measured neighboring lattice plane spacing was 0.25 nm (Fig. 1B), corresponding to the (101) facet of manganese dioxide.32 Fig. 1C presents the UV-visible spectrum of MnO2 nanosheets, showing a wide absorption band in the range of 200–600 nm, with maximum characteristic absorption at 370 nm, corresponding to the d–d transition of manganese ions in the [MnO6] hexahedron.33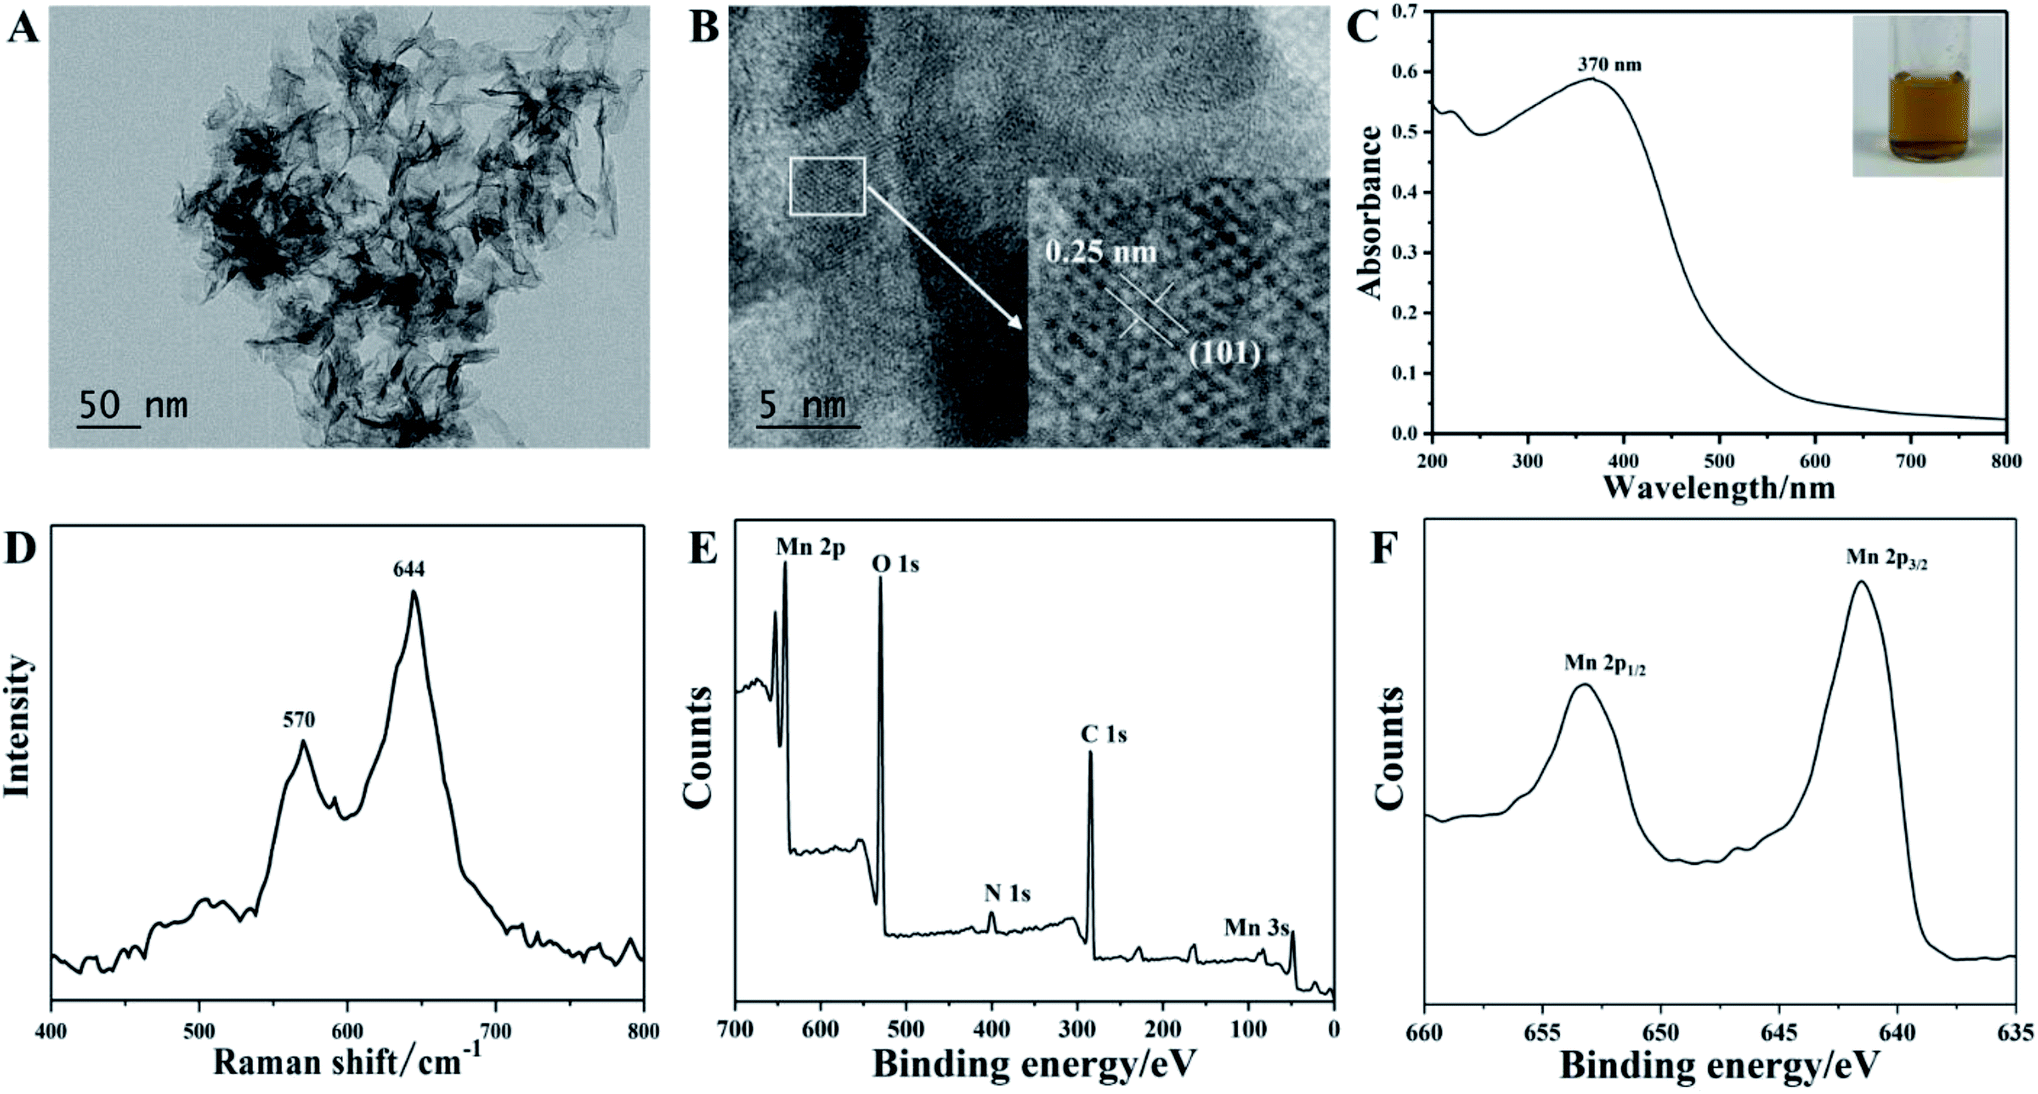 | ||
| Fig. 1 TEM image (A), HR-TEM image (B), UV-Vis spectrum (C), Raman spectrum (D), XPS spectrum (E), Mn 2p corresponding spectrum (F) of the obtained MnO2 nanosheets. | ||
The aqueous solution of MnO2 nanosheets presented a transparent yellow-brown state (Fig. 1C, inset). As shown in Fig. 1D, the Raman spectrum of MnO2 nanosheets reveals two major peaks at 570 cm−1 and 644 cm−1, corresponding to the Mn–O stretching in the base plane of the [MnO6] sheet and the symmetric stretching vibration (Mn–O) of the [MnO6] octahedral structure.34 The XPS result indicated that the sample was composed of Mn, O, C, and N. From the binding energy spectrum analysis in Fig. 1F, we see two peaks centered at 642.3 eV and 653.9 eV, assigned to Mn 2p1/2 and Mn 2p3/2, respectively. A spin energy separation of 11.6 eV indicated that the oxidation state of manganese was tetravalent and proved the existence of MnO2.35 More importantly, FTIR analysis was performed to confirm the surface functional groups of MnO2 nanosheets. As shown in Fig. S1,† the energy band at 525 cm−1 can be attributed to the vibration of the octahedral [MnO6] frame.36 The band at 2917 cm−1 is allocated to the C–H stretching vibration.37 The two bands at 1601 and 3270 cm−1 are attributed to the vibrations of C![[double bond, length as m-dash]](https://www.rsc.org/images/entities/char_e001.gif) O and O–H, further confirming the existence of carboxyl functional groups on the surface of MnO2 nanosheets.38 These results demonstrate that the ultrathin MnO2 nanosheets were successfully synthesized.
O and O–H, further confirming the existence of carboxyl functional groups on the surface of MnO2 nanosheets.38 These results demonstrate that the ultrathin MnO2 nanosheets were successfully synthesized.
3.2 Feasibility study of sensing scheme
With a higher level CTAB solution, another kind of MnO2 nanomaterial can be obtained with the similar method as described above. As shown in Fig. 2A, the MnO2 nanostructure presented a needle-shaped appearance with a middle strip pattern and two sharp ends. The average width of the strip portion is 25 nm, and the length of the overall structure is in the range of several hundred nanometers to several micrometers. Subsequently, we compared and analyzed the UV absorption spectra of MnO2 nanosheets and nanoneedles (Fig. 2B). They have very similar pattern, with nanosheets having better absorption capability at relatively higher wavelength bands, while the nanoneedles have better absorption capability at lower wavelength bands. Under the same absorption intensity at 370 nm, the scattered light intensity of the MnO2 nanosheets was obviously higher than that of the nanoneedles. Moreover, a higher degree change of scattered light can be observed from MnO2 nanosheets via local disintegration of the nanostructure after the addition of the same amount of AA (Fig. 2C). Although the RRS signal of MnO2 nanosheets in the short wavelength region is stronger than that in the long wavelength region (Fig. 2D), previous reports demonstrated that the RRS signal can suffer from low absorbance and scattering interference and show better reproducibility in the longer wavelength region.39 Accordingly, the RRS peak at 600 nm was selected as the analytical signal. Under 600 nm excitation, we observe that the intensity of the RRS spectrum of nanosheets is much higher than that of nanoneedles (Fig. 2E). The above results showed that nanosheets have high responsive ability and are ideal nanomaterials for the fabrication of optical sensing systems. As the ALP-catalysed dephosphorylation showed good selectivity and a rapid optical signal response to the disintegration of MnO2 nanosheets (Fig. 2F and S3, ESI†), MnO2 nanosheet-AAP system can be adopted to monitor the ALP activity with two modes, the colorimetry and the RRS.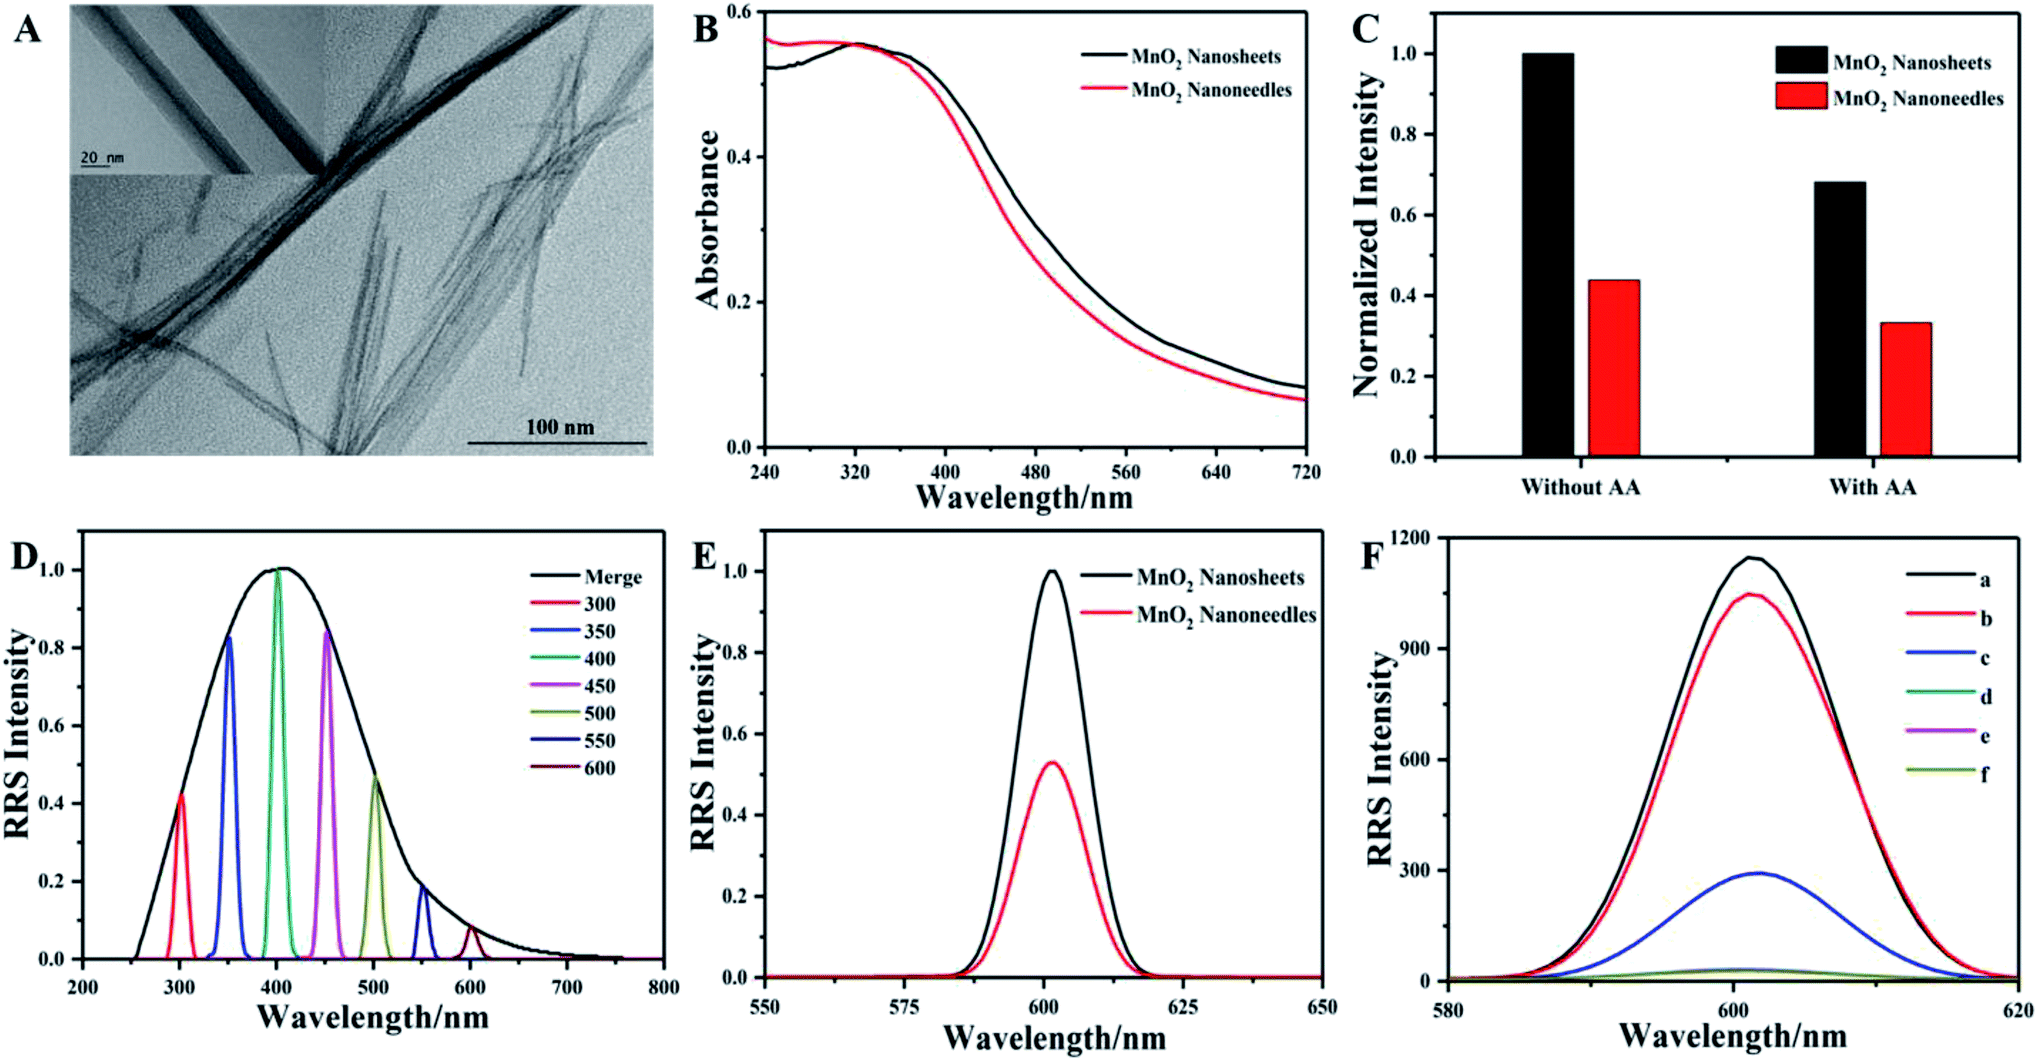 | ||
| Fig. 2 (A) TEM image of MnO2 nanoneedles. (B) The absorbance of MnO2 nanosheets (black line) and MnO2 nanoneedles (red line). (C) The resonance light scattering intensity of MnO2 nanosheets (black bar) and MnO2 nanoneedles (red bar) before and after addition of AA. (D) The RRS spectra of MnO2 nanosheets under various excitation wavelengths. (E) The RRS intensity of MnO2 nanosheets (black line) and MnO2 nanoneedles (red line) with the same absorbance at 370 nm. (F) The RRS intensity of MnO2 nanosheets (a), MnO2-AAP (b), MnO2-AAP-ALP (c), ALP (d), AAP (e), and AAP-ALP (f). | ||
3.3 Analytical performance of the dual-mode sensing platform
In order to obtain a high-performance ALP sensing system, some key experimental parameters were optimized in advance. As for the effect of the concentration of MnO2 and AA, the maximum value of the concentration of manganese dioxide within a linear range that the instrument can measure was selected. A concentration of 50 mg L−1 was used for the UV absorption measurements and 1 mg L−1 was used for the Rayleigh scattering signal measurement (Fig. S2, ESI†). The absorbance was found to decrease along with the increase in AA levels (Fig. 3A and B), giving a minimum absorbance at an AA concentration of 200.0 μmol L−1. Further, it was found that the color of the solution turned to be more remarkable in this linear concentration range (Fig. 3B inset). This phenomenon was also observed in the RRS mode with the introduction of 200 nmol L−1 of AA (Fig. S4, ESI†). Subsequently, we investigated the optical incubation time by measuring the absorbance intensity at 370 nm and RRS intensity at 600 nm. As shown in Fig. S5, ESI,† the absorbance decay rate showed an increase with prolonged incubation time and AAP concentration, and nearly reached a plateau with 30 mmol L−1 of AAP at 20 min. Likewise, the RRS attenuation rate of the sensing system initially showed a positive correlation with the increase in time and AAP growth, and reached a flat state with 30 μmol L−1 of AAP at 20 min (Fig. S5, ESI†). The above results indicated that the cascade reaction needs 20 min to complete the decomposition of manganese dioxide nanosheets under the optimal AAP concentration. In order to ensure a more complete reaction and better experimental reproducibility, 30 min was chosen as the optimal incubation time in the following experiments.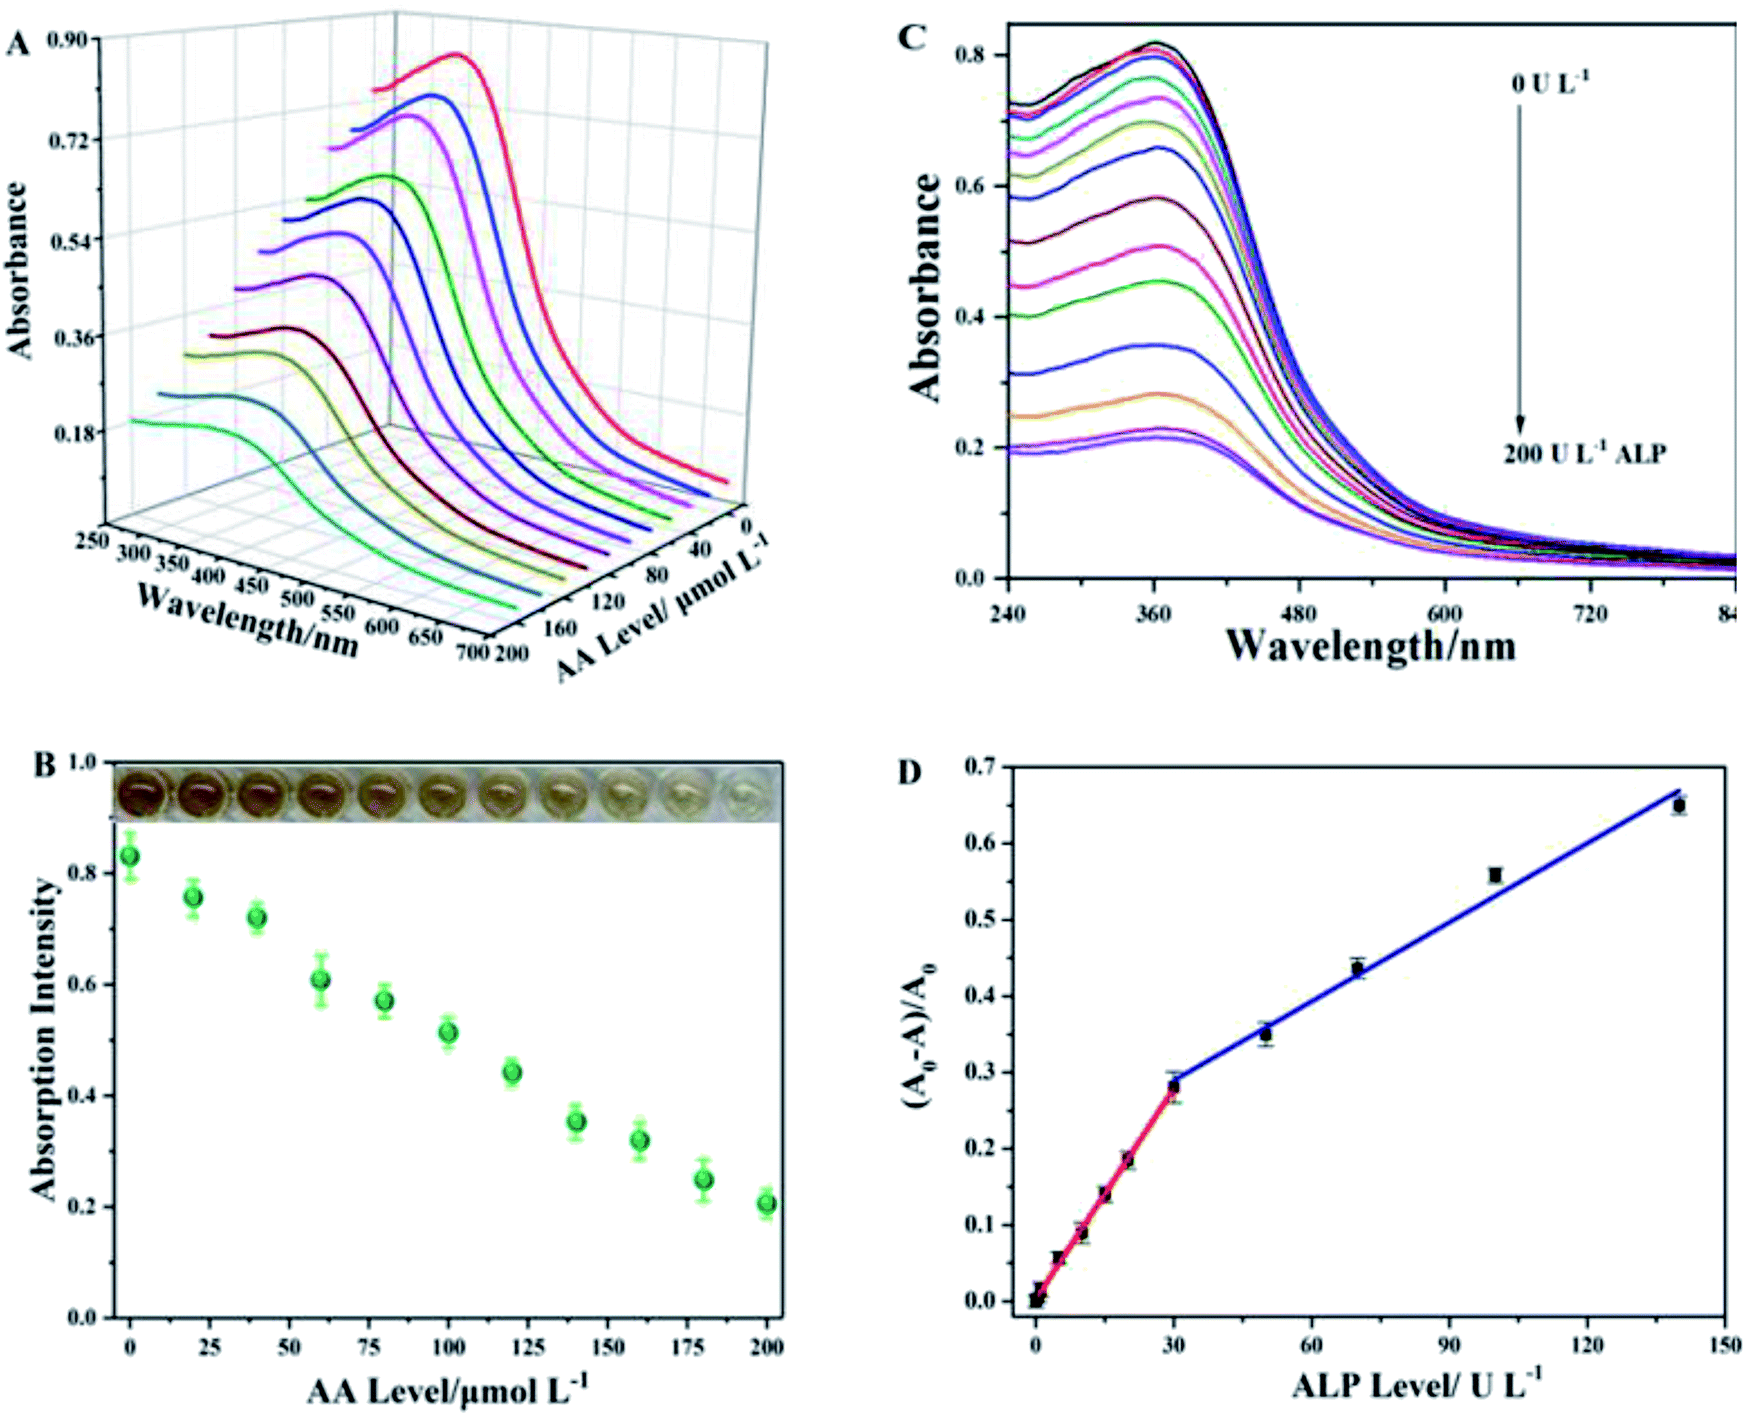 | ||
| Fig. 3 (A) Absorption spectra and (B) the linear relationship of absorbance vs. the different level of AA; inset: the photographs show the visual color change versus corresponding AA activity. Absorption spectra of the sensing system (MnO2 nanosheets-AAP) vs. the ALP level ranging from (C) 0 to 140 U L−1; linear curve of relative intensity [(A0 − A)/A0] versus ALP level ranging from (D) 0.5 to 140 U L−1. Reaction system: 50 mg L−1 MnO2 nanosheets; 10 mmol L−1 phosphate buffer (pH, 7.4). | ||
Under the above optimal experimental conditions, quantitative detection of ALP via colorimetry was performed. Different amounts of ALP were added to the sensing system (MnO2 nanosheet-AAP) to trigger the cascade reaction. As shown in Fig. 3C, the absorption intensity of the sensing system decreased with increase in the ALP concentration. The absorbance quenching ratio at 370 nm linearly increased with ALP concentration ranging from 0.0 to 20.0 U L−1 (Fig. 3D), whose fitting equation can be expressed as (A0 − A)/A0 = 0.0021 + 0.0092 [ALP], U L−1 (R2 = 0.9929). The detection limit for ALP based on the 3δ/s rule was calculated to be 0.16 U L−1. Another fitting equation [(A0 − A)/A0 = 0.1971 + 0.0034 [ALP], (R2 = 0.9751)] can be obtained when the ALP activity is in the range from 30.0 to 140.0 U L−1 (Fig. 3D). The unified linear range (Fig. 3D) was 0.5–30.0; 30.0–140.0 U L−1. Given that the normal ALP activity in human blood in the range of 46–190 U L−1,40 the sensitivity and linear range of our assay were fully competent for ALP analysis of blood samples. The colorimetric method provided a relatively easy operation and signal reading mode.
On the other hand, we further evaluated the performance of the sensing system based on the RRS technology. Fig. 4A depicts the RRS spectra of the MnO2 nanosheet-AAP system at various concentrations of ALP. As expected, the RRS decay rate corresponded to the increasing ALP level in the range from 0.5 to 150 mU L−1 (Fig. 4B). The linear fitting equation can be expressed as (I0 − I)/I0 = 0.0417 + 0.0040 [ALP], mU L−1, (R2 = 0.9982). The LOD for ALP is based on the 3δ/s rule and was calculated to be 0.17 mU L−1. Compared with other reported ALP assays (Table S1, ESI†),41–46 the analytical colorimetric performance of our platform showed a comparable or even better performance in terms of linear range and LOD. Meanwhile, the sensing platform in the RRS mode showed an extremely low detection limit compared to other methods. More attractively, the platform integrated two mode system can offer an extremely cost-effective and convenient tool for other ALP-related sensing fields.
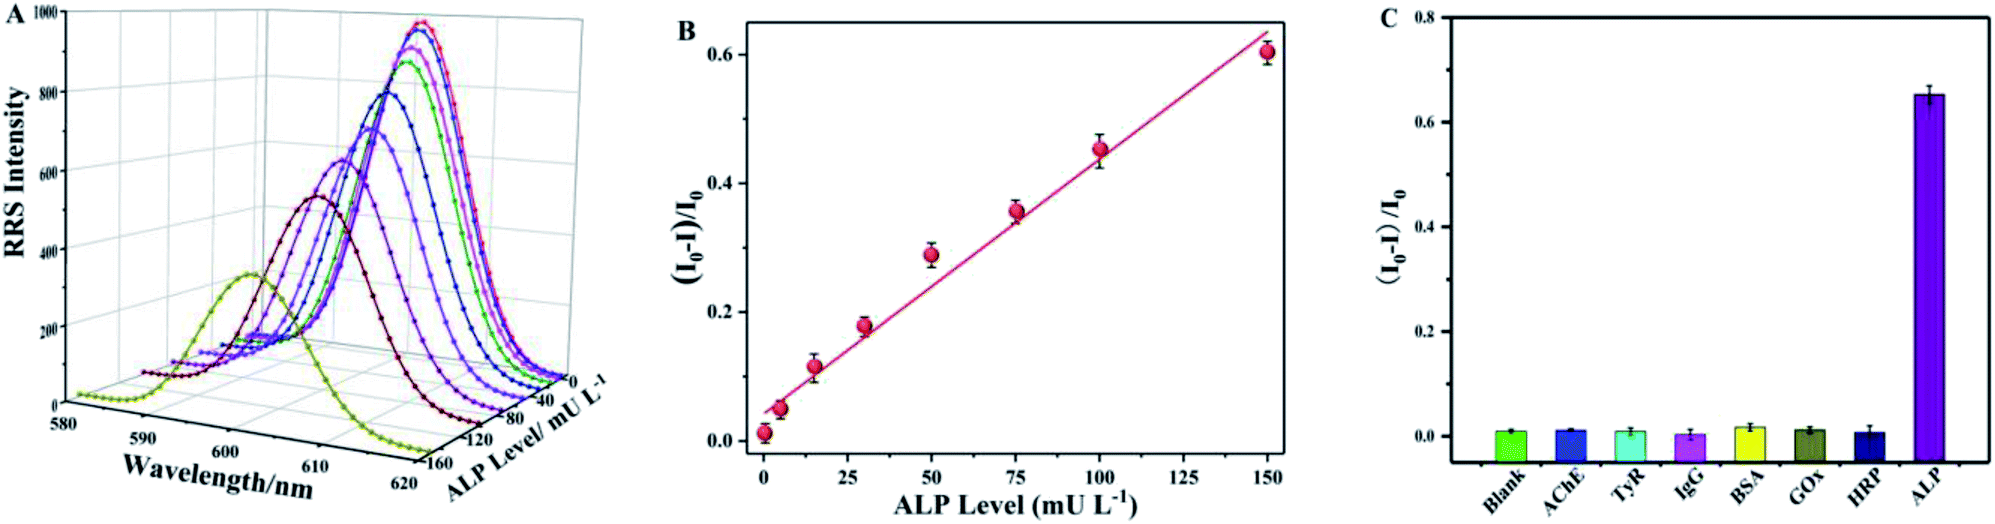 | ||
| Fig. 4 (A) RRS spectra of the sensing system (MnO2 NS-AAP) in the presence of different ALP concentrations (0, 0.5, 5.0, 15.0, 30.0, 50.0, 75.0, 100.0, and 150.0 mU L−1). (B) The linear curve of relative absorbance intensity [(I0 − I)/I0] versus ALP concentrations (0.5 to 150 mU L−1). (C) Absorbance at 370 nm of the proposed colorimetric assay after the addition of ALP and different interferential proteins. The concentration of each interferential protein is 0.1 μmol L−1. | ||
In the presence of this concentration of NEM, 100 μmol L−1 of reducing substances such as GSH or Cys, had little effect on the state of MnO2 (Fig. S6, ESI†). So, the selectivity of our ALP detection strategy was evaluated by monitoring the RRS signal changes of MnO2 nanosheet-AAP in the presence of several non-specific proteins and enzymes, including acetylcholinesterase (AChE), tyrosinase (TyR), immunoglobulin (lgG), bovine serum albumin (BSA), glucose oxidase (GOX), horseradish peroxidase (HRP), and ALP. As depicted (Fig. 4C), only ALP provided a remarkable RRS decrease as compared with these controlled proteins, demonstrating that other substances at relatively low levels (after dilution) had nearly no significant effect on ALP detection. Therefore, this sensing mode based on the RRS technology can realize ALP activity monitoring at a low cost.
3.4 Sensing performances in real samples
Based on the above-mentioned good performance of the MnO2 nanosheet-AAP platform, we further used it to detect ALP activity in actual samples and the use of the masking agent NEM made some biothiols lose the activity. Then, the potential of the protocol for actual sample detection was evaluated by analyzing the recovery rate of ALP with 1000-fold diluted human blood samples. As shown in Table 1, comparing our method with the clinical data, the relative deviation was 7%, indicating that the MnO2 nanosheet-AAP platform is accurate and reliable for the analysis of ALP in clinical practice.| Serum sample | Detected (mU L−1, n = 3) | Clinical (mU L−1) | Relative error (%) |
|---|---|---|---|
| 1# | 47.6 ± 2.1 | 46 | +3.5 |
| 2# | 63.3 ± 2.3 | 67 | −5.5 |
| 3# | 58.9 ± 3.4 | 63 | −6.5 |
| 4# | 75.1 ± 2.8 | 72 | +4.3 |
4 Conclusions
In summary, MnO2 nanosheets and nanoneedles were subsequently synthesized via a facile redox reaction and different self-assembly methods at room temperature. Additionally, the obtained MnO2 nanosheets, with excellent optical performance, can be exploited as a recognizer and signal transducer in the fabrication of a dual-mode ALP sensor. This sensing system, based on the enzyme-triggered and reduction-mediated disassociation of MnO2 nanosheets, not only provided a facile readout based on color change but also showed distinguished sensitivity toward ALP via RRS. In addition, no expensive and complex laboratory setup was used for the satisfactory ALP assay. Hence, the proposed sensing system showed a possibility of ALP clinical diagnosis and a promise in series of ALP-extended detections.Conflicts of interest
There are no conflicts of interest to declare.Acknowledgements
This work was financially supported by the National Natural Science Foundation of China (Nos. 81371627 and 81727804), China Postdoctoral Science Foundation (2018M642370), and the Jiangsu Provincial Natural Science Fund for Distinguished Young Scholars (BK20190028).Notes and references
- S. K. Grunwald and K. J. Krueger, Biochem. Mol. Biol. Educ., 2008, 36, 9–15 CrossRef CAS PubMed.
- K. Ooi, K. Shiraki, Y. Morishita and T. Nobori, J. Clin. Lab. Anal., 2007, 21, 133–139 CrossRef CAS PubMed.
- W. Sun and K. Jiao, Bull. Chem. Soc. Ethiop., 2005, 19, 163–173 CAS.
- J. Kim, T. J. Song, D. Song, H. S. Lee, C. M. Nam, H. S. Nam, Y. D. Kim and J. H. Heo, Stroke, 2013, 44, 3547–3549 CrossRef CAS PubMed.
- J. P. Lalles, EBioMedicine, 2015, 2, 1866 CrossRef PubMed.
- W. X. Jiang, Z. H. Wang, R. C. Beier, H. Y. Jiang, Y. N. Wu and J. Z. Shen, Anal. Chem., 2013, 85, 1995–1999 CrossRef CAS PubMed.
- K. Ye, L. J. Wang, H. W. Song, X. Li and X. H. Niu, J. Mater. Chem. B, 2019, 7, 4794–4800 RSC.
- H. Song, Z. Li, Y. Peng, X. Li, X. Xu, J. Pan and X. Niu, Analyst, 2019, 144, 2416–2422 RSC.
- X. Niu, K. Ye, L. Wang, Y. Lin and D. Du, Anal. Chim. Acta, 2019, 1086, 29–45 CrossRef CAS PubMed.
- H. Song, H. Wang, X. Li, Y. Peng, J. Pan and X. Niu, Anal. Chim. Acta, 2018, 1044, 154–161 CrossRef CAS PubMed.
- Y. Xianyu, Z. Wang and X. Jiang, ACS Nano, 2014, 8, 12741–12747 CrossRef CAS PubMed.
- J. Sun, T. Hu, C. Chen, D. Zhao, F. Yang and X. Yang, Anal. Chem., 2016, 88, 9789–9795 CrossRef CAS PubMed.
- G. N. Bowers Jr and R. B. McComb, Clin. Chem., 1966, 12, 70–89 CrossRef CAS.
- D. Zhao, J. Li, C. Y. Peng, S. Y. Zhu, J. Sun and X. R. Yang, Anal. Chem., 2019, 91, 2978–2984 CrossRef CAS PubMed.
- Z. L. Zhang, M. N. Shneider and R. B. Miles, Phys. Rev. Lett., 2007, 98, 4 Search PubMed.
- N. Pourreza and M. Ghomi, Anal. Chim. Acta, 2019, 1079, 180–191 CrossRef CAS PubMed.
- H. H. Cai, J. Pi, X. Y. Lin, B. L. Li, A. Q. Li, P. H. Yang and J. Y. Cai, Biosens. Bioelectron., 2015, 74, 165–169 CrossRef CAS PubMed.
- M. Chen, H. H. Cai, F. Yang, D. W. Lin, P. H. Yang and J. Y. Cai, Spectrochimica Acta Part A, 2014, 118, 776–781 CrossRef CAS PubMed.
- H. Parham and S. Saeed, Talanta, 2015, 131, 570–576 CrossRef CAS PubMed.
- S. Ngernpimai, P. Matulakun, S. Teerasong, T. Puangmali, A. Kopwitthaya, S. Kanokmedhakul, D. Sangiamdee and A. Chompoosor, Sens. Actuators, B, 2018, 255, 836–842 CrossRef CAS.
- W. Ren, Y. Zhang, H. G. Chen, Z. F. Gao, N. B. Li and H. Q. Luo, Anal. Chem., 2016, 88, 1385–1390 CrossRef CAS PubMed.
- Y. Ling, Z. F. Gao, Q. Zhou, N. B. Li and H. Q. Luo, Anal. Chem., 2015, 87, 1575–1581 CrossRef CAS PubMed.
- Y. Hernandez, Y. Coello, R. M. Fratila, J. M. de la Fuente and T. A. Lionberger, Talanta, 2017, 167, 51–58 CrossRef CAS PubMed.
- Q. Kang, L. Vernisse, R. C. Remsing, A. C. Thenuwara, S. L. Shumlas, I. G. McKendry, M. L. Klein, E. Borguet, M. J. Zdilla and D. R. Strongin, J. Am. Chem. Soc., 2017, 139, 1863–1870 CrossRef CAS PubMed.
- X. N. Jing, Y. Z. Xu, D. M. Liu, Y. S. Wu, N. Zhou, D. Q. Wang, K. Yan and L. J. Meng, Nanoscale, 2019, 11, 15508–15518 RSC.
- W. D. Na, N. Li and X. G. Su, Sens. Actuators, B, 2018, 274, 172–179 CrossRef CAS.
- Y. Li, T. Yan, W. Chang, C. Cao and D. Deng, Biomater. Sci., 2019, 7, 3652–3661 RSC.
- T. T. Yao, A. R. Liu, Y. Liu, M. Wei, W. Wei and S. Q. Liu, Biosens. Bioelectron., 2019, 145, 6 CrossRef PubMed.
- L. Wang, K. Ye, J. Pan, H. Song, X. Li and X. Niu, Anal. Methods, 2019, 11, 5472–5477 RSC.
- L. Jiao, L. H. Zhang, W. W. Du, H. Li, D. Y. Yang and C. Z. Zhu, Nanoscale, 2018, 10, 21893–21897 RSC.
- G. N. Zhang, L. J. Ren, Z. Yan, L. P. Kang, Z. B. Lei, H. Xu, F. Shi and Z. H. Liu, Chem. Commun., 2017, 53, 2950–2953 RSC.
- L. Wang, S. Y. Guan, Y. Z. W. Weng, S. M. Xu, H. Lu, X. M. Meng and S. Y. Zhou, ACS Appl. Mater. Interfaces, 2019, 11, 6267–6275 CrossRef CAS PubMed.
- Y. Omomo, T. Sasaki, L. Z. Wang and M. Watanabe, J. Am. Chem. Soc., 2003, 125, 3568–3575 CrossRef CAS PubMed.
- Y. Shu, J. Xu, J. Y. Chen, Q. Xu, X. Xiao, D. Q. Jin, H. Pang and X. Y. Hu, Sens. Actuators, B, 2017, 252, 72–78 CrossRef CAS.
- Z. C. Li, A. J. Gu, Z. S. Lou, J. H. Sun, Q. F. Zhou and K. Y. Chan, J. Mater. Sci., 2017, 52, 4852–4865 CrossRef CAS.
- W. H. Di, X. Zhang and W. P. Qin, Appl. Surf. Sci., 2017, 400, 200–205 CrossRef CAS.
- Y. X. Li, M. Hong, Q. B. Miaomiao, Z. Y. Lin, Z. W. Cai and G. N. Chen, J. Mater. Chem. B, 2013, 1, 1044–1051 RSC.
- B. A. Lakshmi and S. Kim, Colloids Surf., B, 2019, 178, 230–237 CrossRef CAS PubMed.
- L. Han, S. G. Liu, J. Y. Liang, N. B. Li and H. Q. Luo, Sens. Actuators, B, 2019, 288, 195–201 CrossRef CAS.
- X. H. Ma, C. C. Du, M. X. Shang and W. B. Song, Anal. Bioanal. Chem., 2018, 410, 1417–1426 CrossRef CAS PubMed.
- H. W. Song, K. Ye, Y. X. Peng, L. J. Wang and X. H. Niu, J. Mater. Chem. B, 2019, 7, 5834–5841 RSC.
- D. E. Wang, X. H. Gao, G. B. Li, T. Xue, H. Yang and H. Y. Xu, Sens. Actuators, B, 2019, 289, 85–92 CrossRef CAS.
- C. C. Gao, S. P. Zang, L. X. Nie, Y. Tian, R. B. Zhang, J. Jing and X. L. Zhang, Anal. Chim. Acta, 2019, 1066, 131–135 CrossRef CAS PubMed.
- Y. Li, Z. Z. Huang, Y. H. Weng and H. L. Tan, Chem. Commun., 2019, 55, 11450–11453 RSC.
- W. S. Kong, Q. Q. Tan, H. Y. Guo, H. Sun, X. Qin and F. L. Qu, Microchim. Acta, 2019, 186, 8 CrossRef PubMed.
- J. Y. Tian, Y. T. Yang, M. J. Huang, C. H. Zhou and J. S. Lu, Talanta, 2019, 196, 293–299 CrossRef CAS PubMed.
Footnotes |
| † Electronic supplementary information (ESI) available. See DOI: 10.1039/d0ra05741j |
| ‡ These authors contributed equally to this work. |
| This journal is © The Royal Society of Chemistry 2020 |