 Open Access Article
Structural, dielectric and impedance spectroscopy analysis of Ba5CaTi1.94Zn0.06Nb8O30 ferroelectric ceramic
Amine Bendahhou *a,
Karim Chourtia,
Rachid El Bouayadib,
Soufian El Barkanya and
Mohamed Abou-Salama
 a
a
aDepartment of Chemistry, Laboratory of Molecular Chemistry, Materials and Environment, Faculty Multidisciplinary Nador, University Mohamed Premier, B.P. 300, Selouane, Nador 62700, Morocco. E-mail: bendahhou_amine1718@ump.ac.ma
bISET, ENSA, Ibn Tofayl University of Kénitra, 14000 Kénitra, Morocco
First published on 28th July 2020
Abstract
In this work, Zn co-doped tungsten bronze having nominal formula Ba5CaTi1.94Zn0.06Nb8O30 has been synthesized and systematically studied for structure, dielectric and electrical properties. The formation of the phase of tetragonal tungsten bronze with space group P4bm and the occurrence of oxygen vacancies were verified by the Rietveld refinement using X-ray diffraction data. Scanning electron microscopy (SEM) of Ba5CaTi1.94Zn0.06Nb8O30 ceramic shows high densification, low porosity, and homogeneous distribution of grains of different sizes over the total surface. The sample shows a dielectric anomaly of ferroelectric paraelectric type at 262 °C, and has non-relaxor type of diffuse phase transition. The electrical property (complex impedance Z*, complex permittivity ε*, complex modulus M*) of Ba5CaTi1.94Zn0.06Nb8O30 ceramic has been investigated by non-destructive complex impedance spectroscopy (CIS) as a function of frequency at different temperatures. Grains and grain boundaries conduction is detected from a complex impedance spectrum by fitting the Nyquist plot with an appropriate electrical circuit. The Nyquist plot indicates the negative temperature coefficient of resistance (NTCR) character of Ba5CaTi1.94Zn0.06Nb8O30 ceramic. The variation of AC conductivity as a function of frequency reveals that the compound has an Arrhenius-type behavior of electrical conductivity. The DC electrical conductivities of grains and grain boundaries have been studied. The presence of non-Debye relaxations was verified by a complex modulus analysis.
1. Introduction
In recent years, tetragonal tungsten bronze (TTB) compounds have been extensively studied because they are part of an important family of dielectric materials, which exhibit interesting ferroelectric, pyroelectric and piezoelectric behaviors.1–6 Tungsten–bronze compounds have been considered as candidates to replace lead-based compounds.7,8 The (TTB) structure can be described as a complex chain of distorted BO6 octahedra linked by their summits, leading to three different types of interstices (A1, A2 and C) with 12-, 15- and 9-fold coordination. Thus, their general formula is [(A1)2(A2)4C4][(B1)2(B2)8]O30. In the given formula, the A1 and A2 sites are mostly occupied by divalent or trivalent cations,9,10 the B1 and B2 sites by tetravalent or pentavalent cations,11,12 and the C site receive small cations such as Li+,13 (see the insets of Fig. 1). In our research, the site (C) is small and often remains empty, the general formula becomes [(A1)2(A2)4][(B1)2(B2)8]O30. The wide variety of cationic sites (A1, A2, C, B1 and B2) leads to a great variety of structures, permitting the modification of the characteristics of the (TTB), by substitutions in the A1 and A2 sites or in the B1 and B2 octahedra. For example, the M6−pRpTi2+pNb8−pO30 (p = 1.2; M = Ba or Sr; R = rare earth) tetragonal tungsten bronze system, the difference in ion size between the A1 and A2 sites is an important factor in the transition from relaxant to normal ferroelectric.4,14–16 Ba4R2Ti4Nb6O30 (R = Bi, La) with a smaller ionic size difference exhibits relaxation behavior, whereas Ba4R2Ti4Nb6O30 (R = Nd, Sm) with a larger size difference exhibits normal ferroelectric behavior. In addition, the creation of oxygen vacancy is also an effective method to improve the properties of the oxides, and it has attracted considerable attention to many oxides because of its close relationship to material properties.17–19 Oxygen vacancy is one of the most important modifying factors that cannot be ignored for all oxide materials, they can be created by doping or atmospheric reduction.20–22 However, there are few published studies on the effect of oxygen vacancies on the structure, dielectric, and electrical properties of (TTB) ceramics.23–25 In our case, the Ti4+ ion, which is tetravalent, is substituted by Zn2+ which is bivalent. Thus, this heterogeneous substitution leads to a change in the charge of the “B1, and B2” sites, compensated by the creation of oxygen vacancies (OVs).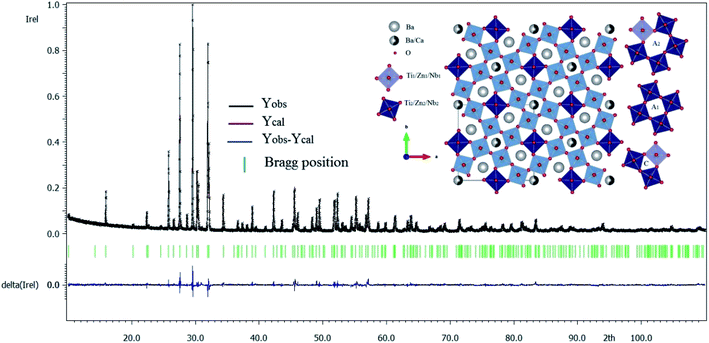 | ||
| Fig. 1 X-ray diffraction refinement for Ba5CaTi1.94Zn0.06Nb8O30 powder, and representation of the TTB structure of Ba5CaTi1.94Zn0.06Nb8O30 along the “c” axis. | ||
Shilpi Jindal et al.,26 studied structural and dielectrical properties of lead-free polycrystalline electro ceramics Ba5CaTi2Nb8O30 (BCTN) for microwave tunable device applications. They found that the ceramic Ba5CaTi2Nb8O30 (BCTN) was single-phase with a tungsten–bronze structure in space group P4bm. The lattice parameters of Ba5CaTi2Nb8O30 are calculated as: a = 8.3311 Å, c = 12.1289 Å, V = 841.8334 Å3, the grain size of the BCTN ceramic was 6 μm and this compound has a dielectric anomaly at 316 °C which corresponds to the Curie temperature Tc.
The complex impedance spectroscopy (CIS) technique has been extensively used to study the physical processes determining the electrical and dielectric properties of materials. It is used to separate the contributions of grains and grain boundaries to the transport properties of materials.27 CIS allows the evaluation of the relaxation frequency/relaxation time of charge carriers in the material, which is a characteristic property of the samples. CIS also allows the study of conductivity as a function of frequency, modulus spectra, relative permittivity and dielectric losses. The variation of impedance parameters as a function of frequency and temperature can be appropriately modelled with equivalent circuits, which will assist the researcher in determining the responsible physical processes.28–33
The present work is focused on the titanium–zinc substitution for compound of global composition Ba5CaTi1.94Zn0.06Nb8O30 synthesized by standard solid-state reaction. The effect of the substitution of Ti by Zn on their structure, dielectric and electrical properties are studied in detail in this new tungsten bronze composition.
2. Materials and methods
Ba5CaTi1.94Zn0.06Nb8O30 powder was synthesized by a classical solid-state route. The raw materials used are BaCO3 (Sigma-Aldrich 99%), CaCO3 (Aldrich 99.9%), Nb2O5 (Aldrich 99.9%), ZnO, (Himedia 99.9%) and TiO2 (Sigma-Aldrich 99%). The raw powders were weighed in stoichiometric amounts and mixed in an agate mortar for 30 minutes. This powder was calcined in air at 1300 °C for 6 hours. The obtained powder was ground and mixed with polyvinyl alcohol (PVA) as a binder. Then, cylindrical pellet was obtained by pressing at 20 kN (12 mm diameter, 2 mm thickness). The green pellet was sintered at 1450 °C for 6 hours in air.The identification of the crystalline structure of the Ba5CaTi1.94Zn0.06Nb8O30 powder was performed by X-ray diffraction (XRD) using a θ/2θ diffractometer fitted with a fast detector (Bruker D8, CuKα1, Linkeye detector) at room temperature (293 K, 0.015° step, 10–120° 2θ range, scanning speed of 1° min−1). The lattice parameters, atomic positions, occupation rate, and thermal agitation factor were refined by the Rietveld method using the Jana 2006 software.34
The sintered pellet was polished with a fine emery paper to make both surfaces flat and parallel and then annealed at 1300 °C for 30 min. The microstructure of Ba5CaTi1.94Zn0.06Nb8O30 ceramic was checked by scanning electron microscopy (SEM) (TESCAN VEGA III LM), with an accelerating voltage of 10 kV. The average grain size of ceramic sample was estimated using Image J software. Before electrical measurements, the sintered ceramic was painted with silver paste and annealed for 30 minutes at 300 °C to adhere to the silver on the sample and then cooled to room temperature before taking any measurement. The disc shaped silver coated pellet behaves like a parallel plate capacitor which is used for various dielectric and electrical measurements. The relative permittivity, dielectric losses (tan![[thin space (1/6-em)]](https://www.rsc.org/images/entities/char_2009.gif) δ), the real and imaginary part of impedance and phase angle were determined using a BioLogic impedance analyzer (MTZ-35) over the frequency range of 10 Hz to 1 MHz with an AC voltage amplitude of 1 V, the furnace and the sample temperatures were controlled by MT-lab software using a heat-up rate of 5 °C min−1.
δ), the real and imaginary part of impedance and phase angle were determined using a BioLogic impedance analyzer (MTZ-35) over the frequency range of 10 Hz to 1 MHz with an AC voltage amplitude of 1 V, the furnace and the sample temperatures were controlled by MT-lab software using a heat-up rate of 5 °C min−1.
3. Results and discussion
3.1. Structural study
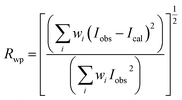
Fig. 1 gives the result of the Rietveld refinement of the XRD data for Ba5CaTi1.94Zn0.06Nb8O30 powder. Refinement results indicate that the Ba5CaTi1.94Zn0.06Nb8O30 ceramic was single-phase with a tungsten–bronze structure in space group P4bm.The Fig. 1 shows a comparison of the observed data (black line) and calculated data (red line) from the X-ray patterns and the smallest difference between them (solid blue line) for Ba5CaTi1.94Zn0.06Nb8O30. This difference between the calculated and measured data is the best method to confirm the quality and success of the refinement. According to the literature, the quality and validity of the various data from structural refinement have generally been verified by the reliability index parameters (R-values), i.e. Rp (R-profile), Rwp (R-weighted profile), Rexp (expected residual factor), and GOF (goodness of fit). The selected R-values are described as follows equations,
 | (1) |
 | (2) |
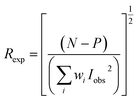 | (3) |
 | (4) |
Good agreement between the calculated and observed model was obtained with Rp = 6.52%, Rwp = 8.67%, and GOF = 1.74. Table 1 gives the structural data for Ba5CaTi1.94Zn0.06Nb8O30 powder, and experimental conditions. The refined structural parameters (atomic positions, occupation rate, and thermal agitation factor) are shown in Table 2. The selected bond distances and angles are summarized in Table 3. The insets of Fig. 1 represent the crystallographic structure along the c-axis for the composition Ba5CaTi1.94Zn0.06Nb8O30. Ti4+, Zn2+, and Nb5+ occupy the B1 and B2 sites in a ratio of 1.94![[thin space (1/6-em)]](https://www.rsc.org/images/entities/char_2009.gif) :
:![[thin space (1/6-em)]](https://www.rsc.org/images/entities/char_2009.gif) 0.06
0.06![[thin space (1/6-em)]](https://www.rsc.org/images/entities/char_2009.gif) :
:![[thin space (1/6-em)]](https://www.rsc.org/images/entities/char_2009.gif) 8. Ba2+ sit in the A2 site (the pentagonal site), the residue of the Ba2+ with the Ca2+ occupy the A1 site (the square site) simultaneously with a ratio of 1
8. Ba2+ sit in the A2 site (the pentagonal site), the residue of the Ba2+ with the Ca2+ occupy the A1 site (the square site) simultaneously with a ratio of 1![[thin space (1/6-em)]](https://www.rsc.org/images/entities/char_2009.gif) :
:![[thin space (1/6-em)]](https://www.rsc.org/images/entities/char_2009.gif) 1.
1.
| Crystallographic data | |
|---|---|
| Formula | Ba5CaTi1.94Zn0.06Nb8O30 |
| Crystal system | Tetragonal |
| Space group | P4bm |
| a (Å) | 12.4631(6) |
| c (Å) | 3.9812(2) |
| V (Å3) | 618.40(5) |
| Z | 1 |
| Density (g cm−3) | 5.2681 |
| Data collection | |
| Temperature (°C) | 25 |
| Wavelength [CuKα] (Å) | 1.5406 |
| Measuring range (°) | 10 ≤ 2θ ≤ 120 |
| Step (2θ) | 0.015 |
| Rietveld data | |
| Program | Jana 2006 |
| Profile function | Pseudo Voigt |
| Number of refined parameters | 48 |
| Caglioti parameters | U = 0.113; V = 0.409; W = 0.015 |
| Rp (%) | 6.52 |
| Rwp (%) | 8.67 |
| Rexp (%) | 4.99 |
| GOF | 1.74 |
| Atom | Wyckoff position | x | y | z | Biso (Å2) | Occupies |
|---|---|---|---|---|---|---|
| Ca1/Ba1 | 2a | 0 | 0 | 0 | 1.74(12) | 0.56(4)/0.44(4) |
| Ba2 | 4c | 0.17114(9) | 0.67114(9) | 0 | 2.78(8) | 0.97(4) |
| Ti1/Zn1/Nb1 | 2b | 0 | 0.50 | 0.501(3) | 1.56(15) | 0.37(6)/0.006/0.62(6) |
| Ti2/Zn2/Nb2 | 8d | 0.07393(12) | 0.21358(11) | 0.495(3) | 1.50(9) | 0.28(7)/0.006/0.72(7) |
| O1 | 2b | 0 | 0.50 | 0.048(13) | 2.50(31) | 0.9768 |
| O2 | 4c | 0.2856(6) | 0.7856(6) | 0.551(8) | 2.50(31) | 1.05(4) |
| O3 | 8d | 0.0746(7) | 0.2066(6) | 0.024(10) | 2.50(31) | 0.94(3) |
| O4 | 8d | 0.3443(8) | 0.0061(6) | 0.549(5) | 2.50(31) | 1.02(4) |
| O5 | 8d | 0.1387(7) | 0.0701(7) | 0.564(5) | 2.50(31) | 0.95(3) |
| Bond distances (Å) | Bond angles (°) | ||
|---|---|---|---|
| Ca(1)/Ba(1)–O(3) | 2.740(8) × 4 | O(1)–Ti(1)/Zn(1)/Nb(1)–O(1) | 180.0(5) |
| Ca(1)/Ba(1)–O(5) | 2.600(16) × 4 | O(1)–Ti(1)/Zn(1)/Nb(1)–O(4) | 84.3(7) × 4 |
| 2.966(17) × 4 | 95.7(7) × 4 | ||
| Ba(2)–O(2) | 2.69(2) × 1 | O(4)–Ti(1)/Zn(1)/Nb(1)–O(4) | 85.0(3) × 2 |
| 2.98(2) × 1 | 93.9(3) × 2 | ||
| Ba(2)–O(4) | 2.737(15) × 2 | 168.6(11) × 2 | |
| 3.007(16) × 2 | O(2)–Ti(2)/Zn(2)/Nb(2)–O(3) | 84.4(10) | |
| 97.5(10) | |||
| Ti(1)/Zn(1)/Nb(1)–O(1) | 1.80(5) × 1 | O(2)–Ti(2)/Zn(2)/Nb(2)–O(4) | 93.6(4) |
| 2.18(5) × 1 | O(2)–Ti(2)/Zn(2)/Nb(2)–O(5) | 91.9(4) | |
| Ti(1)/Zn(1)/Nb(1)–O(4) | 1.952(11) × 4 | 165.7(12) | |
| O(3)–Ti(2)/Zn(2)/Nb(2)–O(3) | 175.0(3) | ||
| Ti(2)/Zn(2)/Nb(2)–O(2) | 1.980(9) × 1 | O(3)–Ti(2)/Zn(2)/Nb(2)–O(4) | 85.7(7) |
| Ti(2)/Zn(2)/Nb(2)–O(3) | 1.88(4) × 1 | 98.8(8) | |
| 2.11(4) × 1 | O(3)–Ti(2)/Zn(2)/Nb(2)–O(5) | 79.8(7) | |
| 1.922(10) × 1 | 81.4(7) | ||
| Ti(2)/Zn(2)/Nb(2)–O(4) | 1.982(10) × 1 | 95.5(7) | |
| Ti(2)/Zn(2)/Nb(2)–O(5) | 2.041(10) × 1 | 96.8(7) | |
| O(4)–Ti(2)/Zn(2)/Nb(2)–O(5) | 85.2(4) | ||
| 163.9(10) | |||
| O(5)–Ti(2)/Zn(2)/Nb(2)–O(5) | 85.8(4) | ||
The final chemical formula after the structural refinement step was Ba4.745Ca1.129Ti2.953Zn0.06Nb6.987O29.409 evidencing oxygen vacancies, this is attributed to the increase in the number of positive charges lost during the substitution of titanium by zinc and due to high sintering temperature (1450 °C).
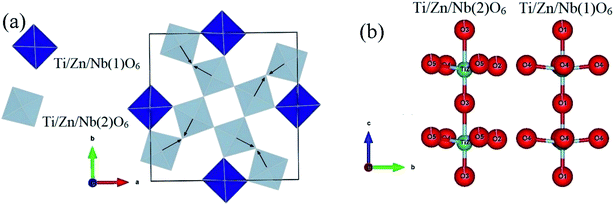
The cations Ti, Zn, and Nb show clearly off-centre displacements along the c-axis in both Ti/Zn/Nb(1)O6 and Ti/Zn/Nb(2)O6 octahedra (Fig. 2(b)). The Ti/Zn/Nb(1)O6 octahedra have four equal Ti/Zn/Nb(1)–O(4) bond length (see Table 3). In addition, the unequal Ti/Zn/Nb(2)–O bonds length of Ti/Zn/Nb(2)O6 indicates the displacement of the cations Ti/Zn/Nb(2) in the ab plane, and no displacement of the cations Ti/Zn/Nb(1) occurs in the ab plane indicating more distortion in Ti/Zn/Nb(2)O6 than in Ti/Zn/Nb(1)O6 the octahedron. The arrows in Fig. 2(a) indicate the tilting direction for Ti/Zn/Nb(2)O6 octahedron.
3.2. Microstructure of ceramic samples
Fig. 3(a) shows the SEM picture of the surface of Ba5CaTi1.94Zn0.06Nb8O30 pellet sintered at 1450 °C for 6 hours, from which we can deduce that the compound has a dense microstructure and that the unequal grain sizes are homogeneously distributed over the entire surface of the sample. The relative density is 96% of the theoretical density. The histogram of Fig. 3(b) show that the average grain size for Ba5CaTi1.94Zn0.06Nb8O30ceramic is 1.39 μm.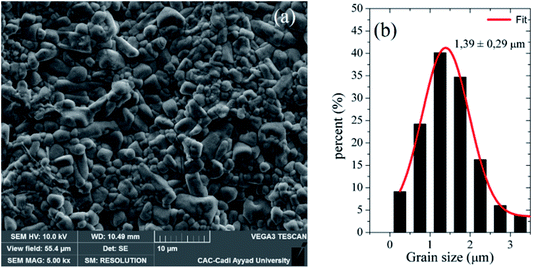 | ||
| Fig. 3 (a) SEM picture of the surface of Ba5CaTi1.94Zn0.06Nb8O30 ceramic, and (b) associated grain size distributions. | ||
3.3. Study of dielectric properties
Complex impedance spectroscopy is a non-destructive technique allowing the determination of the relationships between dielectric properties, structure and microstructure. In this technique, during the measurement, four variables were stored as a function of frequencies which is the real and imaginary part of the impedance, the phase angle, and the dielectric loss.The complex permittivity ε* can be expressed in terms of real value (ε′) and imaginary part (ε′′).
 | (5) |
The relative permittivity (dielectric constant εr) and the dielectric losses (tan![[thin space (1/6-em)]](https://www.rsc.org/images/entities/char_2009.gif) δ) were determined from complex impedance Z* (Z* = Z′ + jZ′′) data using the following expressions37
δ) were determined from complex impedance Z* (Z* = Z′ + jZ′′) data using the following expressions37
 | (6) |
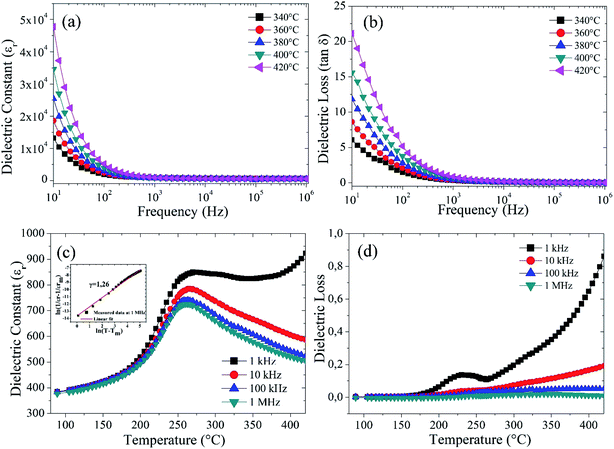
Fig. 4(a) exhibits the variation of the dielectric constant (εr) of Ba5CaTi1.94Zn0.06Nb8O30 ceramic measured at 10 Hz to 1 MHz. It can be seen that the dielectric constant decreases gradually as the frequency increases from 10 Hz to 100 Hz and it is almost constant at frequencies higher than 100 Hz. Everyone knows that as the frequency increases, the dielectric constant steadily decreases, which is a common characteristic of dielectric materials. The high permittivity in the low-frequency region is due to the different types of polarization present in these materials, such as dipole, atomic, ionic, electronic, etc.9,38,39 For high frequencies, the relative permittivity decreases and reaches a plateau, this behavior indicates the occurrence of charged species (grain boundaries effect, oxygen vacancies…) which are incapable to follow the variation of the applied alternating electric field for high frequencies.
Fig. 4(b) shows the variation of the dielectric loss (tan![[thin space (1/6-em)]](https://www.rsc.org/images/entities/char_2009.gif) δ) with frequency at different temperatures, it exhibits the same behavior as that of the dielectric constant (εr), i.e. decreasing with increasing frequency. This decline in dielectric losses (tan
δ) with frequency at different temperatures, it exhibits the same behavior as that of the dielectric constant (εr), i.e. decreasing with increasing frequency. This decline in dielectric losses (tan![[thin space (1/6-em)]](https://www.rsc.org/images/entities/char_2009.gif) δ) with increasing frequency is attributed to the phenomenon of dipole relaxation.40 The space charges are not capable to keep up with the high frequency of the applied electric field and go through relaxation. However, the origin of this behavior must be identified by complex impedance spectroscopy, in terms of analysis of the real and imaginary part of the complex impedance, analysis of the AC conductivity and study of the dielectric modulus.
δ) with increasing frequency is attributed to the phenomenon of dipole relaxation.40 The space charges are not capable to keep up with the high frequency of the applied electric field and go through relaxation. However, the origin of this behavior must be identified by complex impedance spectroscopy, in terms of analysis of the real and imaginary part of the complex impedance, analysis of the AC conductivity and study of the dielectric modulus.
From Fig. 4(c), It is found that the compound Ba5CaTi1.94Zn0.06Nb8O30 has a dielectric anomaly at 262 °C (the Curie temperature Tc), suggesting the appearance of a ferroelectric to paraelectric phase transition. It is also observed that the compound has the same Tc for all frequencies (1 kHz to 1 MHz), indicating that Ba5CaTi1.94Zn0.06Nb8O30 is a classical ferroelectric.28 The dielectric peak is found to be broadened, indicating the existence of a diffuse phase transition.
The diffuse phase transition behavior of the dielectric constant can be evaluated using the modified Curie–Weiss equation41,42
ln(1/εr − 1/εrmax) = γ![[thin space (1/6-em)]](https://www.rsc.org/images/entities/char_2009.gif) ln(T − Tmax) + C1 ln(T − Tmax) + C1
| (7) |
Fig. 4(d) shows the variation in dielectric loss (tan![[thin space (1/6-em)]](https://www.rsc.org/images/entities/char_2009.gif) δ) for Ba5CaTi1.94Zn0.06Nb8O30 ceramic at different frequencies. It shows a large peak in a temperature range from 190 °C to 280 °C. Such a wide maximum in (tan
δ) for Ba5CaTi1.94Zn0.06Nb8O30 ceramic at different frequencies. It shows a large peak in a temperature range from 190 °C to 280 °C. Such a wide maximum in (tan![[thin space (1/6-em)]](https://www.rsc.org/images/entities/char_2009.gif) δ) results from the ferroelectric-to-paraelectric phase transition. The dielectric loss peak of Ba5CaTi1.94Zn0.06Nb8O30 ceramic, which appears at a temperature below the dielectric constant, also exhibits a strong frequency dispersion.
δ) results from the ferroelectric-to-paraelectric phase transition. The dielectric loss peak of Ba5CaTi1.94Zn0.06Nb8O30 ceramic, which appears at a temperature below the dielectric constant, also exhibits a strong frequency dispersion.
3.4. Complex impedance analysis (CIA)
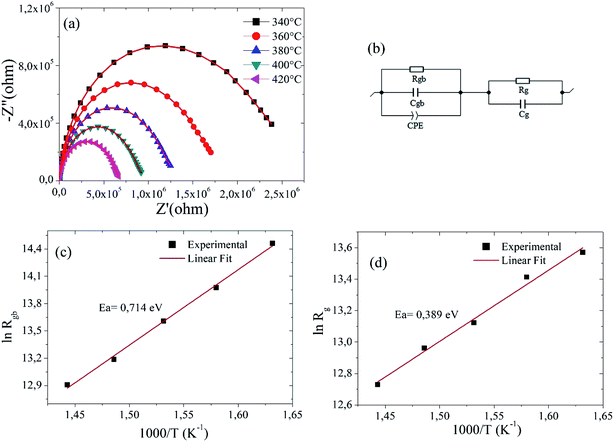
CIA using Nyquist plots allows the understanding of the effects of grains, grain boundaries and possible electrode effects on the capacitive, reactive, resistive and inductive properties of materials. Fig. 5(a) shows Nyquist plot for Ba5CaTi1.94Zn0.06Nb8O30 ceramic at different temperatures, it shows that with increasing temperature, the Nyquist plot of Ba5CaTi1.94Zn0.06Nb8O30 has a smaller semicircle, suggesting that the compound resistance has progressively decreased. This resistance value has a strong effect on the amplitude of the real and imaginary part of the impedance.44The equivalent circuit use to describe the electrical properties of the material is composed of two branches in series, which represent the electrical properties of the grains and the grain boundaries. In addition, the Z-View software can be utilized to adjust the parameters of each element in the equivalent circuit presenting in Fig. 5(b).
We used a series combination of two parallel circuits to characterize respectively the effect of grains and grain boundaries. In the first parallel circuit corresponding to the grain contribution, Rg and Cg correspond to the grain resistance and the grain capacitance. In the second parallel circuit, Rgb, Cgb and CPE were used as grain boundary resistance, grain boundary capacitance and constant phase element. A constant phase element CPE is introduced into the second circuit corresponding to the grain boundary properties due to the non-ideal capacitive behavior. This non-ideal grain boundary behavior can be due to the presence of more than one relaxation process.45,46 The constant phase element (Q) is evaluated by the following relationship20,47
| C = (R1−αQ)1/α | (8) |
For an ideal resistor and an ideal capacitor, the value of (α) is zero and one, respectively.48 A good agreement between the experimental data points and the theoretical line gives us confidence in the proposed equivalent circuit (see Fig. 5a). The various adjusted parameters are presented in Table 4.
| T (°C) | Rgb (MΩ) | Cgb (nF) | Q (nF sα−1) | α | Rg (Ω) | Cg (nF) |
|---|---|---|---|---|---|---|
| 340 | 1.9086 | 0.4152 | 9.642 | 0.60959 | 782.87 | 0.9371 |
| 360 | 1.1724 | 0.4087 | 12.548 | 0.59569 | 669.05 | 0.8366 |
| 380 | 0.8127 | 0.3782 | 12.872 | 0.58587 | 500.41 | 0.8527 |
| 400 | 0.5329 | 0.3865 | 21.517 | 0.54298 | 425.69 | 0.7434 |
| 420 | 0.4061 | 0.4083 | 24.45 | 0.5238 | 335.37 | 0.6625 |
The values of Rg and Rgb decrease with the increasing temperatures for Ba5CaTi1.94Zn0.06Nb8O30 ceramic (see Table 4), showing the occurrence of a thermally activated conduction mechanisms in the grains and at the grain boundaries.
The relationship between resistance and temperature can be described by the Arrhenius equation
R = R0![[thin space (1/6-em)]](https://www.rsc.org/images/entities/char_2009.gif) exp(−Ea/KBT) exp(−Ea/KBT)
| (9) |
3.5. Electrical conductivity study
Conductivity values are calculated from the dielectric data using the relationship
σAC = ωε0εr![[thin space (1/6-em)]](https://www.rsc.org/images/entities/char_2009.gif) tan tan![[thin space (1/6-em)]](https://www.rsc.org/images/entities/char_2009.gif) δ δ
| (10) |
![[thin space (1/6-em)]](https://www.rsc.org/images/entities/char_2009.gif) δ, ω, and σAC are respectively vacuum permittivity, relative permittivity, dielectric loss, angular frequency and AC conductivity.
δ, ω, and σAC are respectively vacuum permittivity, relative permittivity, dielectric loss, angular frequency and AC conductivity.
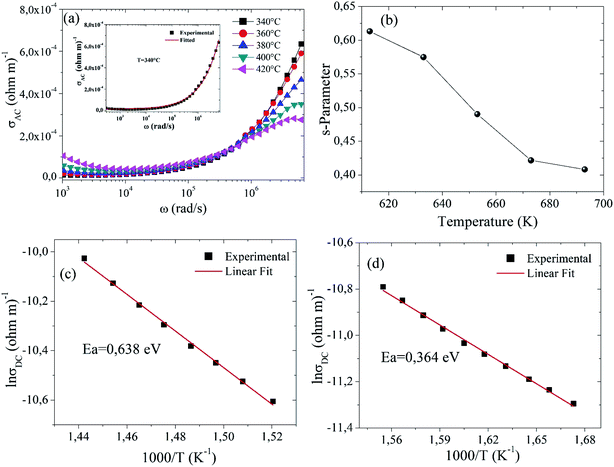
In Fig. 6(a), the AC conductivity increases with increasing frequency for all temperatures. The AC conductivity at each measured temperature has two distinct regions. At low frequencies, a first region has been observed where the conductivity does not change with frequency. For the second region, the conductivity increases with increasing frequency. This type of AC conductivity can be explained by Jonscher's power law.49
| σAC = σDC + Aωs | (11) |
| Temperature (°C) | σDC (Ω m)−1 | A (Ω−1 m−1 rad−s) | s |
|---|---|---|---|
| 340 | 1.89487 × 10⁻⁶ | 1.3849 × 10⁻⁷ | 0.6131 |
| 360 | 2.97653 × 10⁻⁶ | 2.20445 × 10⁻⁷ | 0.5748 |
| 380 | 1.36587 × 10⁻⁶ | 5.74542 × 10⁻⁷ | 0.4901 |
| 400 | 3.06541 × 10⁻⁶ | 1.19158 × 10⁻⁶ | 0.4215 |
| 420 | 1.73255 × 10⁻⁶ | 1.20669 × 10⁻⁶ | 0.4081 |
From Table 5, it can be seen that with the rise in temperature, the strength of polarizability “A” increases, as confirmed by dielectric constant values of Fig. 4(a).
Fig. 6(b) gives the variation of the “s” parameter as a function of temperature (340–420 °C), demonstrating that “s” is varying inversely with temperature. This observation confirms that correlated barrier hopping (CBH) is the appropriate model to understand charge transport mechanism in this sample.51 According to this model, AC conductivity in the sample Ba5CaTi1.94Zn0.06Nb8O30 is due to the hopping of charge carriers between two sites over the potential barrier separating them, because of thermal activation.52
Fig. 6(c and d) shows the variation of ln(σDC) with the inverse of the temperature (103/T), which gives the value of the activation energy for the electrical conduction of Ba5CaTi1.94Zn0.06Nb8O30 ceramic at 1 kHz, which is calculated by Arrhenius law.
σDC = σ0![[thin space (1/6-em)]](https://www.rsc.org/images/entities/char_2009.gif) exp(−Ea/KBT) exp(−Ea/KBT)
| (12) |
In ferroelectric oxides, the thermal activation energy is strongly dependent on the concentration of oxygen vacancies (OVs).10 A stoichiometric perovskite ABO3 has an activation energy Ea = 2 eV, while the value of Ea is 1 eV for ABO2.95 and 0.5 eV for ABO2.90.53,54
The values of the activation energy Ea of the grain and the grain boundary are respectively 0.364 and 0.638 eV, suggesting that oxygen vacancies are responsible for the conduction mechanism in Ba5CaTi1.94Zn0.06Nb8O30 ceramic. Furthermore, it is known that, the most mobile ionic species in ferroelectric oxides (perovskite, tungsten bronze lattice…) are the single and double ionized oxygen vacancies. It was often mentioned that the activation energy of single ionized OVs was about (0.3–0.5 eV) and about (0.6–1.2 eV) for double ionized OVs.10
Oxygen vacancies (OVs) can easily be formed in oxide materials by the loss of oxygen from the crystal lattice during heating at elevated temperatures (typically >1300 °C),55 or in our case by the Ti4+/Zn2+ substitution.
The oxygen vacancies creation can be explained by the Kröger–Vink defect equation
 | (13) |
The single and double ionized oxygen vacancies will create the conducting electrons, written as
 | (14a) |
 | (14b) |
The formation of oxygen vacancies (OVs) can be created by three different charge states: the neutral state (VO), which is capable to imprison two electrons and is neutral in the lattice, the single ionized state  and the double ionized state
  , which does not imprison any electrons, can be thermally activated, thus improving the conduction process.56
In addition, our Ea results for grains 0.364 eV are very close to the activation energy of the ion conductivity induced by single ionized OVs, while the Ea values for grain boundaries 0.638 eV are very close to the activation energy of ionic conductivity induced by doubly ionized OVs in perovskite and tungsten bronze type ferroelectric oxides reported by many authors.10,20,32,36,57,58 Therefore, we can reasonably conclude that the conducting species in Ba5CaTi1.94Zn0.06Nb8O30 ceramic are single and doubly ionized oxygen vacancies.
3.6. The spectrum of the imaginary and the real part of the impedance
Fig. 7(a) showed the variation of the imaginary part of the impedance Z′′ as a function of the frequency at different temperatures for Ba5CaTi1.94Zn0.06Nb8O30 ceramic. The amplitude of Z′′ at the peak position is called and the corresponding frequency fmax is known as the relaxation frequency. The plots indicate that the Z′′ values achieve a maximum peak
  and that the value of
  moves to higher frequencies with increasing temperature. The relaxation frequency fmax was small at low temperatures; this implies that mobile charge carriers (OVs) take a long time to move from one site to another.31
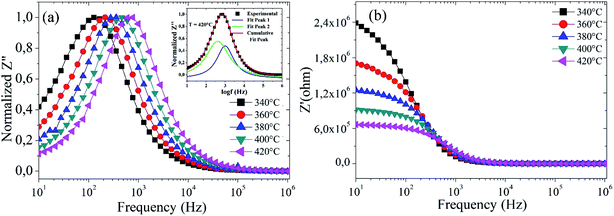 | ||
| Fig. 7 Variation of (a) the imaginary part (Z′′), and (b) the real part (Z′) of impedance with frequency at different temperatures for Ba5CaTi1.94Zn0.06Nb8O30 ceramic. | ||
To confirm the possible contribution of grain and grain boundary, the  peak of the imaginary part of impedance was decomposed by Gaussian–Lorentzian curve fit at 420 °C (the insets of Fig. 7a). It is an effective strategy for identifying the dielectric responses from grain, grain boundary and electrode effect although with very small differences.35,59 The
  peak is the result of two overlapping peaks. The peak in blue represents the grain contribution, while the peak in green represents the grain boundary contribution. This result has been confirmed by fitting the Nyquist plots with a circuit corresponding to the contribution of grain and grain boundary (see Fig. 5b).
Fig. 7(b) presents the evolution of the real part of the impedance Z′ with frequency at different temperatures. It can be seen that the amplitude of Z′ decreases with increasing frequency and temperature, indicating an increase in AC conductivity with increasing temperature and frequency.60 At low frequencies, the real part of the impedance Z′ has a high value due to the different types of polarisation present in these materials, such as dipolar, atomic, ionic, electronic, etc. But at the higher frequency, the dipolar orientation and the interfacial polarization have decreased, resulting in a constant value of the real part of the impedance Z′.61 The decrease in the value of Z′ with increasing temperature indicated the negative temperature coefficient of resistance (NTCR) behavior.56,62
3.7. Module spectroscopy study
The complex analysis of the dielectric modulus is a practical tool for studying electrical transport phenomena in ceramics and for distinguishing the microscopic processes responsible for dielectric relaxation.63 The complex dielectric modulus, M*, is given by the inverse of the complex dielectric constant| M* = 1/ε* = jωC0Z* = M′ + jM′′ | (15) |
 is the geometric capacitance (where ε0 = vacuum permittivity, A = surface, d = thickness).
The real and imaginary parts of the complex module are expressed as follows
 | (16) |
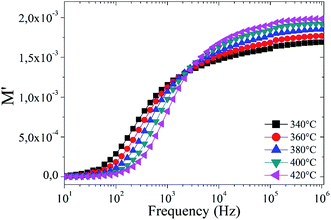
Fig. 8 illustrates the variation of the real part of the module M′ as a function of frequencies at different temperatures. It can be observed that in the low frequency region, M′ is near to zero, but as the frequency increases, M′ continuously increases and closes to saturation after a particular frequency. The saturation in M′ is attributed to the conduction mechanism due to the motion of the available charge carriers (OVs).64,65 However, the increase in temperature enhances the mobility of the charge carriers, so that the overall saturation of M′ increases with temperature.
The variation of the imaginary part of the module as a function of frequency is shown in Fig. 9(a). Three types of regions were observed. The first one is the low frequency region below the maximum of the peak of the modulus  , where charge carriers can move at long distances, i.e. they can hop from one site to the neighbouring site (long-distance hopping).66 The second region is the high-frequency region above the peak maximum of the M′′ modulus
  , where most of the charge carriers have imprisoned in their potential wells, they move over a short distance and can only make a localized movement inside the well.67 The last region was at the top of the peak of module
  , where the transition from long-distance to short-distance mobility happens.
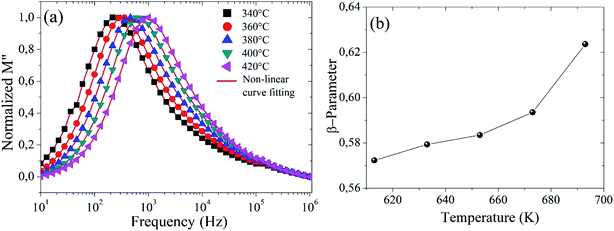 | ||
| Fig. 9 (a) Imaginary part of the module as a function of frequency, and (b) the plot of β-parameter versus temperature for Ba5CaTi1.94Zn0.06Nb8O30 ceramic. | ||
An asymmetric broadening of the peaks is also observed in the relaxation peaks  , which indicates the existence of a stretched exponent parameter (β) to identify the type of relaxation process in Ba5CaTi1.94Zn0.06Nb8O30 ceramic. i.e. Debye or non-Debye type relaxation. To verify this, the stretch coefficient (β) is estimated by fitting the imaginary part of M′′ derived from the modified Kohlrausch–Williams–Watts (KWW) function proposed by Bergma68
 | (17) |
 is the maximum value of M′′, and fmax is the corresponding maximum frequency. For an ideal Debye type relaxation, β = 1 and for non-Debye type relaxation, (β) lies between 0 and 1 (0 < β < 1). The results presented in the Fig. 9(b) suggest that the value of (β) increases with increasing temperature, i.e., from β = 0.5723 to 0.6236, which confirms that the relaxation process is non-Debye type in Ba5CaTi1.94Zn0.06Nb8O30 ceramic.
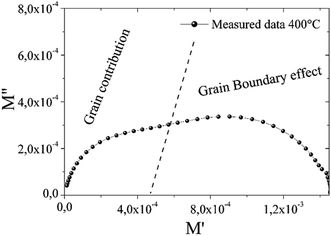
The complex modulus spectrum of M′′ vs. M′ at 400 °C for the compound Ba5CaTi1.94Zn0.06Nb8O30 gives half circles as shown in Fig. 10. The figure clearly shows two semicircles. The first semicircle at a lower frequency is due to the effect of grains, while the second semicircle at a higher frequency is due to grain boundary effect.20 This behavior was not visualized by the Nyquist plot (Fig. 5a).
4. Conclusion
Ba5CaTi1.94Zn0.06Nb8O30 ceramic was obtained via the conventional solid-phase reaction. Analysis of the XRD data by the Rietveld refinement showed a quadratic bronze structure with the space group P4bm and confirmed the formation of oxygen vacancies. The off-centre displacement of the Ti/Nb/Zn cations along the c-axis presented in both octahedrons Ti/Zn/Nb(1)O6 and Ti/Zn/Nb(2)O6. A more important distortion has appeared in the Ti/Zn/Nb(2)O6 than in the Ti/Zn/Nb(1)O6 octahedron. The SEM images showed a homogeneous microstructure composed of unequal sized grains, high densification, and low porosity. The average grain size was 1.39 μm. The dielectric constant decreases with increasing frequency, and dielectric losses increase with increasing temperature in the low frequency region because of the orientation of the dipole along the field which is facilitated by increasing temperature. The compound exhibited a diffuse type of ferroelectric–paraelectric phase transition having non-relaxor behavior with a Tc of 262 °C. Electrical parameters such as the real and imaginary part of impedance, AC/DC conductivity, the real and imaginary part of modulus as a function of frequency and temperature were studied by impedance spectroscopy. The experimental data of the Nyquist plot has been successfully explained with the help of theoretical simulation, and it was found that grains and grain boundaries both contributed in the conduction process in Ba5CaTi1.94Zn0.06Nb8O30 ceramic. It also reveals that the resistance of the grains and grain boundaries decreases with increasing temperature, indicating the negative temperature coefficient of resistance (NTCR) behavior. The values of parameter “s” obtained from fitting the Jonscher's power law, suggested Correlated Barrier Hopping (CBH) mechanism for charge carriers. Two different activation energy regions were determined by fitting the Arrhenius formula at high temperature, which are 0.364 eV for the grains and 0.638 eV for the grain boundaries, suggesting that single and double ionized oxygen vacancies (OVs) are responsible for electrical conduction in Ba5CaTi1.94Zn0.06Nb8O30 ceramic. The asymmetric nature of imaginary part of modulus indicated non-Debye type relaxation.Finally, these preliminary results suggest that the addition of 3% zinc in the Ba5CaTi2Nb8O30 ceramic reduces the volume of the lattice, the size of the grains and also leads to a decrease of the Curie temperature from 316 °C to 262 °C, and suggest that Zn-doped Ba5CaTi2Nb8O30 ceramic are very attractive for basic science and technological applications.
The analysis of ferroelectric and piezoelectric properties is the subject of our next article, in addition we will study the influence of the concentration of zinc and other dopants on the structural, electrical and ferroelectric properties of Ba5CaTi2Nb8O30 ceramic.
Conflicts of interest
There are no conflicts to declare.Acknowledgements
We are very grateful to “Centre Européen de la Céramique Limoges” for their help and support in the process of samples testing in this work. We thank greatly the anonymous reviewers for their careful review and valuable suggestions on the manuscript. Department of Chemistry – Multidisciplinary Faculty (FPN), is acknowledged for practical assistance with the recording of the spectral analysis.References
- S. T. Zhang, G. Yuan, J. Chen, Z. B. Gu, B. Yang, J. Yin and W. Cao, J. Am. Ceram. Soc., 2013, 96, 555–560 CAS.
- X. L. Zhu, K. Li and X. M. Chen, J. Am. Ceram. Soc., 2014, 97, 329–338 CrossRef CAS.
- D. C. Arnold and F. D. Morrison, J. Mater. Chem., 2009, 19, 6485–6488 RSC.
- C. Huang, K. Li, X. Liu, X. Zhu and X. Chen, J. Am. Ceram. Soc., 2014, 97, 507–512 CrossRef CAS.
- E. Castel, P. Veber, M. Albino, M. Velázquez, S. Péchev, D. Denux, J.-P. Chaminade, M. Maglione and M. Josse, J. Cryst. Growth, 2012, 340, 156–165 CrossRef CAS.
- Y. Yao and C. Mak, J. Alloys Compd., 2012, 544, 87–93 CrossRef CAS.
- M. Prades, H. Beltrán, N. Masó, E. Cordoncillo and A. R. West, J. Appl. Phys., 2008, 104, 104118 CrossRef.
- I. Levin, M. C. Stennett, G. C. Miles, D. I. Woodward, A. R. West and I. M. Reaney, Appl. Phys. Lett., 2006, 89, 122908 CrossRef.
- Z. Guo, S. Wu, C. Hu, L. Liu and L. Fang, J. Alloys Compd., 2019, 773, 470–481 CrossRef CAS.
- S. Wu, C. Sun, X. Yang, C. Hu, L. Liu and L. Fang, Ceram. Int., 2020, 46, 9240–9248 CrossRef CAS.
- Q. Chen, F. Gao, J. Xu, S. Cao, Y. Guo and G. Cheng, Ceram. Int., 2019, 45, 9967–9976 CrossRef CAS.
- Y. Shi, F. Yang, C. Zhao, Y. Huang, M. Li, Q. Zhou, Q. Li, Z. Li, J. Liu and T. Wei, J. Phys. Chem. Solids, 2019, 124, 130–136 CrossRef CAS.
- K. Chandramouli, P. Viswarupachary and K. Ramam, J. Mater. Sci.: Mater. Electron., 2009, 20, 977–983 CrossRef CAS.
- X. L. Zhu, X. Q. Liu and X. M. Chen, J. Am. Ceram. Soc., 2011, 94, 1829–1836 CrossRef CAS.
- K. Li, X. L. Zhu, X. Q. Liu and X. M. Chen, Appl. Phys. Lett., 2012, 101, 042906 CrossRef.
- Z. Xiao-Li and C. Xiang-Ming, Chin. Phys. Lett., 2014, 31, 015201 CrossRef.
- T. Rojac, M. Kosec, B. Budic, N. Setter and D. Damjanovic, J. Appl. Phys., 2010, 108, 074107 CrossRef.
- H. Ma, K. Lin, L. Liu, B. Yang, Y. Rong, J. Chen, J. Deng, S. Kawaguchi, K. Kato and X. Xing, RSC Adv., 2015, 5, 76957–76962 RSC.
- R. Maier, J. Cohn, J. Neumeier and L. A. Bendersky, Appl. Phys. Lett., 2001, 78, 2536–2538 CrossRef CAS.
- S. Rani, N. Ahlawat, R. Punia, K. M. Sangwan and P. Khandelwal, Ceram. Int., 2018, 44, 23125–23136 CrossRef CAS.
- Z. Guo, Q. Zhu, S. Wu, C. Hu, L. Liu and L. Fang, Ceram. Int., 2018, 44, 7700–7708 CrossRef CAS.
- Z. Zhou, Y. Li, L. Yang, X. Dong and H. Yan, Appl. Phys. Lett., 2007, 90, 212908 CrossRef.
- B. L. Deng, X. L. Zhu, X. Q. Liu and X. M. Chen, RSC Adv., 2017, 7, 27370–27376 RSC.
- S. Fei Liu, Y. Jun Wu, J. Li and X. Ming Chen, Appl. Phys. Lett., 2014, 104, 082912 CrossRef.
- M. Prades, N. Masó, H. c. Beltrán, E. Cordoncillo and A. R. West, Inorg. Chem., 2013, 52, 1729–1736 CrossRef CAS PubMed.
- S. Jindal, S. Devi, M. Batoo, G. Kumar and A. Vasishth, Phys. B, 2018, 537, 87–92 CrossRef CAS.
- B. Behera, P. Nayak and R. Choudhary, Mater. Chem. Phys., 2007, 106, 193–197 CrossRef CAS.
- P. Ganguly and A. Jha, Phys. B, 2010, 405, 3154–3158 CrossRef CAS.
- A. K. Behera, N. Mohanty, S. Satpathy, B. Behera and P. Nayak, Acta Metall. Sin., 2015, 28, 847–857 CrossRef CAS.
- P. Gupta, P. Mahapatra and R. Choudhary, J. Phys. Chem. Solids, 2020, 137, 109217 CrossRef CAS.
- S. Kumar, R. Kurchania and A. Kumar, Ceram. Int., 2019, 45, 17137–17143 CrossRef CAS.
- M.-D. Li, X.-G. Tang, S.-M. Zeng, Y.-P. Jiang, Q.-X. Liu, T.-F. Zhang and W.-H. Li, J. Materiomics, 2018, 4, 194–201 CrossRef.
- A. Yadav, S. P. Mantry, M. Fahad and P. Sarun, Phys. B, 2018, 537, 290–295 CrossRef CAS.
- V. Petříček, M. Dušek and L. Palatinus, Zeitschrift für Kristallographie - Crystalline Materials, 2014, 229, 345–352 Search PubMed.
- S. Rani, N. Ahlawat, R. Punia, K. M. Sangwan and S. Rani, Ceram. Int., 2018, 44, 5996–6001 CrossRef CAS.
- B. Arya and R. Choudhary, Ceram. Int., 2020, 46, 4222–4234 CrossRef CAS.
- J. Joshi, D. Kanchan, M. Joshi, H. Jethva and K. Parikh, Mater. Res. Bull., 2017, 93, 63–73 CrossRef CAS.
- X. Chen, Y. Sun and X. Zheng, J. Eur. Ceram. Soc., 2003, 23, 1571–1575 CrossRef CAS.
- C. Hu, Z. Sun, Q. Zhu, L. Fang and L. Liu, J. Mater. Sci.: Mater. Electron., 2015, 26, 515–520 CrossRef CAS.
- S. Nath, S. K. Barik and R. Choudhary, J. Mater. Sci.: Mater. Electron., 2016, 27, 8717–8724 CrossRef CAS.
- S. M. Pilgrim, A. E. Sutherland and S. R. Winzer, J. Am. Ceram. Soc., 1990, 73, 3122–3125 CrossRef CAS.
- I. W. Kim, C. W. Ahn, J. S. Kim, T. K. Song, J.-S. Bae, B. C. Choi, J.-H. Jeong and J. S. Lee, Appl. Phys. Lett., 2002, 80, 4006–4008 CrossRef CAS.
- P. Ganguly, S. Devi, A. Jha and K. Deori, Ferroelectrics, 2009, 381, 111–119 CrossRef CAS.
- D. C. Sinclair and A. R. West, J. Appl. Phys., 1989, 66, 3850–3856 CrossRef CAS.
- H. Ali, S. Karim, M. Rafiq, K. Maaz, A. ur Rahman, A. Nisar and M. Ahmad, J. Alloys Compd., 2014, 612, 64–68 CrossRef CAS.
- M. S. Abouzari, F. Berkemeier, G. Schmitz and D. Wilmer, Solid State Ionics, 2009, 180, 922–927 CrossRef.
- J. R. Macdonald and E. Barsoukov, History, 2005, 1, 1–13 Search PubMed.
- J. R. Macdonald, Solid State Ionics, 1984, 13, 147–149 CrossRef CAS.
- A. K. Jonscher, J. Phys. D: Appl. Phys., 1999, 32, R57 CrossRef CAS.
- K. Funke, Solid State Ionics, 1988, 28, 100–107 CrossRef.
- S. S. Shah, K. Hayat, S. Ali, K. Rasool and Y. Iqbal, Mater. Sci. Semicond. Process., 2019, 90, 65–71 CrossRef CAS.
- S. Elliott, Adv. Phys., 1987, 36, 135–217 CrossRef CAS.
- R. Muhammad, A. Khesro and M. Uzair, J. Electron. Mater., 2016, 45, 4083–4088 CrossRef CAS.
- J. Scott and M. Dawber, Appl. Phys. Lett., 2000, 76, 3801–3803 CrossRef CAS.
- U. Balachandran, B. Odekirk and N. Eror, J. Mater. Sci., 1982, 17, 1656–1662 CrossRef CAS.
- T. Badapanda, V. Senthil, S. Rout, L. Cavalcante, A. Z. Simões, T. Sinha, S. Panigrahi, M. De Jesus, E. Longo and J. A. Varela, Curr. Appl. Phys., 2011, 11, 1282–1293 CrossRef.
- G. Singh, V. Tiwari and P. Gupta, J. Appl. Phys., 2010, 107, 064103 CrossRef.
- L. Liu, Y. Huang, Y. Li, M. Wu, L. Fang, C. Hu and Y. Wang, Phys. B, 2012, 407, 136–139 CrossRef CAS.
- J. C. Abrantes, J. A. Labrincha and J. R. Frade, Mater. Res. Bull., 2000, 35, 727–740 CrossRef CAS.
- T. Badapanda, V. Senthil, S. Rout, S. Panigrahi and T. Sinha, Mater. Chem. Phys., 2012, 133, 863–870 CrossRef CAS.
- S. Hosseini, K. Ranjbar, R. Dehmolaei and A. Amirani, J. Alloys Compd., 2015, 622, 725–733 CrossRef CAS.
- K. S. Cole and R. H. Cole, J. Chem. Phys., 1941, 9, 341–351 CrossRef CAS.
- Y. Wong, J. Hassan and M. Hashim, J. Alloys Compd., 2013, 571, 138–144 CrossRef CAS.
- B. Chowdari and R. Gopalakrishnan, Solid State Ionics, 1987, 23, 225–233 CrossRef CAS.
- K. Padmasree, D. Kanchan and A. Kulkarni, Solid State Ionics, 2006, 177, 475–482 CrossRef CAS.
- S. Brahma, R. Choudhary and A. K. Thakur, Phys. B, 2005, 355, 188–201 CrossRef CAS.
- S. K. Barik, R. Choudhary and A. Singh, Adv. Mater. Lett., 2011, 2, 419–424 CrossRef CAS.
- R. Bergman, J. Appl. Phys., 2000, 88, 1356–1365 CrossRef CAS.
| This journal is © The Royal Society of Chemistry 2020 |

