 Open Access Article
Matrix solid-phase dispersion as a greener alternative to obtain bioactive extracts from Haematococcus pluvialis. Characterization by UHPLC-QToF†
Aly Castillo *a,
Simón Pereira
 b,
Ana Otero
 c,
Sarah Fiol
 d,
Carmen Garcia-Jares
 a and
Marta Lores
 a
a
aCRETUS Institute, Department of Analytical Chemistry, Nutrition and Food Science, Universidade de Santiago de Compostela, Campus Vida, E-15782 Santiago de Compostela, Spain. E-mail: marta.lores@usc.es; carmen.garcia.jares@usc.es; alyjesus.castillo.zamora@usc.es; Tel: +34-881-814379
bAstaco Technologies B.V., Remmingweg 2-4, 1332 BE Almere, The Netherlands. E-mail: simon@astaco-technologies.com
cAquiculture and Biotechnology (AQUABIOTECH), Department of Microbiology and Parasitology, Universidade de Santiago de Compostela, Campus Vida, E-15782 Santiago de Compostela, Spain. E-mail: anamaria.otero@usc.es
dCRETUS Institute, Department of Soil Science and Agricultural Chemistry, Universidade de Santiago de Compostela, Campus Vida, E-15782 Santiago de Compostela, Spain. E-mail: sarah.fiol@usc.es
First published on 28th July 2020
Abstract
So far, research on the microalga Haematococcus pluvialis has been focused mainly on the exploitation of its high astaxanthin content, leaving aside the use of other bioactive compounds present. This study is focused on obtaining and characterizing extracts enriched in bioactive compounds from this microalga red aplanospores. This is performed by means of Matrix Solid-Phase Dispersion (MSPD) extraction process, in an environmentally friendly way with low energy consumption and GRAS solvents. The effects of extraction parameters, particularly the extraction solvents (ethanol, ethyl lactate and water) are studied, in order to obtain maximum recovery of the main antioxidant compounds of interest (carotenoids, fatty acids and derivatives). Characterization of extracts is carried out by HPLC-DAD (High Performance Liquid Chromatography Diode Array Detector) and UHPLC-QToF (Ultra High-Performance Liquid Chromatography Quadrupole Time-of-Flight). The results show that MSPD produced extracts with higher bioactive compound recoveries than conventional cell disruption extractions. At the same time, a novel untargeted characterization for this species is performed, identifying compounds not previously dated in H. pluvialis, which include 10-phenyldecanoic acid and the -oxo and -hydroxy derivatives of palmitic acid. This approach, first applied to a freshwater microalgae, characterized by rigid and resistant aplanospores, provided a synergistic and sustainable extract, giving a broader focus on the use of this microalga.
Introduction
The microalga Haematococcus pluvialis is one of the most abundant and commercially produced freshwater species.1 The market for this microalga is mainly focused on the generation of biomass for the production of carotenoids, more specifically astaxanthin.2 It is estimated that world production of this microalga reaches 1000 tons per year just to obtain this carotenoid.3 Laboratory cultures of H. pluvialis, in contrast to any other microalgae species, do not possess distinctive cultivation characteristics, but their large-scale production focused only on obtaining astaxanthin is a challenging task, mainly due to diversity of environmental and operational factors that affect the accumulation of this compound.4 At the same time, astaxanthin produced by extracting biomass from microalgae only accounts for 1% of the world carotenoid market, since the processes of preparing synthetic astaxanthin leads to lower costs and higher production volumes.5 In this context, the search for other compounds of interest that enable a greater use of biomass has been increased, in turn enriching the bioactive power of astaxanthin-rich biomass in a synergic way.6In contrast to the 5% astaxanthin content that H. pluvialis can store, the lipid content can reach approximately 35% of dry weight, with a high amount of fatty acids of the omega-3 and omega-6 series.7,8 In contrast, the potential content of H. pluvialis as a source of fatty acids has generated great interest in recent years, having a significant impact on the nutraceutical sector.9 To isolate these bioactive compounds from microalgae, extraction is the first key step, and the need to select the most appropriate extraction methodology is evident.10 Recently, accelerated and compressed fluid-based extraction techniques such as Accelerated Solvent Extraction (ASE), Ultrasound-Microwave Assisted Extraction (UMAE), Pressurized Liquid Extraction (PLE) and Supercritical Antisolvent Fractionation (SAF), have gained considerable interest in the extraction of bioactive substances from algae.11–13 Many of these techniques are efficient on a small scale, not being widely applied in the industrial field due to their high energy requirements.14 In addition, there is currently a limited understanding of the key variables that affect the performance of these extraction processes.15 In turn, the solvents used in these techniques focus only on the extraction of carotenoids, without taking into account the solubilisation of other bioactive compounds.
Matrix solid-phase dispersion (MSPD) is a simple, fast, fairly straightforward and sustainable technique for extracting compounds from a wide variety of complex samples.16 The versatility and flexibility of MSPD allows this process to be applied to an extensive range of analytes isolated from an also wide range of matrices.17 In addition, scale-up processes based on similar principles as this technique have been patented and applied to biological matrices in search of bioactive compounds, showing excellent results in the generation of extracts on an industrial scale.18 At present, no information has been found about the application of MSPD in search of bioactive compounds in freshwater microalgae. Only one study has reported the use of this technique in seawater microalgae species (Isochrysis zhangjiangensis and Nannochloropsis oculata) with a simple disruption due to the non-existence of a very hard aplanospore, showing acceptable reproducibility, recovery, extraction efficiency and lower solvent consumption in relation to conventional extraction techniques such as ultrasonic extraction for three carotenoids.19 In line with these processes, generally recognized as safe (GRAS) solvents such as food-grade ethanol or water are used, being compatible with nutraceutical applications.12,13,20,21 In addition, ethyl lactate has recently gained much attention in the extraction of bioactive compounds.22 This organic solvent, while being suitable for consumption, shows an excellent affinity for carotenoid compounds as well as for various fatty acids.23
Therefore, the present work aims to obtain bioactive extracts, with a high content of carotenoid compounds fatty acids, and derivatives from red stage aplanospores of the microalga H. pluvialis, using the scalable extraction method MSPD, in combination with green organic solvents and metabolomic techniques of characterization, giving a broader and more sustainable use focus to this microbiological matrix.
Materials and methods
Reagents and materials
The solvents used for the extraction process were absolute food grade ethanol (above 99.8%) provided by VWR (Leicestershire, England), ethyl lactate supplied by Fluka Analytical (Steinheim, Germany) and Ultrapure water MS-grade from Scharlab (Barcelona, Spain). For MSPD extraction, sand was used as a dispersant medium with an average particle size of 2 × 10² to 3 × 102 μm Scharlau Chemie S.A. (Barcelona, Spain). For mobile phase preparation in HPLC-DAD and UHPLC-QToF-MS/MS, MS-grade methanol obtained by Sigma-Aldrich Chemie GmbH (Steinheim, Germany) and formic acid obtained by Merck (Darmstadt, Germany) were used. The astaxanthin standard was provided by Biosynth Carbosynth (Berkshire, United Kingdom), β-carotene was supplied by ThermoFisher (Kandel, Germany) and zeaxanthin and lutein were supplied by Extrasynthese (Genay, France).Standard solutions were prepared in ethanol. The extraction processes and preparation of standards were carried out in a red-light room, in a dry environment. Standards and extracts were stored in amber glass containers, sealed with paraffinic material and kept in a dark and controlled environment at −20 °C. Reagents and samples were stored in different places to avoid cross-contamination.
Red stage Haematococcus pluvialis biomass
Freeze-dried red stage H. pluvialis biomass was kindly donated by Astaco Technologies B.V. (The Netherlands). General details of the H. pluvialis production process are described by Pereira.2 In summary, cultures of H. pluvialis were carried out in 150 L industrial scale flat-plate photobioreactors (optical path of 50 mm) following a two-stage approach where green and red cells were produced separately. Once green vegetative-stage cells reached a certain density, the culture parameters were changed in order to favour inductive conditions, triggering astaxanthin accumulation by the microalgae. Inductive conditions included nitrate depletion, CO2 availability and a continuous irradiance of 750 μmol photon m−2 s−1 produced by LED light sources with a mixed light composition of red and blue wavelengths. Astaxanthin-rich (∼5% dry cell weight) microalgal biomass was harvested by centrifugation on the seventh day after the onset of inductive conditions and it was stored frozen at −28 °C prior to lyophilization, which was carried out in the dark until a powdered biomass with a moisture content below 5% in weight was achieved.Matrix solid-phase dispersion extraction MSPD
Initially, the whole extraction process was carried out in a dark room, only under the incidence of red light, in an environment with an average temperature of 21 °C. The lyophilized H. pluvialis biomass, after being removed from storage at −20 °C, was tempered and weighed in the different sample sizes presented in this work. The microalga was disrupted with 0.8 g of sand in a glazed porcelain mortar to reduce porosity and avoid loss of material (Fig. 1). The hand of the mortar also contains a glazed tip to avoid porosity and passage of material. The sample was added to the dispersing medium and disrupted for 5 min, until a homogeneous paste was obtained, with an oily appearance as a result of the breakage of the cell when its content was released. This mixture was transferred to a MSPD column, which initially contains a layer of glass wool and 0.2 g of sand as a filter medium. Finally, to avoid the creation of preferential paths by the solvent, another layer of glass wool was placed on top that works as a fluid disperser. The extract was obtained by adding the solvent to the bed, controlling the discharge flow by means of a regulating valve. Extracts are stored in amber vials at −20 °C to avoid degradation.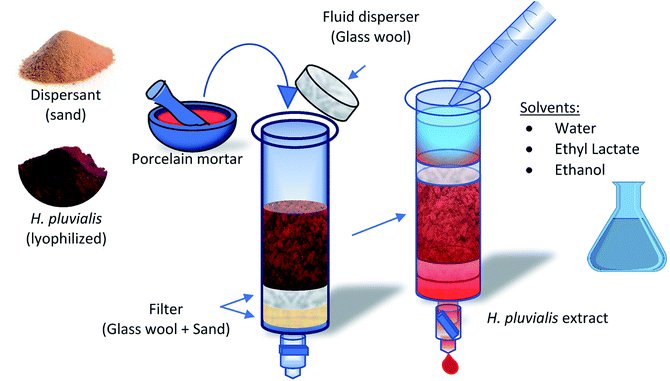 | ||
| Fig. 1 Scheme of the extraction process using the MSPD technique applied to red stage biomass of the microalga H. pluvialis. | ||
Cell disruption method
For the extraction of bioactive compounds by means of the cell disruption, an established aliquot of the corresponding solvent (ethanol, water, or ethyl lactate) was transferred into a test tube. Then, the lyophilized H. pluvialis powder was tempered and weighed. All this mixture was placed in an external cold bath without contact with the sample, in order to maintain the temperature in the disruption process. The cell disruptor used was a basic mechanical dispersion instrument, which incorporates a high performance IKA T25 rotor-stator system at 24![[thin space (1/6-em)]](https://www.rsc.org/images/entities/char_2009.gif) 000 rpm. The equipment was inserted into the test tube in such a way that there was a space of 1 cm between the bottom of the tube and the rotor-stator system of the disruptor. The disruption is carried out in 15 min, the maximum effective time of the equipment. The sample was then centrifuged for 10 min, and subsequently decanted and stored in amber vials at −20 °C.
000 rpm. The equipment was inserted into the test tube in such a way that there was a space of 1 cm between the bottom of the tube and the rotor-stator system of the disruptor. The disruption is carried out in 15 min, the maximum effective time of the equipment. The sample was then centrifuged for 10 min, and subsequently decanted and stored in amber vials at −20 °C.
High performance liquid chromatography diode array detector HPLC-DAD
HPLC-DAD chromatographic study was carried out using a Jasco AS-4100 chromatograph with a PU-4180 quaternary pump, an AS-4150 autosampler, a Kinetex chromatographic column 5 μm C18-100 Å (4.6 mm × 150 mm, 2.6 μm) (Phenomenex, Torrance, USA), and a MD-4010 PDA diode detector. The mobile phase consisted of a 1% formic acid solution in water (A) and in methanol (B). Thus, with a constant temperature of 50 °C and a flow of 1 mL min−1, a proportion of 25% of (A) in 75% of (B) is established during 5 min, then it is taken by a progressive ramp up to 100% (B) in 10 min, and hold 20 min. UV-Vis spectra were acquired from 250 nm to 520 nm to determine the maxima absorption of the identified compounds. The samples were filtered by 0.22 μm polytetrafluoroethylene (PTFE) filters before being injected.Ultra high performance liquid chromatography quadrupole time-of-flight mass spectrometry (UHPLC-QToF)
Targeted and untargeted analysis of the compounds were carried out in an Elute UHPLC 1300 coupled to a quadrupole time-of-flight mass spectrometry (QToF) Compact Instrument (Bruker Daltonics). Column ThermoScientific HypersilGold aQ (1.9 μm, 100 mm × 2.1 mm) was kept at a constant temperature of 40 °C. Mobile phase consisted of 4 mM formic acid in water (A) and methanol (B). The acquisition run takes 15 min with a flow rate of 0.25 mL min−1. Gradient method starts in 95% (A)/5% (B) for 0.4 min, lineally goes to 35% (B) in 0.1 min, and to 100% (B) in 7 min, hold for 5 min. Then, return to the initial conditions until reaching 15 min.Electrospray ionization (ESI) acquisition was performed with the Auto MS/MS method both in negative and positive modes, detecting mainly pseudo-molecular ions [M − H]− and [M + H]+ respectively, with presence of ions with water loss as [M − H2O + H]+ and sodium adducts [M + Na]+, using a voltage ramp from 10 to 105 eV, with spectra rate of 8 Hz and mass filtering from 20 to 1000 m/z, with a total cycle time range equal to 1s. All acquisitions were obtained using the Compass HyStar software and processed using the DataAnalysis Version 5.1 (Build 201.2.4019) and MetaboScape Compass Version 4.0.4 (Build 19) software, applying algorithms based on intensity, isotope profile and mass error; to process the hundreds of compounds acquired. In MetaboScape software, the identification tool SmartFormula was used, which provides possible molecular structures of the acquired analytes by means of their exact mass and isotopic profile (checking the analyte in all the samples tested and all the adducts identified); as well as the tools compound Crawler and MetFrag, which perform searches in the main online databases of chemical compounds (PubChem, ChEBI and ChemSpider), as well as the in silico fragmentation of the compounds chosen as possible candidates.24,25
Results and discussion
Comparison of two extraction methods (MSPD and cell disruption)
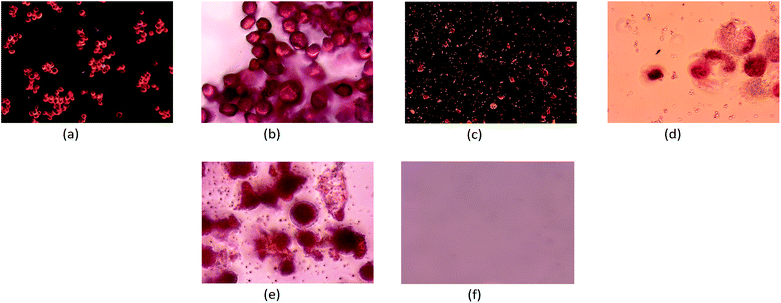
Extractions of red H. pluvialis aplanospores were carried out using MSPD in contrast to traditional extraction procedures, such as the use of a cell disruptor, in order to test the efficiency of the proposed method. To perform an analysis under the same guidelines, food grade ethanol as extraction solvent, and the same lyophilized microalgal biomass were used. With the purpose of evaluate the response generated with the applied methods (MSPD and cell disruption) by the modification of the extraction parameters, the different sample sizes, extraction volumes and disruption times used are summarized in Table 1. The disruption time is the only parameter that differs between the methods. Rotor-stator systems like the cell disruptor can only offer a maximum disruption time of 15 minutes due to heat generation. After this time, the system only provides heat to the medium. In this way, disruption is carried out in the maximum time offered by the equipment (15 min) by immersion in an ice bath to avoid heating of the sample.To reliably demonstrate the disruption of the particles, a detailed analysis of the results was carried out using a microscope. Fig. 2 illustrates comparative images of the transformation process of the microalga from its base state. The images Fig. 2a (10×) and Fig. 2b (40×) show the initial state (before disruption) of the biomass of red stage H. pluvialis aplanospores. Here the microalga presents a mature profile with a rigid, resistant, and well defined pseudo-spherical cell wall, characteristic of aplanospores.26 Moreover, the potential bioactive compounds are inefficiently available, making their extraction by primary contact with the solvent difficult. In contrast, Fig. 2c and d detail a set of cells fractured by the cell disruptor, showing a small group that still keep their cell wall closed, losing rigidity and presenting a gelatinous morphology, which generates a more labile matrix, being its cytoplasmic content very accessible to solvents.
Due to the disruption step in the MSPD process (Fig. 2e), all cells have a gelatinous structure where their contents have largely been drained without the addition of solvents. This first point of comparison reveals that the MSPD method initially generates a disruption qualitatively comparable to the contrasted method. After performing the whole MSPD process, no cell or cell wall remains visible (Fig. 2f). This is due to the intrinsic filtration process of the extractive method. The image indicates the obtaining of a homogeneous solution that, as it will be seen later, contains the bioactive compounds of interest.
In order to quantitatively determine the extraction efficiency, the main carotenoid compounds contained in H. pluvialis are used as markers. “Astaxanthin formed the major proportion of carotenoids in H. pluvialis red aplanospores followed by violaxanthin, free astaxanthin, lutein, zeaxanthin, α-carotene, and β-carotene”.27 Thus, astaxanthin, zeaxanthin, lutein and β-carotene were chosen as markers of this microalga to determine the relative percentages of recovery by the two extractive methods. The carotenoid profile was evaluated by means of HPLC-DAD, injecting standards dissolved in ethanol to obtain comparable retention times (Rt) and spectra.
Fig. S1† shows the overlaid chromatograms of the selected carotenoids extracted by MSPD and their respective standards using ethanol as solvent. Zeaxanthin and lutein have isomeric structures presenting very similar retention times and absorption spectra, thus following data were calculated as the contribution of both.
All marker carotenoids were identified with a correlation coefficient between the experimental and the spectral library absorption spectra higher than 0.986, as shown in Table 2. The difference between the retention time obtained by standards injection, and the retention time resulting from extracts injection, did not exceed 1%. The wavelength of maximum absorption has been established between 445 and 470 for the carotenoids presented here.
| Carotenoid | Sample retention time (min) | Standard retention time (min) | Correlation factor (R) | λmax of absorption (nm) |
|---|---|---|---|---|
| Zeaxanthin | 12.337 | 12.363 | 0.996 | 451 |
| Lutein | 12.337 | 12.316 | 0.993 | 445 |
| Astaxanthin | 11.473 | 11.433 | 0.986 | 470 |
| β-Carotene | 19.317 | 19.213 | 1.000 | 453 |
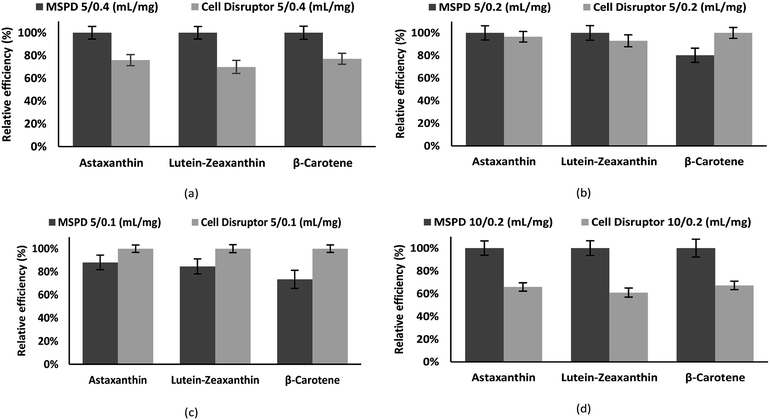
Fig. 3 shows the recovery obtained for the carotenoids astaxanthin, zeaxanthin–lutein and β-carotene with the standard cell disruption method and with MSPD method. The ratio extraction volume/sample size is exemplified, with values of 5/0.4, 5/0.2, 5/0.1 and 10/0.2 mL mg−1. The recovery of carotene compounds is presented as a percentage relative efficiency value referring to the compound with the highest concentration, obtained with the technique and method of extraction described there.
Carotenoids recovery by means of MSPD is superior in all the cases except when working with smaller mass quantities (Fig. 3c) where the cell disruptor shows a greater efficiency; MSPD bed size decreases with lower mass, shorten the time of contact of the extractive solvent, obtaining therefore a smaller recovery.
By gradually increasing the mass (Fig. 3b), the dimension of the package increases, modifying the geometry of the extractive bed and improving recoveries; leading up to the best ratio (when 5 mL is used as solvent volume), 5 mL/0.4 mg (Fig. 3a), where a clear difference is demonstrated, being the MSPD extraction much more effective. In Fig. 3d a ratio of extraction volume/sample size of 50 as in (c) is maintained, obtaining, in contrast, a better extraction through MSPD. This is due to the increased sample size, which in turn decreases the efficiency of the disruptor. In addition, the increment extraction volume increases the extraction time, where the downstream flow generated in the MSPD cartridge provides a carotenoid enriched extract at the bottom and a virgin solvent at the top, thus creating a constant wash, avoiding solvent saturation while producing a short maceration. On the contrary, in the cell disruptor, the solvent is not renewed with fresh solvent, the molecules are broken, gradually saturating it, which is less effective in facilitating the rupture of the cell membranes and the extraction of the carotenoids. This results in efficient use of the extraction solvent by the MSPD in relation to the traditional method, generating greater recovery at equal extraction volumes.
This comparison of extraction methods shows that MSPD extraction generates an extract rich in bioactive compounds superior to the cell disruptor, applying shorter disruption times, without the generation of heat which eliminates the process of continuous cooling of the sample. In turn, the MSPD's intrinsic filtration process provides a homogeneous extract, free from subsequent filtration processes, which not only require more energy, but also generate higher costs and longer production times for the extracts. In addition, the effectiveness of MSPD with larger sample sizes relative to the cell disruptor demonstrates the potential for scaling up the extraction technique.
Identification of targeted-untargeted analytes by UHPLC-QToF
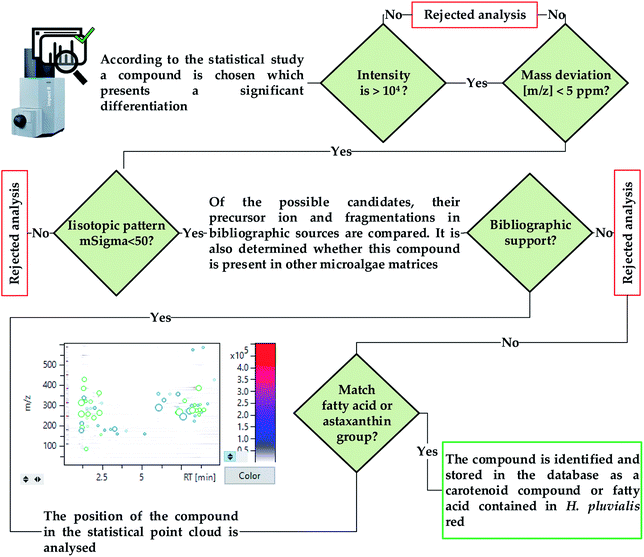
Current research and commercial interest in relation to the extracts obtained from H. pluvialis red aplanospores is focused on obtaining astaxanthin. This study explores the extraction and characterization of bioactive compounds, whether they are carotenoids such as astaxanthin, or potential new unidentified compounds. In this way, it is necessary to perform a high sensitivity untargeted analysis that allows the identification of the greatest number of compounds, while ensuring an effective characterization. For this purpose, a high-resolution Auto MS/MS acquisition was performed, which is much less time consuming than other acquisition methods such as manual selection of precursors using LC-MS. The automatic mode combines MS scanning cycles with programmed MS/MS scans for precursor ion detection depending on their relative abundance in the MS scan, thus allowing both MS and MS/MS data to be acquired in a single analysis.28To validate the identification of a compound, two main criteria are used, the exact mass and the deviation from the isotopic pattern, as a function of its theoretical value, quantified as mSigma by the T-Rex 3D algorithm used by MetaboScape. The calculation algorithm, illustrated in Fig. 4, is created establishing values of 5 ppm and 50 mSigma as the maximum acceptable deviation of the mass of the compound and the isotopic pattern respectively.29
Initially, a database of specific compounds (carotenoids and fatty acids) obtained from literature search in relation to microalgae and cyanobacterial matrices was constructed, combining it with the internal data of the MetaboScape software, which generates the exact masses from the molecular formula of the analytes.30 All this process is carried out in a targeted way, since the compounds are identified by previous lists introduced in the software, but these represent only a small part of all the masses quantified by the equipment. In this way, the untargeted process begins, which becomes much more complex since the compounds of interest must be separated from noise signals and interfering analytes. Thus, a comprehensive identification is carried out guided by the application of a Principal Component Analysis (PCA) tool. PCA is a model which reduces the data matrix summarizing the variance in a set of variables in fewer dimensions than those of the original data set.31 By studying the PCA model, the results summarized in Fig. 5 are obtained, in which a “topography view” is observed where the intensities of the compounds are plotted against the retention times and m/z values. Each circular marker represents an analyte, located in its main ions retention time and m/z and sized according to its intensity. The color-coded intensity scale (right) represents the highest intensity in the area shown. This tool allows an easy grouping of compounds that share retention times and mass profiles, making it easy to classify the analysed untargeted compounds.
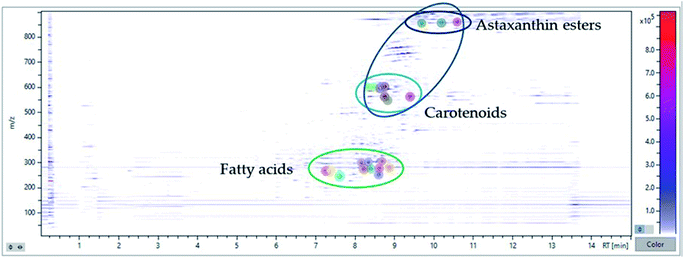 | ||
| Fig. 5 Overlay of chromatography and mass profiles (negative and positive ionization) of the bioactive compounds identified in MSPD extract of H. pluvialis red aplanospores by UHPLC-QTOF. | ||
In this way, fatty acid derivatives, which have not been previously reported for this microalga, were effectively identified in this work, being proposed by the calculation algorithm as irrefutable candidates, and being again corroborated since they are within the group of fatty compounds.
Targeted characterization of carotenoids
The results obtained in the process of carotenoid identification are summarized in Table 3. The m/z ion 597 was detected and characterized as the protonated molecule of astaxanthin. The base peak at m/z 147.1 shown in Fig. S2a,† product of the fragmentation of the C17–C18 bond of the aliphatic chain at a collision energy of 37.8–38.0 eV, corresponds to the terminal ring without the presence of the hydroxyl group. The fragments m/z 201.1 and 173.1 are formed in a similar way, these are product of the rupture of the carbons 20–21 and 19–20–31 respectively, in conjunction with the loss of water by the ring. The m/z ion 119 is the second most intense ion shown by astaxanthin, this is produced by the rupture of the terminal carbon of the central chain with the terminal ring. All these ions were detected by APCI-MS in previous works, for the astaxanthin molecule.32 The compounds canthaxanthin (m/z 565.4) (Fig. S2b†), echinenone (m/z 551.4) (Fig. S3a†) and diadinoxanthin ion product [M − H2O + H]+ (m/z 565.4) (Fig. S2c†), generated by fragmentation the m/z ions 173.1, 119.1 and 133.1 which are characteristic for this family of compounds.33| Rt (min) | Carotenoid | Formula | Mode | Ion | m/z | Fragments | mSigma | Δm/z [ppm] | E (eV) |
|---|---|---|---|---|---|---|---|---|---|
| a AME (astaxanthin monoester). | |||||||||
| 8.31 | Neoxanthin–violaxanthin | C40H56O4 | [M + H]+ | C40H57O4+ | 601.4(64) | 167.1(100); 318(64); 119(64); 221.1(56) | 18.24 | 2.59 | 38.0–38.1 |
| 8.53 | Neoxanthin–violaxanthin | C40H56O4 | [M + H]+ | C40H57O4+ | 601.4(34) | 221(100); 318(41); 119(23) | 39.31 | 1.51 | 38.0 |
| 8.63 | Astaxanthin | C40H52O4 | [M + H]+ | C40H53O4+ | 597.4(33) | 147.1 (100); 201.1 (19); 119.1(53); 173.1(34); 379.3(22) 285.2(12) | 24.92 | 1.83 | 37.8–38.0 |
| 8.82 | Echinenone | C40H54O | [M + H]+ | C40H55O+ | 551.4(37) | 119.1(100); 173,1(46); 145.1(96), 133(72); 289(87) | 5.04 | 3.10 | 36.5 |
| 9.39 | Canthaxanthin | C40H52O2 | [M + H]+ | C40H53O2+ | 565.4(62) | 173.1(34); 133.1(31); 145.1(29); 187.1(14); 119.1(18) | 17.46 | 1.51 | 21.9 |
| 9.69 | aAME C18:4 | C58H78O5 | [M + H]+ | C58H79O5+ | 855.6(16) | 147.1 (100); 173.1(67); 201.1(37); 119.1(49); 145.1(33); 109.1(27) | 5.23 | 1.41 | 46.0 |
| 10.18 | aAME C18:2 | C58H82O5 | [M + H]+ | C58H83O5+ | 859.6(20) | 147.1 (100); 173.1(73); 201.1(41); 119.1(43); 145.1(37); 109.1(30) | 23.65 | 2.58 | 45.7–45.8 |
| 10.59 | aAME C18:1 | C58H84O5 | [M + H]+ | C58H85O5+ | 861.6(9) | 147.1 (100); 173.1(74); 201.1(38); 119.1(37); 145.1(35); 109.1(33) | 21.10 | 2.04 | 45.7–47.9 |
The compounds violaxanthin and neoxanthin are identified as shown in Table 3 with the m/z ion 601.4, generating the ions products m/z 221, 318 and 119 illustrated in Fig. S3b and c.† The bibliographic study shows in several analyses that the neoxanthin has a lower retention time than violaxanthin, because it presents higher polarity.34 At the same time, in an in-depth study about several carotenoid compounds, Rivera et al. showed the proportions of ions produced by these two compounds (neoxanthin and violaxanthin), being comparable with the data obtained here.35 Thus, it is proposed that the compound with a retention time of 8.31 min is neoxanthin and the one with a retention time of 8.53 min is violaxanthin.
The compounds with the highest retention times within the carotenoid group were the astaxanthin monoesters (AME) C18:1, C18:2, C18:4 with the m/z ions 855.6, 859.6 and 861.6, respectively. It is simple to identify these compounds by software because they have similar mass and retention time, classified in Fig. 5 at the top as a subgroup, which in turn shares a distant relationship with the lower subgroups. The ions identified in all the astaxanthin esters: m/z 147.1, 119.1, 173.1 and 201.1; are characteristic of astaxanthin, being conclusive proof in the identification as derivatives of this carotenoid.36
Targeted and untargeted characterization of fatty acids
In order, to profile the main fatty acids contained in H. pluvialis, an analysis was carried out by means of UHPLC-QToF, both in a targeted way, entering diverse possible fatty acid candidates, and untargeted through the exhaustive analysis of the diverse compounds obtained. In this way, in Table 4, a total of 8 fatty acids are presented, of which, by means of the targeted identification, it was possible to characterize diverse compounds of the family of the polyunsaturated fatty acids. From the omega-6 series were identified: eicosapentaenoic acid (EPA) (m/z 301.2), arachidonic acid (m/z 303.2), linoleic acid (m/z 279.2) and eicosadienoic acid identified with the m/z 307.3 ion, which has been previously determined in microalgae species and cyanobacteria such as Nostoc spongiforme, Oscillatoria tenuis and Chlorococcus sp; presenting an important antimicrobial potential.37| Rt (min) | Fatty acid | Formula | Mode | Ion | m/z | mSigma | Δm/z [ppm] |
|---|---|---|---|---|---|---|---|
| 8.15 | EPA | C20H30O2 | [M − H]− | C20H29O2− | 301.2 | 10.00 | 1.23 |
| 8.20 | Linolenic acid (α + γ) | C18H30O2 | [M − H]− | C18H29O2− | 277.2 | 15.61 | 2.55 |
| 8.34 | Arachidonic acid | C20H32O2 | [M − H]− | C20H31O2− | 303.2 | 9.85 | 1.36 |
| 8.40 | Linoleic acid | C18H32O2 | [M − H]− | C18H31O2− | 279.2 | 13.47 | 2.79 |
| 8.59 | Palmitic acid | C16H32O2 | [M − H]− | C16H31O2− | 255.2 | 0.40 | 3.29 |
| 8.61 | Oleic acid | C18H34O2 | [M − H]− | C18H33O2− | 281.2 | 15.31 | 3.33 |
| 8.68 | Eicosadienoic acid | C20H36O2 | [M − H]− | C20H35O2− | 307.3 | 30.96 | 0.80 |
| 8.87 | Stearic acid | C18H36O2 | [M − H]− | C18H35O2− | 283.3 | 2.94 | 1.73 |
In turn, oleic (m/z 281.2) and linolenic (m/z 279.2) acids of the omega-9 and omega-3 series respectively were identified. These compounds have been reported for H. pluvialis in a great diversity of papers and are of high commercial interest due to their impact in the prevention of chronic diseases and reduction of heart diseases. In relation to saturated fatty acids, the compounds palmitic acid and stearic acid were identified with the ions m/z 255.2 and 283.3, respectively. These acids are common in several families of microalgae as in H. pluvialis red.30,38
Through untargeted analysis, as shown in Table 5, three interesting compounds, which were not found to be reported prior to this study, were identified in H. pluvialis. N-phenyldecanoic acid was identified by both positive and negative ionization, presenting a mass error of less than 1 ppm and a difference in its isotopic pattern of less than 10 mSigma. According to the biological matrix studied and the possible structures given by the compound Crawler algorithm in conjunction with fragmentation via MetFrag, it is proposed as an “N–” value equal to 10. 10-Phenyldecanoic acid is a linear alkylbenzene fatty acid not previously identified in H. pluvialis red aplanospores. These long-chain aromatic fatty acids, with the phenyl unit in the terminal carbon of the acyl chain, have been identified in species of the Plantae Kingdom, occurring in the aroid subfamilies with the species Dracunculus vulgaris, in the Brazilian plant of the genus Trichilia, as well as in the bacterium Vibrio alginolyticus associated with the seaweed Cladophora coelothrix.39
| Rt (min) | Compound | Formula | Mode | Ion | m/z | mSigma | Δm/z [ppm] |
|---|---|---|---|---|---|---|---|
| 7.25 | N-oxopalmitic acid | C16H30O3 | [M − H]− | C16H29O3− | 269.2 | 13.96 | 1.80 |
| 7.34 | N-hydroxypalmitic acid | C16H32O3 | [M − H]− | C16H31O3− | 271.2 | 3.03 | 2.50 |
| 7.60 | 10-Phenyldecanoic acid | C16H24O2 | [M − H]− | C16H23O2− | 247.2 | 1.72 | 3.51 |
| [M + H]+ | C16H25O2+ | 249.2 | 9.30 | 0.68 |
In H. pluvialis aplanospores, the palmitic acid derivatives N-oxopalmitic acid (m/z 269.2) and N-hydroxypalmitic acid (m/z 271.2) were also identified. These fatty acids derivatives, although not previously identified in H. pluvialis, have been characterized in other macroalgae and cyanobacteria such as Synechococcus and Synechocystis in the case of N-hydroxypalmitic acid as in Ulva pertusa and Porphyra sp in the case of N-oxopalmitic acid.37,40,41
Affinity of bioactive compounds for extraction solvents (ethyl lactate, ethanol, and water)
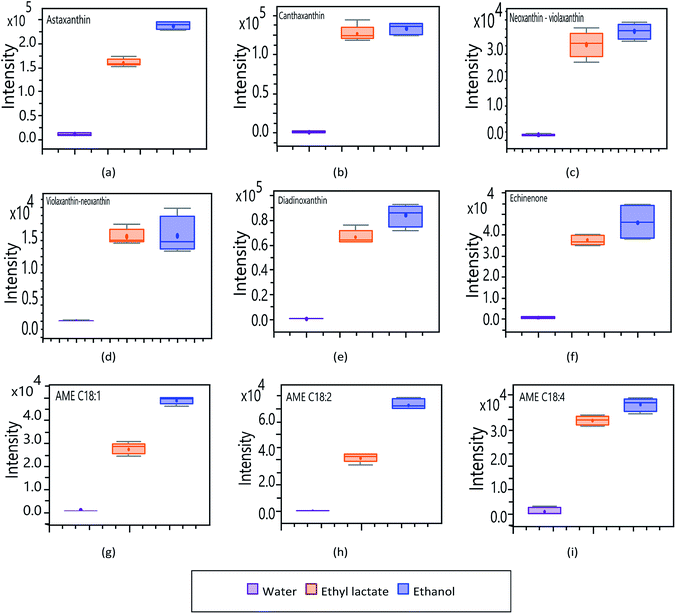
To determine the influence of extractive solvents in obtaining bioactive compounds by MSPD, an analysis of the signal response (intensity) of the main analytes of interest was performed. Fig. 6 shows the intensities of the carotenoid compounds identified in H. pluvialis as a function of the various solvents: water, ethanol, and ethyl lactate. In general, the recovery of carotenoid compounds using water as an extractive solvent is negligible in relation to more volatile solvents such as ethyl lactate and ethanol. This is due to the hydrophobic and lipophilic nature of these compounds, which are generally extracted from H. pluvialis with organic solvents of lower polarity such as DMSO and acetone.42,43 Unlike these solvents, ethanol and ethyl lactate are less volatile and less reactive food-grade solvents, which have affinity for carotenoid compounds and are much more promising for developing applications for the nutraceutical field.44,45Ethanol generally shows a slightly greater response in the extraction of carotenoid compounds; although, ethyl lactate extractions show comparable response values in most cases. In relation to the magnitude obtained in each compound, astaxanthin, canthaxanthin, diadinoxanthin and echinenone (Fig. 6a, b, e and f respectively); present a greater response assuming a greater abundance in the extracts. Fig. 6c and d correspond to the neoxanthin and violaxanthin isomers, where (c) by means of the previously developed analyses, is presumed to correspond to neoxanthin and (d) to violaxanthin. In terms of intensity, there is no important difference between these two compounds, they present a similar profile among the different solvents, being neoxanthin (c) the one that generates the highest response.
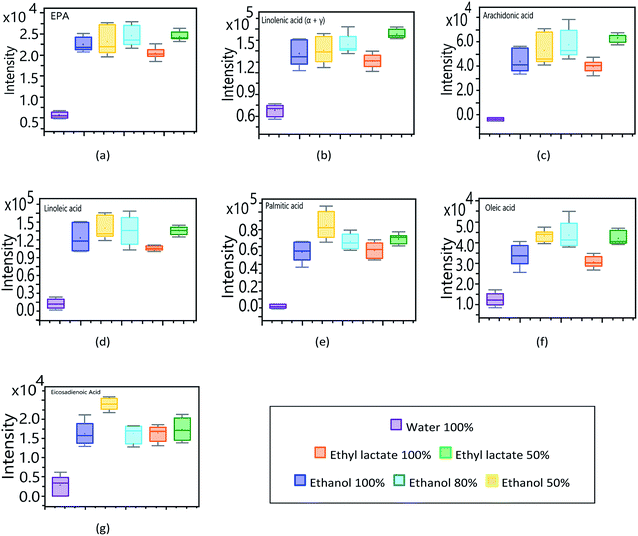
In relation to the astaxanthin monoesters (Fig. 6g, h and i), they all show the same pattern in the affinity profile to extraction solvents. As with other carotenoid compounds, AME show a greater response to the more volatile organic solvents, the extraction achieved with water being neglectable. In order to determine the affinity of the main fatty compounds, identified through the targeted analysis, towards the different solvents used (lactate, ethanol and water), an experimental design was planned considering pure solvents as well as mixtures of them (100, 80 and 50%). The obtained results are synthesized in Fig. 7 by means of box–plot graphs. The polyunsaturated acids EPA, arachidonic, linoleic, oleic, linolenic and eicosadienoic present a similar response profile in function of the solvents used. These omega-9, omega-6 and omega-3 series compounds show a greater response when working with ethanol–water 50% and lactate–water 50%. This presents a great advantage both operationally and for application to the nutraceutical field, since an extract is obtained that presents two main fractions: an organic part corresponding to ethyl lactate, which complies with the premises of a solvent according to principles of green chemistry, and another aqueous part, related to bioactive components of higher polarity and hydrophilic tendency.46
In order to use pure ethyl lactate as an essential fatty acid extraction solvent, a higher response intensity is observed in contrast to the other pure solvents analysed in this study. The feasibility of extraction by ethyl lactate not only provides good recovery, but also gives added value to the extracts, increasing their antimicrobial potential.47 At the same time, ethyl lactate provides a much denser aspect to the extract, similar to an emulsion, being much more manageable both in its storage and in its possible nutraceutical use.22
In contrast to essential fatty acids, lipid compounds linked to the -oxo, -hydroxy and -phenyl groups; show a substantial response when water is used as an extraction solvent. In Fig. 8, the compounds N-oxopalmitic acid (Fig. 8a) and N-hydroxypalmitic acid (Fig. 8b) show a similar pattern compared to the corresponding essential fatty acid, as long as organic solvents are considered, detailing a marked difference in the high response obtained when using pure water as an extractive solvent.
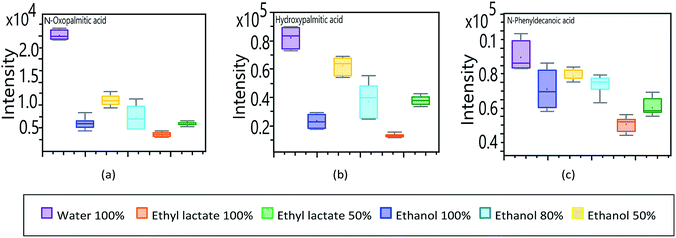 | ||
| Fig. 8 Analysis of UHPLC-QToF response of untargeted fatty acids to modifications in extraction solvents. (a) N-oxopalmitic acid. (b) N-hydroxypalmitic acid (c) 10-phenyldecanoic acid. | ||
Unlike palmitic acid, which has a hydrophobic nature, the -oxo and -hydroxy groups give it a more hydrophilic character.48 Palmitic acid has the shortest carbon chain of the essential fatty acids identified, which gives it less hydrophobic characteristics, exposing its terminal carboxyl group of a polar nature.
The decanoic acid derivative (Fig. 8c) presents a comparable response independently of the extraction solvent but showing a clear greater affinity for water. 10-Phenyldecanoic acid has the shortest aliphatic chain of all the fatty acids and derivatives analysed in this study. This compound has a 10-carbon chain with a terminal phenyl group, which although it does not present a significant polarity, is a bulky group that can moderately inhibit hydrophobic repulsion of the aliphatic chain. In turn, the phenyl group decreases the affinity contrast between the head and the tail of the molecule, increasing its tendency to dissolve in the aqueous phase.49
Conclusions
Through HPLC-DAD analysis, the feasibility of MSPD as a method to extract bioactive compounds derived from H. pluvialis aplanospores red versus the cell disruption method frequently applied has been demonstrated. In general, MSPD produced higher recoveries of the carotenoids used as markers than the standard cell disruption using ethanol as solvent. PCA divided the identified analytes into three main groups: carotenoids, esters, and fatty acids, allowing an efficient and accurate characterization of individual compounds belonging to each category. Targeted analysis by UHPLC-QToF permitted the identification of a total of 9 carotenoid compounds and esters and 8 essential fatty acids. Untargeted analysis identified 3 new compounds (N-oxopalmitic acid, N-hydroxypalmitic acid and 10-phenyldecanoic acid) not previously found in H. pluvialis aplanospores red. Both, carotenoid compounds and essential fatty acids showed high affinity for the solvents ethanol and ethyl lactate, while fatty acids derivatives showed higher affinity for the isovolumetric ratios ethyl lactate/water and ethanol/water. At the same time, new compounds identified in microalga showed greater affinity for water as extraction solvent. The combination of green solvents together with a deep analytical characterization allowed to obtain extracts rich in a variety of bioactive compounds, whose synergistic effect opens the possibilities of new potential industrial uses.Author contributions
Conceptualization, A. O., C. G.-J. and M. L.; methodology, A. O., S. P., S. F, C. G.-J. and M. L.; formal analysis, C. G.-J. and M. L.; investigation, A. C., S. P.; writing—original draft preparation, A. C.; writing—review and editing, S. F., C. G.-J. and M. L.; supervision, C. G.-J. and M. L.; project administration, C. G.-J. and M. L.; funding acquisition, A. O, S. F. M. L.Funding
This work was supported by project EQC2018-005011-P (Ministry of Science, Innovation and Universities, Spain). The authors belongs to CRETUS Institute and CRETUS Strategic Partnership (ED431E 2018/01) co-funded by FEDER (UE).Conflicts of interest
The authors declare no conflict of interest.Acknowledgements
A. C. acknowledges CRETUS Partnership for his research contract.Notes and references
- Â. P. Matos, in Proteins: Sustainable Source, Processing and Applications, ed. C. Galanakis, Elsevier, London, United Kingdom, 1st edn, 2019, pp. 63–96 Search PubMed.
- S. Pereira Bouzas, PhD thesis, University of Santiago de Compostela, Spain, 2019.
- A. Solovchenko and K. Chekanov, in Production of Biomass and Bioactive Compounds Using Bioreactor Technology, ed. K.-Y. Paek, H. N. Murthy and J.-J. Zhong, Springer, Dordrecht, Netherlands, 1st edn, 2014, pp. 63–91 Search PubMed.
- J. Liu, J. van der Meer, L. Zhang and Y. Zhang, in Microalgal Production for Biomass and High-Value Products, ed. Stephen P. Slocombe and John R. Benemann, CRC Press, Florida, US, 1st edn, 2016, pp. 267–293 Search PubMed.
- G. Panis and J. R. Carreon, Algal Res., 2016, 18, 175–190 CrossRef.
- M. C. Ruiz-Domínguez, C. Espinosa, A. Paredes, J. Palma, C. Jaime, C. Vílchez and P. Cerezal, Molecules, 2019, 24, 1–17 CrossRef PubMed.
- T. O. Butler, G. J. McDougall, R. Campbell, M. S. Stanley and J. G. Day, Biology, 2018, 7, 1–15 Search PubMed.
- M. M. R. Shah, Y. Liang, J. J. Cheng and M. Daroch, Front. Plant Sci., 2018, 7, 531 Search PubMed.
- A. Molino, A. Iovine, P. Casella, S. Mehariya, S. Chianese, A. Cerbone, J. Rimauro and D. Musmarra, Int. J. Environ. Res. Public Health, 2018, 15, 2436 CrossRef CAS PubMed.
- S. Sasidharan, Y. Chen, D. Saravanan, K. M. Sundram and L. Yoga Latha, Afr. J. Tradit., Complementary Altern. Med., 2011, 8, 1–10 CrossRef CAS.
- M. Garcia-Vaquero, V. Ummat, B. Tiwari and G. Rajauria, Mar. Drugs, 2020, 18, 172–187 CrossRef PubMed.
- A. Molino, J. Rimauro, P. Casella, A. Cerbone, V. Larocca, S. Chianese, D. Karatza, S. Mehariya, A. Ferraro, E. Hristoforou and D. Musmarra, J. Biotechnol., 2018, 283, 51–61 CrossRef CAS PubMed.
- R. Gallego, K. Arena, P. Dugo, L. Mondello, E. Ibáñez and M. Herrero, Anal. Bioanal. Chem., 2020, 412, 589–599 CrossRef CAS PubMed.
- M. Bueno, R. Gallego, J. A. Mendiola and E. Ibáñez, in Grand Challenges in Algae Biotechnology, ed. A. Hallmann and P. H. Rampelotto, Springer, Cham, Switzerland, 2019, pp. 399–425 Search PubMed.
- H. M. Amaro, I. Sousa-Pinto, F. X. Malcata and A. C. Guedes, in Microalgae-Based Biofuels and Bioproducts: From Feedstock Cultivation to End-Products, ed. R. Muñoz and C. Gonzalez-Fernandez, Woodhead Publishing, Duxford, United Kingdom, 1st edn, 2017, pp. 369–400 Search PubMed.
- C. Garcia-Jares, M. Sanchez-Nande, J. P. Lamas and M. Lores, Bioengineering, 2017, 4, 87–97 CrossRef PubMed.
- D. Wianowska and M. Gil, TrAC, Trends Anal. Chem., 2019, 112, 29–51 CrossRef CAS.
- Polyphenol Extract From White-Grape Residue, Spain Pat., ES2443547B2, Universidade de Santiago de Compostela, 2018.
- G. Jin, Y. Liu, S. Xue, Y. Meng, J. Yan, F. Yang, Z. Guo, J. Zhu and X. Liang, Chromatographia, 2019, 82, 1593–1601 CrossRef CAS.
- A. del Pilar Sánchez-Camargo, N. Pleite, M. Herrero, A. Cifuentes, E. Ibáñez and B. Gilbert-López, J. Supercrit. Fluids, 2017, 128, 112–120 CrossRef.
- S. Santoyo, M. Plaza, L. Jaime, E. Ibañez, G. Reglero and F. J. Señorans, J. Agric. Food Chem., 2010, 58, 8522–8527 CrossRef CAS PubMed.
- M. Lores, M. Pájaro, M. Álvarez-Casas, J. Domínguez and C. García-Jares, Talanta, 2015, 140, 134–142 CrossRef CAS.
- K. H. Yim, M. Stambouli and D. Pareau, in Green Chemistry and Sustainable Technology, Springer, Heidelberg, Berlin, 2014, pp. 221–235 Search PubMed.
- C. Ruttkies, E. L. Schymanski, S. Wolf, J. Hollender and S. Neumann, J. Cheminf., 2016, 8, 3 Search PubMed.
- S. Wolf, S. Schmidt, M. Müller-Hannemann and S. Neumann, BMC Bioinf., 2010, 11, 148 CrossRef PubMed.
- S. Boussiba, Physiol. Plant., 2000, 108, 111–117 CrossRef CAS.
- V. V. De Rosso and A. Z. Mercadante, J. Agric. Food Chem., 2007, 55, 5062–5072 CrossRef CAS PubMed.
- M. Calderón-Santiago, F. Priego-Capote and M. D. Luque De Castro, Anal. Chem., 2014, 86, 7558–7565 CrossRef PubMed.
- J. J. Ríos, M. Roca and A. Pérez-Gálvez, J. Anal. Methods Chem., 2015, 2015, 1–10 CrossRef PubMed.
- P. Otero, S. K. Saha, J. M. Gushin, S. Moane, J. Barron and P. Murray, Anal. Bioanal. Chem., 2017, 409, 4659–4667 CrossRef CAS PubMed.
- C. Syms, in Encyclopedia of Ecology, John Wiley & Sons, Inc., Hoboken, NJ, USA, 2nd edn, 2018, pp. 566–573 Search PubMed.
- X. Qiao, L. Yang, Q. Gao, S. Yang, Z. Li, J. Xu and C. Xue, J. Sci. Food Agric., 2019, 99, 2226–2235 CrossRef CAS PubMed.
- M. C. P. P. Reis-Mansur, J. S. Cardoso-Rurr, J. V. M. A. Silva, G. R. de Souza, V. d. S. Cardoso, F. R. P. Mansoldo, Y. Pinheiro, J. Schultz, L. B. Lopez Balottin, A. J. R. da Silva, C. Lage, E. P. dos Santos, A. S. Rosado and A. B. Vermelho, Sci. Rep., 2019, 9, 1–14 CrossRef CAS.
- M. Hadjipieri, E. C. Georgiadou, A. Marin, H. M. Diaz-Mula, V. Goulas, V. Fotopoulos, F. A. Tomás-Barberán and G. A. Manganaris, BMC Plant Biol., 2017, 17, 102 CrossRef.
- S. Rivera, F. Vilaró and R. Canela, Anal. Bioanal. Chem., 2011, 400, 1339–1346 CrossRef CAS.
- M. Rauytanapanit, K. Janchot, P. Kusolkumbot, S. Sirisattha, R. Waditee-Sirisattha and T. Praneenararat, Mar. Drugs, 2019, 17, 328–340 CrossRef CAS PubMed.
- T. Kajiwara, M. Kashibe, K. Matsui and A. Hatanaka, Phytochemistry, 1991, 30, 193–195 CrossRef CAS.
- M. Dammak, S. M. Haase, R. Miladi, F. Ben Amor, M. Barkallah, D. Gosset, C. Pichon, B. Huchzermeyer, I. Fendri, M. Denis and S. Abdelkafi, Lipids Health Dis., 2016, 15, 209 CrossRef PubMed.
- M. Schröder, H. Abdurahman, T. Ruoff, K. Lehnert and W. Vetter, J. Am. Oil Chem. Soc., 2014, 91, 1695–1702 CrossRef.
- W. Schmidt, G. Drews, J. Weckesser, I. Fromme and D. Borowiak, Arch. Microbiol., 1980, 127, 209–215 CrossRef CAS.
- W. Schmidt, G. Drews, J. Weckesser and H. Mayer, Arch. Microbiol., 1980, 127, 217–222 CrossRef CAS.
- C. Thane and S. Reddy, Nutr. Food Sci., 1997, 97, 58–65 CrossRef.
- O. Parniakov, F. J. Barba, N. Grimi, L. Marchal, S. Jubeau, N. Lebovka and E. Vorobiev, Innovative Food Sci. Emerging Technol., 2015, 27, 79–85 CrossRef CAS.
- Y. L. Kua, S. Gan, A. Morris and H. K. Ng, Sustainable Chem. Pharm., 2016, 4, 21–31 CrossRef CAS.
- B. K. Ishida and M. H. Chapman, J. Agric. Food Chem., 2009, 57, 1051–1059 CrossRef CAS PubMed.
- C. S. M. Pereira, V. M. T. M. Silva and A. E. Rodrigues, Green Chem., 2011, 13, 2658–2671 RSC.
- The Dial Corporation, Disinfecting and Antimicrobial Compositions, US Pat., 20060171978A1, The Dial Corporation, 2006.
- N. V. Bhagavan and C.-E. Ha, in Essentials of Medical Biochemistry, ed. N. V. Bhagavan and C.-E. Ha, Elsevier, London, United Kingdom, 2nd edn, 2015, pp. 11–20 Search PubMed.
- A. M. Brzozowska, F. Mugele and M. H. G. Duits, Colloids Surf., A, 2013, 433, 200–211 CrossRef CAS.
Footnote |
| † Electronic supplementary information (ESI) available. See DOI: 10.1039/d0ra04378h |
| This journal is © The Royal Society of Chemistry 2020 |

