 Open Access Article
High-throughput in-focus differential interference contrast imaging of three-dimensional orientations of single gold nanorods coated with a mesoporous silica shell†
Geun Wan Kimab,
Seokyoung Yoonc,
Jung Heon Lee *cd and
Ji Won Ha
 *ab
*ab
aDepartment of Chemistry, University of Ulsan, 93 Daehak-ro, Nam-gu, Ulsan 44610, Republic of Korea. E-mail: jwha77@ulsan.ac.kr; Fax: +82 52 712 8002; Tel: +82 52 712 8012
bEnergy Harvest-Storage Research Center (EHSRC), University of Ulsan, 93 Daehak-ro, Nam-gu, Ulsan 44610, Republic of Korea
cSKKU Advanced Institute of Nanotechnology (SAINT), Research Center for Advanced Materials Technology, Sungkyunkwan University (SKKU), Suwon, 16419, Republic of Korea. E-mail: jhlee7@skku.edu; Fax: +82 502 302 1918; Tel: +82 31 290 7404
dSchool of Advanced Materials Science and Engineering, Sungkyunkwan University (SKKU), Suwon, 16419, Republic of Korea
First published on 12th August 2020
Abstract
Plasmonic gold nanorods (AuNRs) have been widely applied as optical orientation probes in many biophysical studies. However, characterizing the various three-dimensional (3D) orientations of AuNRs in the same focal plane of the objective lens is a challenging task. To overcome this challenge, we fabricated single AuNRs (10 nm × 30 nm) coated with either an elliptical or spherical mesoporous silica shell (AuNRs@mSiO2). Unlike bare AuNRs and elliptical AuNRs@mSiO2, spherical AuNRs@mSiO2 contained randomly oriented AuNR cores in 3D space, which could be observed on the same focal plane within a single frame by differential interference contrast (DIC) microscopy. The spherical AuNRs@mSiO2 thus achieved high-throughput detection. The proposed approach can overcome the limitations of the current gel-matrix method, which requires vertical scanning of the embedded AuNRs to capture different focal planes.
Introduction
Direct visualization and tracking with optical probes at high spatial and temporal resolution can reveal the complex dynamics and interactions in chemical and biological processes.1–3 By investigating the rotational dynamics of nanoprobes, we can uncover a new dimension of information that is hidden in conventional three-dimensional (3D) single-particle tracking. Recently, plasmonic anisotropic gold nanorods (AuNRs) have been popularized as orientation probes in single-particle rotational tracking because their shapes induce anisotropic optical properties,4–6 large scattering and absorption cross-sections,7 high photostability,8 and excellent biocompatibility.9–11Using polarization-based in-focus and defocused orientation imaging methods, researchers have determined the 3D orientations of individual AuNRs under dark-field (DF) microscopy,5,12,13 differential interference contrast (DIC) microscopy,6,14,15 and total internal reflection scattering (TIRS) microscopy.16,17 Recently, interference-based DIC microscopy has detected the fast rotational motions of AuNRs with high temporal and spatial resolution in dynamic environments, such as complicated living cells. DIC microscopy is insensitive to the light scattered from the surrounding cellular components and maintains its high-throughput capability in live cell imaging. Sensitivity to scattered light is the main drawback of scattering-based DF and TIRS microscopes.4,6
Despite the recent advances in single-particle rotational tracking techniques, depositing and characterizing AuNRs with random 3D orientations on a glass slide on the same focal plane for DIC microscopy is a challenging task. Vertical scanning by the agarose gel-matrix method (or polyvinyl alcohol-matrix method) has characterized the out-of-plane spatial orientations of single AuNRs embedded with random 3D spatial distributions in a gel matrix.4 However, DIC microscopy can determine only the 3D orientations of the AuNRs on different focal planes as the sample is scanned along the z-axis.
In this study, we demonstrate that when deposited on a glass slide, single AuNRs (10 nm × 30 nm) inside a spherical mesoporous silica shell (AuNRs@mSiO2) randomly orient on the same focal plane in 3D space.11,18 Therefore, DIC microscopy can characterize the random orientations of single AuNRs@mSiO2 with high-throughput on the same focal plane within a single frame. We demonstrate that DIC polarization anisotropy can effectively resolve the azimuthal angle φ of the AuNR cores inside the spherical silica shell. In comparison to the previous work using defocused DF microscopy based on a pattern matching method, DIC microscopy can provide faster and more accurate angular information of spherical AuNRs@mSiO2 without sacrificing the much reduced signal intensity.18
Experimental
Materials and chemicals
L-Ascorbic acid, silver nitrate (AgNO3), sodium borohydride (NaBH4), sodium hydroxide (NaOH), 2,6-dihydroxybenzoic acid, tetraethyl orthosilicate (TEOS), gold chloride trihydrate (HAuCl4·3H2O), cetyltrimethylammonium bromide (CTAB) were obtained from Sigma-Aldrich (St Louis, MO, USA). Gold nanorods (AuNRs, 25 nm × 73 nm) were purchased from Nanopartz (Loveland, CO, USA). Deionized water (18.2 MΩ cm) was prepared by a Sartorius Arium®Pro Ultrapure water system. All glassware was cleaned using aqua regia. Special care has to be taken when researchers handle aqua regia.Characterization of the synthesized AuNRs@mSiO2
We used transmission electron microscope (TEM, JEL-2100F, JEOL, Japan) and scanning electron microscope (SEM, JSM-6500, JEOL, Japan) to characterize the AuNRs@mSiO2. The TEM images were analyzed based on a custom MATLAB script previously reported with some subroutine implemented in the image processing toolbox of MATLAB. Furthermore, a Varian Carry 300 UV-vis spectrometer (Agilent Technologies) was used to characterize the ensemble extinction spectrum of the AuNRs@mSiO2.Sample preparation for single particle study
The samples for single particles studies were prepared as follows: the colloid solution was first diluted with 18.2 MΩ pure water to a proper concentration. The diluted solution was then sonicated for 10 min at room temperature. Samples were prepared by drop casting the diluted AuNRs@mSiO2 solution on pre-cleaned glass slides. Subsequently, a 22 mm × 22 mm No. 1.5 coverslip (Corning, NY, USA) was placed on the glass slide. Throughout all of the experiments, the concentration of AuNRs@mSiO2 deposited on the glass slide surface was maintained at about 1 μm−2 to facilitate single particle characterization without inter-particle interaction and LSPR coupling.Differential interference contrast microscopy
We performed DIC microscopy using a Nikon inverted microscope (ECLIPSE Ti-U, JAPAN). DIC microscopy consists of a set of two Nomarski prisms, two polarizers, and a quarter-waveplate. We illuminated the samples by an oil immersion condenser with a NA of 1.4. The DIC signals coming from the sample were collected by a Plan Apo oil-immersion objective (100×, NA = 1.4). To obtain DIC images with high quality, we used an Andor EMCCD camera (iXon Ultra 897, UK). We then used Image J and Matlab to analyze the collected DIC images.Results and discussion
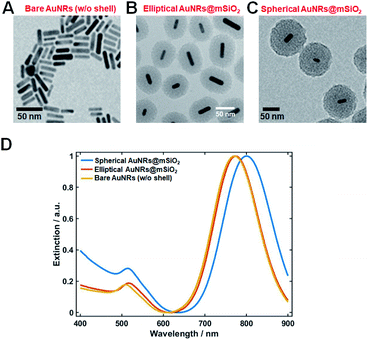
Elliptical and spherical AuNRs@mSiO2 particles were fabricated by a slightly modified literature protocol,19,20 and were structurally characterized by TEM and SEM. Fig. 1A is a TEM image of the synthesized AuNRs with an average length and diameter of 30 nm and 10 nm, respectively. Elliptical (thin shell) or spherical (thick shell) mesoporous silica was coated on the AuNRs by the above-mentioned modified method (Fig. 1B and C).19,20 The elliptical mesoporous silica shell was 31.7(±4.8) nm thick, while the spherical mesoporous silica shell was 52.7(±5.7) nm thick (Fig. 1B and C). Additional TEM images showing many nanoparticles are provided in Fig. S1.† We then obtained the UV-vis absorption spectra of the AuNRs and AuNRs@mSiO2 (elliptical and spherical) dispersed in water (Fig. 1D). The longitudinal surface plasmon resonance (LSPR) peaks of the naked AuNRs and the spherical AuNRs@mSiO2 appeared at 769 and 794 nm, respectively. The red shift in the latter LSPR peak was caused by the mesoporous silica shell coating.Thus far, AuNRs have been randomly oriented in 3D space by embedding them in agarose gel matrix. The 3D orientations must then be determined on successive focal planes by scanning along the z-axis (Fig. S2†). However, the gel-matrix method is time consuming, cumbersome, and inconvenient for a 360° rotational study. Furthermore, LSPR coupling can occur among adjacent AuNRs, causing a spectral shift in single-particle characterization.
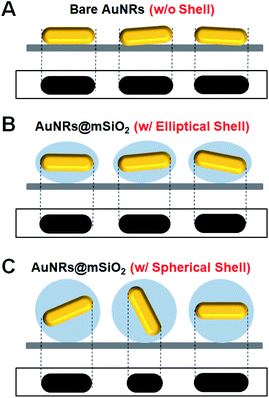
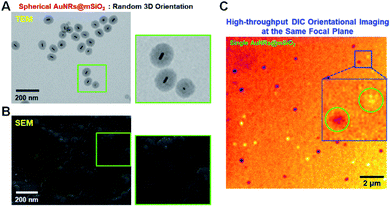
In our spherical AuNRs@mSiO2 fabrication, LSPR coupling between two adjacent AuNRs is prevented by the outer shell, which is advantageous for single-particle spectroscopic characterization (Fig. 1C and S1C†). However, the silica shell can block the interaction of AuNRs with the medium. Furthermore, during the drop-casting for sample preparation, the naked AuNRs were deposited parallel to the glass slide, so were tilted by almost the same angle from the glass surface (see Fig. 2A). The elliptical AuNRs@mSiO2 with the thin silica shell were also tilted at very similar angles, with low degrees of freedom in the z-direction (Fig. 2B). In contrast, within the silica shells of the spherical AuNRs@mSiO2 deposited on the glass slide, the AuNR cores were randomly oriented on the same focal plane (Fig. 2C), with different projected lengths. As shown in Fig. 1C and 3A, the 3D orientations of the AuNRs in the shells influenced the projected lengths of the AuNRs. This situation completely differed from that of bare AuNRs (Fig. 1A and S1A†). The random 3D orientations of many AuNRs in the silica shell was further verified by SEM (see Fig. 3B and S3†).
We then investigated the spatial orientations of single AuNR (10 nm × 30 nm) cores in the silica shell by DIC microscopy. The experimental setup of the single-particle microscopy and spectroscopy is presented in Fig. S4.† As an interferometry-based technique, DIC microscopy resolves the optical path difference between two orthogonally polarized beams (B1 and B2, designating the bright and dark axes, respectively) separated by a Nomarski prism (Fig. S5†). The azimuthal angle (φ) and polar angle (θ) of the AuNR core are defined in Fig. S6.† The DIC captured single spherical AuNRs@mSiO2 particles in the same focal plane at their LSPR wavelength (i.e., at 750 nm) (Fig. 3C). It should be noted that in DIC microscopy, the different bright and dark patterns correspond to different in-plane orientations of the AuNR cores deposited on the glass slide. Therefore, we could achieve high-throughput, high-contrast DIC imaging of spherical AuNRs@mSiO2 particles with various orientations within a single image frame.
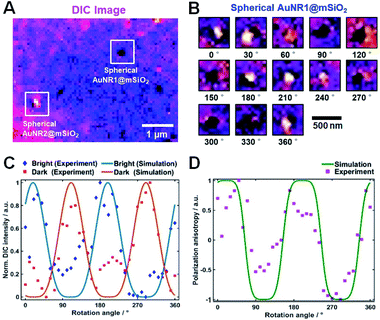
The polarization dependency of the spherical AuNRs@mSiO2 imaging was measured at their LSPR wavelength (750 nm) on a rotational stage moved from 0° to 360° at 10° increments. Fig. 4A is a DIC image of two spherical AuNRs@mSiO2 particles (labelled AuNR1@mSiO2 and AuNR2@mSiO2) measured at 750 nm. As shown in Fig. 4B and S7,† the DIC images of AuNR1@mSiO2 periodically changed as the rotation angle increased. The polarization dependency of the DIC images was further confirmed in AuNR2@mSiO2 (Fig. S8†). In addition, the bright and dark intensities of AuNR1@mSiO2 were periodic functions of rotation angle and were anti-correlated at both LSPR wavelengths (769 and 794 nm), informing that when the dark intensity decreases, the bright intensity increases (Fig. 4C). In this study, the measured dark and bright values consist of the darkest and brightest pixels within a region around a particle, respectively. The bright and dark intensities at each LSPR wavelength were well fitted to sin4(φ) and cos4(φ) functions, respectively. More specifically, the orthogonally polarized bright and dark intensities of AuNR@mSiO2 are given by12,18
 | (1) |
According to eqn (1), the AuNR orientations are directly determinable from the bright and dark intensities of the polarized DIC images. In practice, however, the precision might be affected by intensity fluctuations of the light source, focus-drift in the vertical direction, and other disturbances. This limitation can be overcome by the DIC polarization anisotropy P, defined by eqn (2).6,14 The DIC polarization anisotropy P can be conveniently computed from the bright and dark intensities of AuNR@mSiO2:
 | (2) |
Next, we compared the polarization angles of the spherical AuNRs@mSiO2 and the elliptical AuNRs@mSiO2 with the thin silica shell. The polarization angles of the elliptical AuNRs@mSiO2 particles were measured at their LSPR wavelength (750 nm) on a rotational stage shifted at 10° increments from 0° to 360°. Fig. S9† shows the DIC images of the elliptical AuNR1@mSiO2 measured at their LSPR wavelength at different rotation angles. Again, the bright and dark intensities of the elliptical AuNR1@mSiO2 were periodic functions of rotational angle (Fig. S10A†), and the measured DIC polarization anisotropy values well agreed with the calculated values (Fig. S10B†). After determining the azimuthal angle φ of the elliptical AuNRs@mSiO2 by DIC polarization anisotropy, we determined their polar angles θ. As shown in Fig. 5A, the polar angles θ of the AuNR cores inside the elliptical silica shell varied between 60° and 90°. In addition, the polar angles θ of bare AuNRs without the shell also varied between 60° and 90° (Fig. S11†). However, the AuNR cores inside the spherical silica shells were distributed over a wider range (0–90°, see Fig. 5B) because more degrees of freedom, especially in the vertical direction, were available to the AuNRs in the spherical shells.
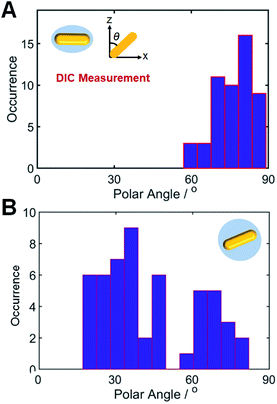 | ||
| Fig. 5 Histograms showing the polar angle (θ) distributions of (A) elliptical AuNRs@mSiO2 and (B) spherical AuNRs@mSiO2, determined from the DIC measurements. | ||
Finally, to clearly demonstrate the advantage of the spherical AuNRs@mSiO2 fabrication over the conventional gel-matrix method, we imaged tilted AuNRs (of average size 25 nm × 73 nm) embedded in a 2% agarose gel matrix. DIC images of AuNRs were obtained by scanning along the z-direction with a vertical step size of 40 nm (Movie S1†). Fig. S12† shows consecutive DIC images of the AuNRs with random 3D orientations in the gel matrix, obtained on different focal planes. The different focal planes of the AuNRs in the gel matrix are clarified in Fig. S12.† This result confirms that without vertical scanning, DIC microscopy cannot observe the random spatial orientations of the AuNRs in the standard gel-matrix embedding. In contrast, the spherical AuNRs@mSiO2 enables a high-throughput determination of the 3D orientations of the AuNR cores in the silica shell on a single focal plane of the objective; moreover, it prevents LSPR coupling among the nanoparticles.
Conclusions
In summary, the spatial orientations of single AuNRs (10 nm × 30 nm) coated with mesoporous silica shell (AuNRs@mSiO2) were observed by DIC microscopy. The silica shell prevented LSPR coupling among the AuNR cores. Unlike the bare AuNRs and elliptical AuNRs@mSiO2, spherical AuNRs@mSiO2 deposited on a glass slide allowed random 3D orientations of the AuNR cores on the same focal plane. These orientations were detected with high-throughput and high-contrast efficacy within a single frame. Our approach newly characterizes the 3D random orientations and polarization dependences of AuNRs on the same focal plane by DIC microscopy. The main limitation of the gel-matrix method, namely, the need for observing many focal planes along the z-direction, is thereby removed.Conflicts of interest
There are no conflicts to declare.Acknowledgements
This work was supported by a National Research Foundation of Korea (NRF) grant funded by the Korean government (MSIP) (No. 2018R1C1B3001154) and the grant for Bio-inspired Innovation Technology Development Project (NRF-2018M3C1B7021997) funded by the Ministry of Science and ICT. This work was also supported by a National Research Foundation of Korea (NRF) grant funded by the Korean government (MSIP) (No. 2019R1A6A1A11053838).Notes and references
- X. Zhuang, L. E. Bartley, H. P. Babcock, R. Russell, T. Ha, D. Herschlag and S. Chu, Science, 2000, 288, 2048–2051 CrossRef CAS PubMed
.
- T. Nishizaka, K. Oiwa, H. Noji, S. Kimura, E. Muneyuki, M. Yoshida and K. Kinosita, Nat. Struct. Mol. Biol., 2004, 11, 142–148 CrossRef CAS PubMed
.
- E. Toprak, J. Enderlein, S. Syed, S. A. McKinney, R. G. Petschek, T. Ha, Y. E. Goldman and P. R. Selvin, Proc. Natl. Acad. Sci. U. S. A., 2006, 103, 6495–6499 CrossRef CAS PubMed
.
- L. Xiao, J. W. Ha, L. Wei, G. Wang and N. Fang, Angew. Chem., Int. Ed., 2012, 51, 7734–7738 CrossRef CAS PubMed
.
- C. Sönnichsen and A. P. Alivisatos, Nano Lett., 2005, 5, 301–304 CrossRef PubMed
.
- J. W. Ha, W. Sun, A. S. Stender and N. Fang, J. Phys. Chem. C, 2012, 116, 2766–2771 CrossRef CAS
.
- S. Link and M. A. El-Sayed, Annu. Rev. Phys. Chem., 2003, 54, 331–366 CrossRef CAS PubMed
.
- W.-S. Chang, J. W. Ha, L. S. Slaughter and S. Link, Proc. Natl. Acad. Sci. U. S. A., 2010, 107, 2781–2786 CrossRef CAS PubMed
.
- C. J. Murphy, A. M. Gole, J. W. Stone, P. N. Sisco, A. M. Alkilany, E. C. Goldsmith and S. C. Baxter, Acc. Chem. Res., 2008, 41, 1721–1730 CrossRef CAS PubMed
.
- S. Yoon, J. Chang, N. Kwon, S. Moon, Y. Park, K. H. Han, B. Lim and J. H. Lee, BioChip J., 2019, 13, 236–242 CrossRef CAS
.
- S. Yoon, Y. Chung, J. W. Lee, J. Chang, J. G. Han and J. H. Lee, BioChip J., 2019, 13, 362–369 CrossRef CAS
.
- L. Xiao, Y. Qiao, Y. He and E. S. Yeung, Anal. Chem., 2010, 82, 5268–5274 CrossRef CAS PubMed
.
- S. Y. Lee, P. V. Tsalu, G. W. Kim, M. J. Seo, J. W. Hong and J. W. Ha, Nano Lett., 2019, 19, 2568–2574 CrossRef CAS PubMed
.
- J. W. Ha, W. Sun, G. Wang and N. Fang, Chem. Commun., 2011, 47, 7743–7745 RSC
.
- S. Y. Lee, Y. Han, J. W. Hong and J. W. Ha, Nanoscale, 2017, 9, 12060–12067 RSC
.
- J. W. Ha, K. Marchuk and N. Fang, Nano Lett., 2012, 12, 4282–4288 CrossRef CAS PubMed
.
- K. Marchuk and N. Fang, Nano Lett., 2013, 13, 5414–5419 CrossRef CAS PubMed
.
- G. W. Kim, S. Yoon, J. Lee, J. H. Lee and J. W. Ha, J. Phys. Chem. C, 2020, 124, 14279–14286 CrossRef CAS
.
- S. Yoon, B. Lee, C. Kim and J. H. Lee, Cryst. Growth Des., 2018, 18, 4731–4736 CrossRef CAS
.
- I. Gorelikov and N. Matsuura, Nano Lett., 2008, 8, 369–373 CrossRef CAS PubMed
.
Footnote |
| † Electronic supplementary information (ESI) available: Experimental details, supplementary figures and movie. See DOI: 10.1039/d0ra04704j |
| This journal is © The Royal Society of Chemistry 2020 |

