 Open Access Article
Transparent glass-ceramics for thermal management application: achievement of optical transparency and high thermal conductivity
Nobuaki Terakado *,
Toshikazu Yoshimine,
Ryusei Kozawa,
Yoshihiro Takahashi and
Takumi Fujiwara
Department of Applied Physics, Tohoku University, 6-6-05 Aoba, Aoba-ku, Sendai 980-8579, Japan. E-mail: terakado@laser.apph.tohoku.ac.jp
First published on 11th June 2020
Abstract
Oxide glass is an industrial material with advantages such as optical transparency and shaping ability of the melt, but at the same time, it is a bad conductor of heat due to its disordered structures. Therefore, heat dissipation in glass components often becomes a problem and its applications to the thermal management has been limited to use as a heat insulator. To break this mold and to apply it to fields, e.g., transparent sealing materials, for which low thermal conductive glasses and organic polymers have been conventionally used, we fabricated an MgO-dispersed glass-ceramics in our previous work. It comprises MgO crystal and glass matrix and their reflective indices are matched, leading to optical transparency and improvement in thermal conductivity. Here we investigate the atomic-scale structures in the MgO-dispersed glass-ceramics by nuclear magnetic resonance, etc. and attempt to further improve the thermal conductivity and the transparency. As a result, we show an MgO-dispersed glass-ceramic with a thermal conductivity of 3.3 W (m−1 K−1), corresponding to 300% of that of the glass matrix, high optical transparency, and glass transition. This report highlights that our strategies pave the way for development of novel transparent, functional glass-ceramics.
1. Introduction
Owing to its unique advantages, i.e., high optical transparency and shaping ability of the melt, oxide glass has been used in vessels, windows, and ornaments since ancient times,1 and moreover, in recent years, functional glasses such as optical fibers in telecommunication and the screen protector glass in mobile devices have been widespread.1,2 Here, its optical transparency and shaping ability of the melt originate from the intrinsic glass structure which are isotropic, boundaryless, and disordered.1 Among them, the structural disorder inevitably disturbs propagation of atomic vibrations in the glass.3 Thus, in principle, the glass is a bad conductor of heat, and accordingly, heat dissipation in glass components often become a problem4 and it is not very useful for heat removal. In other words, glass application to the thermal management has been limited to use as a heat insulator.However, if the glass attains high thermal conductivity, we can not only solve the problems on heat dissipation in the glass components but also pave the way for thermal management applications of the glass, e.g., prevention of heat crack and malfunction in the glass components and application to sealing materials for high-power light-emitting devices requiring high thermal conductivity together with transparency and shaping ability. Here, we emphasize that the glass has advantages of high chemical, light, and heat resistances,1 compared to the conventional sealing materials such as organic polymers. In addition, from the viewpoint of affective engineering, we may be able to provide the glass with a high-class feeling, which can be improved with an increase in thermal conductivity (accurately, thermal effusivity) of materials.
To achieve that, we must leave the conventional, homogeneous glass, because it is impossible that the glass itself possesses high thermal conductivity, transparency, and shaping ability of the melt, at the same time. Instead, we have proposed a fabrication method of a transparent glass-ceramic comprising glass matrix and large amount of high thermal conductive crystal with a large size, where we take two strategies as follows:5
One is oversupply of a reagent which is expected to precipitate as the high thermal conductive crystal; generally, composition of glass batches is designed so that no crystal is precipitated during quenching. Conversely, we dare to oversupply the reagent so that its amount is out of a glass-forming range and the required crystal is precipitated. This concept corresponds to the Frozen sorbet method proposed by Nakanishi et al.6 in terms of the oversupply of reagents. The incorporation method7 and the crystallization method8–10 are well known as ones to provide functionality for glass by dispersing crystal; compared to the two conventional methods, the advantages of the oversupply method are as follows: one is that the process is as simple as the conventional melt-quenching method, meaning that the extra processes, i.e., crystal–glass mixing process or heat treatment are not needed. The other is that precipitation of large-size crystals is anticipated, depending on preparation conditions, as shown in the present work.
The other strategy is refractive index matching between the precipitated crystal and the glass matrix through a batch composition design, enabling suppression of light scattering at interfaces between the two phases, i.e., achievement of “optical stoichiometry”.5,8 Here, we select MgO as the oversupplied reagent, because MgO crystal yields a high thermal conductivity of ∼50 W (m−1 K−1)11 and high transparency in the region of UV-Vis-NIR,12 and additionally the crystal exhibits optical isotropy as well as the glass due to belonging to cubic crystal system and a small refractive index of ∼1.7 (ref. 13) compared with the other transparent, high thermal conductive crystals, both of which help the index matching with the glass matrix. We expect that the present method and concept are also expanded to development of other transparent oxide glasses having any functionalities such as high fracture toughness.
On the basis of these strategies, we fabricated a glass-ceramic comprising MgO crystal and La2O3–B2O3–SiO2–MgO glass matrix and demonstrated that it shows a thermal conductivity of 1.6 W (m−1 K−1), which is high for tentative multi-component oxide glasses, and a visible transparency of 60% for the sample with a thickness of 0.21 mm.5 However, its atomic-scale structure and mechanism of the MgO precipitation have been unclear and its properties are not high enough for practical use. Therefore, we investigate the structures by nuclear magnetic resistance, etc. and attempt to improve the thermal conductivity and the transparency. Finally, we present an MgO-dispersed glass-ceramic exhibiting a high thermal conductivity of 3.3 W (m−1 K−1), high optical transparency, and glass transition and discuss structural designs for higher thermal conductivity by prediction of the effective thermal conductivity based on an effective medium approximation model.
2. Experimental section
2.1 Sample preparation
The batch compositions of samples are listed in Table 1. Samples are hereinafter noted like A[53] with alphabetical names and MgO content as shown in Table 1. First, we used La2O3–B2O3–SiO2–MgO system. The process leading to this glass system is described in our previous work.5 In this study, we also used Nb2O5, working as the index enhancer in glass,14 for increase in and precise control of the refractive index. The samples were synthesized as follows:5 reagents for these five contents, La2O3 (purity: 99.99%), Nb2O3 (99.99%), B2O3 (99.9%), SiO2 (99.9%), and MgO (99.99%), purchased from Kojundo Chemical Laboratory Co., Ltd., were weighed and mixed to obtain the compositions of samples (A–D) in Table 1. Before weighing, the MgO reagent was dehydrated by heating at 700 °C for 2 h in an electric furnace. The batches were placed in a platinum crucible and melted in air by using an electric furnace with a heating rate of 10 °C min−1. The melting temperature and time is shown in Table 1. The melts were poured onto a steel plate maintained at 200 °C and immediately quenched by covering with a metal plate, fixing the sample thicknesses at 2 mm with metal jigs.| Sample | La2O3 | Nb2O5 | B2O3 | SiO2 | MgO | T (°C) | t (h) | Tg (°C) | D (mm2 s−1) | K (W (m−1 K−1)) | n633 | T633 (%) |
|---|---|---|---|---|---|---|---|---|---|---|---|---|
| A | 13 | 0 | 24 | 10 | 0–43 | 1400 | 1 | 653–675 | — | — | — | — |
| 53 | 680 | 0.42 | — | 1.723 | 85 | |||||||
| 60 | 681 | 0.46 | — | — | 60 | |||||||
| 74 | 684 | 0.53 | — | — | 30 | |||||||
| B | 13 | 0 | 24 | 10 | 74 | 1650 | 4 | — | 0.70 | — | — | 54 |
| 110 | — | 0.88 | — | — | — | |||||||
| 140 | — | 1.6 | — | — | 20 | |||||||
| C | 8.2 | 5.0 | 24 | 10 | 90 | 1400 | 1 | — | — | — | — | — |
| 77 | — | — | — | 1.740 | — | |||||||
| D | 8.2 | 4.3 | 24 | 10 | 77 | 1400 | 1 | 688 | 0.43 | 1.1 | 1.733 | 85 |
| 170 | 1650 | 4 | 688 | 1.2 | 3.3 | — | 70 | |||||
| MgO | — | — | — | — | — | — | — | — | 15 | 50 | 1.735 | — |
2.2 Structural investigation
The structural and optical investigations of the samples at a temperature of ∼25 °C were conducted. For both the as-quenched and powdered samples, their X-ray diffraction (XRD) patterns were recorded with an apparatus (New D8 Advance, Bruker) using CuKα radiation and θ–2θ configuration to check the presence of MgO crystal and the glass matrix. The glass transition temperature Tg was determined using pieces with a size of a few mm in broken samples by differential thermal analysis (DTA; TG8120, Rigaku) at a heating rate of 10 °C min−1. For the pieces, the local coordination states of B and Si, whose oxides are expect to work as network former in glass, were determined from the 11B and 29Si magic angle spinning nuclear magnetic resonance (MAS NMR; ECA-600 and ECA-300 for 11B and 29Si, respectively, JEOL-Resonance). The frequency, the spin rate, the pulse delay, and the field intensity for 11B (29Si) were 192.56 (59.71) MHz, 15 (7.5) kHz, 30 (200) s, and 14.1 (7.0) T, respectively, unless otherwise noted. For the samples whose one side surfaces were mirror-polished by 0.5 mm, the refractive indices at wavelengths of 405, 633, and 829 nm were determined with a prism coupler (Model 2010, Metricon). For the samples with a thickness of 0.35 mm whose both surfaces were mirror-polished, the transmittance optical microscopy was performed and the optical transmittance was measured by means of a UV-Vis-NIR spectrophotometer (UV-3600, Shimadzu).2.3 Thermal diffusivity and conductivity
The out-of-plane thermal diffusivity D (mm2 s−1) of the 0.35 mm-thick samples was measured with a temperature wave analyzer (Mobile 1u, ai-Phase Co.). For a part of the samples, the out-of-plane thermal conductivity K (W (m−1 K−1)) was calculated using the equation K = ρCD,3 where the density ρ (g cm−3) and the specific heat C (J (g−1 K−1)) were determined by the Archimedes method and differential scanning calorimetry (DSC; 3500 Sirius, NETZSCH), respectively. The DSC measurements were carried out using the pieces.3. Results and discussions
3.1 XRD and optical properties
Fig. 1a shows the XRD patterns of the as-quenched A[53, 60, 74]. A[53] shows a halo pattern with no sharp peaks, indicating that it is amorphous and/or has no crystals with enough amount and size. The same is true for A[0–43] (not shown). A[60, 74] show the halo patterns and two sharp peaks assigned to {111} and {200} planes of cubic MgO crystal, where the 111 peak intensity is enhanced and the 220 peak is negligible, compared to the powder pattern of cubic MgO crystal. On the other hand, the XRD patterns in powdered samples (Fig. 1b) has a different behavior from the as-quenched ones: we see the halo patterns in all the samples, but A[53], A[60], and A[74], respectively, show no sharp peak, the small peaks due to MgO crystal, and the noticeable peaks corresponding to the powder pattern of MgO crystal. These results for both types of the samples can be interpreted as follows: MgO content is approximately saturated in A[53]. When the MgO content exceeds ∼53, the excess MgO prefers to precipitate as <111>-oriented MgO crystals at the surface, where the <111>-oriented nucleation may be involved. Such oriented nucleation has been reported15 in the surface crystallized glasses, but the origin of our result which provides the enhancement of the 111 peak and the invisibility of the 220 peak has been unclear at present. Further addition of MgO promotes bulk nucleation and growth of MgO crystals below the oriented layer at the surface. This picture seems consistent with the results of optical microscopy in ∼1 mm depth areas of the as-quenched A[0, 53, 60, 74] (Fig. 2), i.e., we see optical homogeneity in A[0, 53]; on the other hand, in A[60, 74], we see heterogeneous structures wherein the polyhedral particles with a size of ∼10 μm, which can be assigned to MgO crystal,5 are precipitated. Here, we emphasize that the particles are anything but undissolved reagent because we found that the particle size of the MgO reagent is of ∼1 μm. Structural investigation by cross-sectional scanning/transmission electron microscopy to clarify orientation of the bulk nucleation and the mechanism of the surface (bulk) oriented nucleation will be a future work.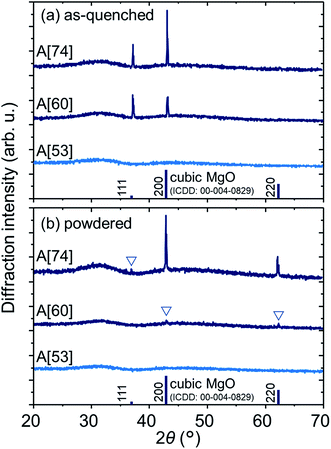 | ||
| Fig. 1 XRD patterns of (a) as-quenched and (b) powdered A[53, 60, 74]. The powder pattern of MgO crystal is also shown. | ||
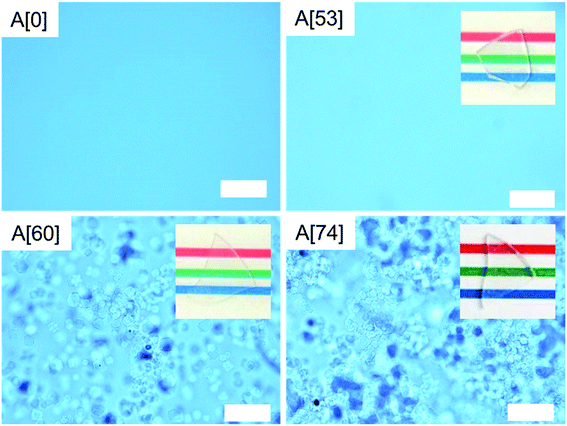 | ||
| Fig. 2 Optical microscopic images in ∼1 mm depth areas of the ∼0.35 mm-thick A[0, 53, 60, 74]. The white scale bars correspond to 100 μm and the photos of the samples are inset. | ||
As shown in Table 1, A[53], approximated to the MgO-saturated glass, possesses a thermal diffusivity D of 0.42 mm2 s−1, a refractive index n633 of 1.723, and an optical transmittance T633 of 85%. As for A[74], D is improved up to 0.53, which is clearly ascribed to the precipitation of MgO crystal (A[74] in Fig. 2), but T633 is reduced to 30%. This reduction is due to the light scattering at interfaces between the MgO crystals and the glass matrix, when the difference in n633 between the two phases is estimated to be ∼0.012 (Table 1). This is consistent with the fact that we can clearly distinguish between the two phases in the optical microscopy.
3.2 MAS-NMR and glass transition
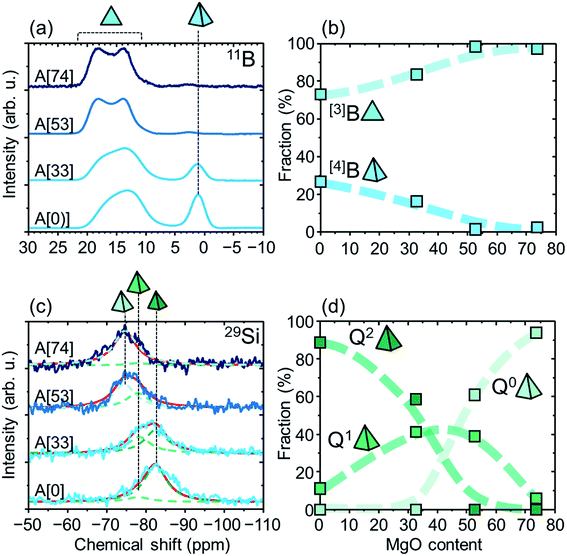
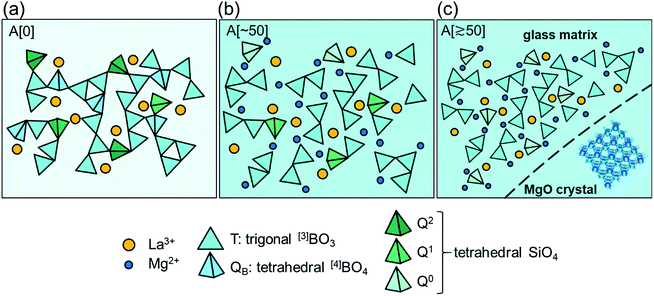
We first note that the as-quenched samples are used for the MAS-NMR and DTA measurements. This is not problematic at all, although the as-quenched samples show the different XRD patterns between the surface and the others (Fig. 1). This is because the thickness of the surface area was found to be thinner than ∼1 μm by cross-sectional optical microscopy and by considering a spatial resolution for the microscopy and it is negligible compared with the total volume fraction, meaning that NMR spectra and DTA curves dominantly yield information in the areas except for the surfaces.Fig. 3a shows the 11B MAS NMR spectra of A[0, 33, 53, 74]. We see two bands at chemical shifts of 10–20 and ∼0 ppm, which are assigned to tri- and tetra-coordinate boron atoms, [3]B and [4]B, respectively.16–18 By addition of MgO, the [4]B band intensity decreases, and the [3]B band seems to be moved to a higher chemical shift side together with broadening and deformation. This behavior is known to originate from a second-order quadrupole interaction,16–18 and particularly the chemical shift reflects degree of connectivity between trigonal BO3 units (see Fig. 5 regarding schematics of the units per species), i.e., number of bridging oxygen atoms and whether the units form boroxol ring or not:16,18 for A[0], the shoulder at ∼16 ppm and the peak at ∼13 ppm can originate from T3(ring) and T3 where Tn and Tn(ring) denote trigonal BO3 units having n bridging oxygen atoms and ones forming the boroxol ring, respectively.16,18 In addition, A[53, 74] show the notable peak around 18 ppm, which are attributable to T1, T2(ring), and T2. In short, the addition of MgO promotes decrease in connectivity, i.e., formation of disconnected or isolated BO3 units from tetrahedral BO4 units, QB. Fig. 3b shows MgO content dependences of the fractions of [3]B and [4]B. Here, we assume that the fractions are proportional to the integrated areas of the bands, which are obtained by fitting the spectra with Gaussian–Lorentzian mixed functions by means of the Dmfit program.19 The fractions of [3]B and [4]B decreases and increases, respectively, by the addition of MgO. At ∼50 MgO, around which MgO crystal begins to precipitate, and over, the fraction of [3]B becomes dominant.
The 29Si MAS NMR spectra are shown in Fig. 3c. The spectra can be decomposed with the three peaks at −75, −78, and −83 ppm. These peaks can be assigned to Q0, Q1, and Q2 species,20 where Qn denotes tetrahedral SiO4 units having n bridging oxygen atoms. Fig. 3d shows the fractions of the Qn species (n = 0, 1, 2), obtained in the same way for those of [3]B and [4]B, as a function of MgO content. Roughly, the average n decreases by the addition of MgO: at the regions lower than ∼30 MgO and higher than ∼50 MgO, the Q2 and Q0 species are dominant, respectively, and at the intermediate region, Q1 species exists. Although there may be a little concern on the assignment of Qn, the addition of MgO clearly causes a decrease in connectivity of tetrahedral SiO4 units.
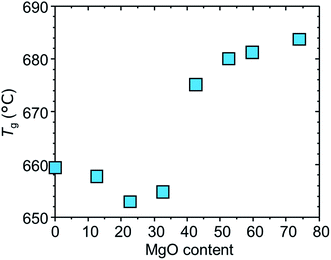
Fig. 4 shows the glass transition temperature as a function of MgO content. We see that the value slightly decreases by the addition of MgO in the range of 0–30 MgO and jumps up at 40–50 MgO, and become approximately invariant at >50 MgO. Roughly, the NMR and the DTA results mean that notable structural changes occur around the MgO-saturated composition.
3.3 Structural model
On the basis of these results, we propose a tentative structural model for samples A. Fig. 5a depicts a schematic illustration of A[0]. Here, A[0] has been found to form a transparent, homogeneous glass (Fig. 1 and 2). This fact is consistent with the result in a previous report,21 i.e., the composition of 13La2O3–24B2O3–10SiO2 exits in the transparent glass forming region for the ternary system (Fig. 1 and 3 in ref. 21). The value of Tg for A[0] was ∼660 °C in Fig. 4, which seems plausible compared to that of a sample with the similar composition, ∼680 °C (sample A4 in ref. 21). The slight difference in Tg can be attributed to the difference in glass preparation conditions such as melting temperature. From the results of MAS-NMR, we infer that the species of T3, T3(ring), QB, and Q2 dominantly form the glass network and La3+ is uniformly distributed to compensate charge balance (Fig. 5a). The addition of MgO causes the formation of the disconnected or isolated T species from the QB one and the disconnection of the bridging Q2 ones, leading to a decrease in viscosity accompanied by the decrease in glass transition temperature (Fig. 4) in the range of 0–40 MgO. The steep increase in Tg around 40 MgO (Fig. 4), which has been reported in our previous study,5 may be attributable to suppression of structural relaxation of the glass network, i.e., high content of MgO gives rise to an increase in viscosity. Fig. 5b corresponds to the structure for the MgO-saturated glass. The sample still forms the transparent glass, despite of high content of MgO (Fig. 2). Here, neglecting SiO2 content, the composition of 13La2O3–24B2O3–53MgO seems to be out of the glass forming region for the ternary system,22 although we cannot discuss the details because the preparation conditions differ. However, we consider that the glass forming in the present samples can be due to the presence of SiO2, which is consistent with the picture that the added MgO has partially modified the bridging Q2 species (Fig. 5b). At this composition, we should focus on the following atomic-scale structural changes: the disappearance of QB and Q2 species and the appearance of Q0 species (Fig. 3b and d). This means that the modification of QB and Q2 species by the added MgO is completed, leading to the MgO-saturated glass. Considering that the fraction of Q0 species still increases by the further addition of MgO exceeding ∼50 MgO (Fig. 3d), it is plausible that partial fraction of the excess MgO modifies the Q1 species into Q0 ones, and the majority of the excess MgO loses any species to modify and accordingly aggregated and precipitated as MgO crystal (Fig. 5c). The approximately invariant Tg at 50–80 MgO means that the structure of the glass matrix is uniquely determined in the range.3.4 Effects of melting temperature and time
We investigate impacts of melting temperature T and time t on the MgO precipitation for improvement of T633. As described above, the low optical transmittance T633 in A[74] (Table 1) is attributable to the presence of the small MgO crystals causing the large interfacial area and the light scattering therein. On the basis of our model, the atomic-scale structure of glass matrix above the MgO-saturated composition seems to be unique, indicating that the precipitation morphology of the excess MgO dominates the properties. Accordingly, we need large-size MgO crystals for improvement of T633. To achieve that, high-temperature and long-time melting may be suitable, because we expect that a decrease in the quenching speed and uniform distribution of MgO in melt, induced by the high-temperature and long-time melting, respectively, causes an increase in the size of MgO crystal.Thus, we set T and t for 1650 °C and 4 h, respectively, and we found that T633 is improved up to 54% (Table 1). The result of optical microscopy (B[74] in Fig. 6) clearly shows an increase in the size of the crystal compared with the sample for 1400 °C for 1 h (A[74] in Fig. 2), as anticipated, and accordingly a decrease in the interfacial area between MgO crystal and glass matrix depresses light scattering, leading to the improvement of optical transmittance. Coincidentally, D is found to be improved up to 0.70 mm2 s−1, which can arise from a decrease in interfacial thermal resistance. For B[110], D improves to 0.88 (Table 1) and the optical transparency retained. For B[140], D drastically increases to 1.57, but T633 drops to 20%. The origins of the increase and the decrease are clearly due to high-content precipitation of MgO crystal and the existence of air bubbles, respectively (B[140] in Fig. 6). In short, the high-temperature and long-time melting provides the increase in the crystal size, but the excessive addition of MgO gives rise to the appearance of bubbles, which may be due to an increase in viscosity and/or decomposition of the glass matrix.
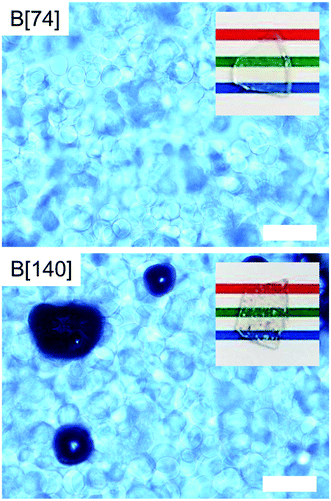 | ||
| Fig. 6 Optical microscopic images in ∼1 mm depth areas of as-quenched D[74, 140]. The white scale bars correspond to 100 μm. | ||
3.5 Compositional design for high conductivity and transmittance
Taking A[53] as a standard sample, we optimize the composition for precise index matching with MgO crystal. First, we increased La2O3 content, which works as the index enhancer, but the sample exhibited an optical inhomogeneity, resulting in a decrease in optical transmittance. This result may be consistent with the previous report,21 i.e., high content of La2O3 causes partial phase separation in the La2O3–B2O3–SiO2 system.Then, we added Nb2O5, being also known to be the index enhancer,14 when the tentative contents of Nb2O5 and MgO are 5 and 90, respectively (C[90] in Table 1). Thus, we found that C[90] comprises homogeneous glass matrix and MgO crystal and C[77], whose index is 1.740 (Table 1), approximately corresponds to the MgO-saturated glass. Note that the MgO content in the MgO-saturated composition increases from 53 to 77 by exchanging La2O3 for Nb2O5. This may be because Nb2O5 partially works as a network former in the glass matrix23 and consequently dissolution of MgO into the glass matrix is promoted. To decrease the excess index of 1.740, the Nb2O5 content is decreased and thus we found that the optimized composition for the glass matrix is that of D[77] with 4.3Nb2O5. Fig. 7a shows the refractive index dispersions in D[77], which is fitted by the Sellmeier equation,1 and MgO crystal.13 The dispersions are in good agreement between the two samples, in which the difference is as small as 0.002 at a wavelength of 633 nm and we see approximately perfect matching around 500 nm. Finally, we increase the MgO with the condition of 1650 °C and 4 h for the large-size precipitation of MgO crystal. As a result, D[170] shows the sharp peaks due to MgO crystal in the XRD pattern, and we hardly identify most of the MgO crystals (∼50 μm in size) in optical microscopy (Fig. 8), which is consistent with the fact that the indices are successfully matched. In Fig. 7b, D[170] retains a high optical transmittance of ∼70% in the visible region. The slight decrease at >700 nm and the significant decrease at <500 nm can be caused by the mismatch of the indices and the light scattering by density fluctuation, respectively.
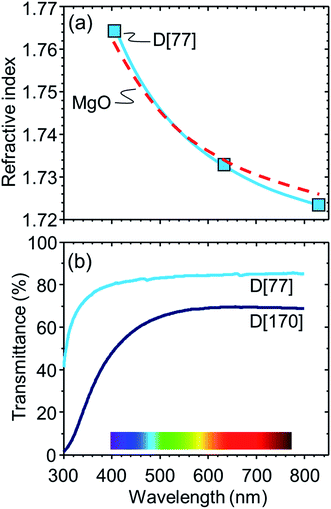 | ||
| Fig. 7 (a) Refractive index dispersions of MgO crystal13 and D[77] and (b) optical transmittance spectra of D[77, 170] with a thickness of ∼0.35 mm. | ||
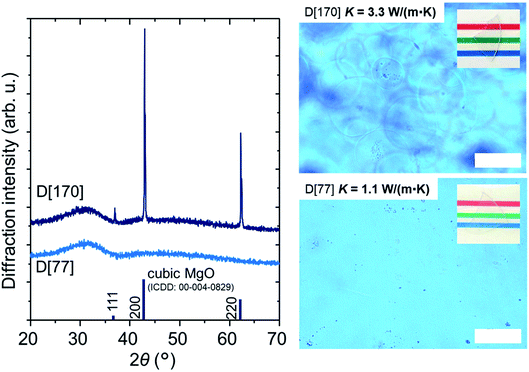 | ||
| Fig. 8 XRD patterns and optical microscopic images of D[77, 170]. The powder pattern of MgO crystal is also shown. The white scale bars correspond to 50 μm and the photos of the samples are inset. | ||
D[170] is found to yield a high K of 3.3 W (m−1 K−1). The value of K increases to ∼300%, ∼210% and ∼240% compared with those of D[77], our previous sample5 and SiO2 glass,24 respectively. Here, we used measured values of CD[77] and CD[170] at a temperature of 25 °C, ∼0.68 and ∼0.75 J (g−1 K−1), respectively. Moreover, the decline of T633 by the precipitation of MgO crystal is significantly suppressed to be −15% (Table 1). The result that Tg for D[77] and D[170] are matched (Table 1) is consistent with our structural model, i.e., the glass matrix has a unique structure after the MgO saturation.
Regarding the shaping ability in D[170], we observed glass transition at ∼688 °C (Table 1), but subsequent crystallization except for MgO at ∼800 °C. This point appears to be significantly lower that of the softening point, so that, at the present, it is hard to provide the shaping ability for D[170] without any structural changes.
3.6 Prediction of effective thermal conductivity
It is worthwhile to theoretically predict the thermal conductivity of the MgO-dispersed glass-ceramic, D[170], on the compositional design for higher thermal conductivity. Many kinds of formula have been proposed to predict effective thermal conductivity of materials comprising matrix and high thermal conductive fillers.25 Among them, we use a modified Bruggeman theory,25–27 classified as an effective medium theory, because it involves the validity for high volume fraction compared with the Maxwell–Garnet model and interfacial thermal resistance between the matrix and the fillers,25–27 as is the case in our material. Here, we consider that D[77] and MgO crystal correspond to the matrix and the filler, respectively. Then, the density ρD[170] of D[170] is given as follows, using the volume fraction f of MgO crystal,| ρD[170] = (1 − f)ρm + fρM, | (1) |
 | (2) |
Introducing the values of ρD[170] ∼ 3.65, ρm ∼ 3.69, and ρM ∼ 3.58 g cm−3 (ref. 11 and 28) at a temperature of 25 °C to eqn (2), we obtain f ∼ 0.36. According to the modified Bruggeman model, the effective thermal conductivity Keff is approximated as follows,25–27
 | (3) |
Fig. 9 shows f dependence of Keff for α = 0, 0.026. These lines clarify a guideline to obtain a higher thermal conductivity: not surprisingly, small α, i.e., large a and small Kint, and high f contribute to the increase in Keff, but a decrease in α, even if α = 0 was achieved, is not much effective for the increase in Keff. On the other hand, an increase in f produces an approximately exponential increase in Keff. However, we found that the MgO content in D[170] is almost equal to the upper limit value to obtain the transparent glass-ceramics, although the details are not shown. To overcome it, dispersion control of the MgO crystals, e.g., formation of percolated MgO crystal network,25 by controlling the melting and quenching conditions and the compositional design, can be promising.
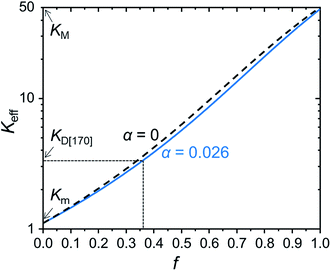 | ||
| Fig. 9 f dependence of Keff for α = 0 and 0.026 calculated from eqn (3). | ||
4. Conclusion
For the thermal management applications of glass, we fabricated the MgO-dispersed glass-ceramics by means of the oversupply of the MgO reagent, on the basis of the concept of “optical stoichiometry”.5,8 First, we investigated the structures in the La2O3–B2O3–SiO2–MgO system (samples A) by XRD, 11B and 29Si MAS-NMR, and optical microscopy. As a result, we found the following structural change: the added MgO modifies the glass matrix network, causing the decrease in the connectivity of BO3(4) and SiO4 units. The modification is completed in the MgO-saturated condition. By the further addition of MgO, the excess MgO loses the species to modify and accordingly it is aggregated and precipitated as MgO crystal.Through the control of the melting temperature and time for the large-size precipitation of MgO crystal and the compositional design for the precise index matching, we reached the composition of 8.2La2O3–4.3Nb2O5–24B2O3–10SiO2–170MgO (D[170]). The sample consisted of the glass matrix and MgO crystal with a volume fraction f ∼ 0.36 and shows a high thermal conductivity K of 3.3 W (m−1 K−1), compared to the typical oxide glasses and organic polymers, corresponding to 300% of that of the glass matrix (D[77]), and a high optical transmittance T633 of 70% for the 0.35 mm-thick sample. From the prediction of the effective thermal conductivity, we revealed that the dispersion control of MgO crystal can be effective for higher thermal conductivity. D[170] exhibits the glass transition at 688 °C, but is crystallized at ∼800 °C, so that any further composition explorations are required for achievement of the shaping of the melt. In addition, investigation on difference in the thermal expansion coefficient between the two phases and on defect states such as compositional fluctuation and dangling bonds at the interface will be needed for the practical use. It is expected that the present method and concept are expanded to not only thermal management applications of glass but also development of transparent oxide glasses having any functionalities such as high fracture toughness.
Conflicts of interest
There are no conflicts to declare.Acknowledgements
This work was partially supported by the Ministry of Education, Culture, Sports, Science and Technology of the Japanese government. We thank NETZSCH Japan K. K. for supporting the DSC measurement. We thank Ms Mariko Ando of the Department of Instrumental Analysis, School of Engineering, Tohoku University, and Mr Shingo Ebukuro of the Department of Applied Physics, Tohoku University, for the NMR and density measurements, respectively.Notes and references
- J. D. Musgraves, J. Hu and L. Calvez, Springer Handbook of Glass, Springer, 1st edn, 2019 Search PubMed.
- N. Terakado, R. Sasaki, Y. Takahashi, T. Fujiwara, S. Orihara and Y. Orihara, Commun. Phys., 2020, 3, 37 CrossRef CAS.
- R. Berman, Thermal Conduction in Solids, Clarendon Press, Oxford, 1980 Search PubMed.
- Elasticity and Strength in Glasses: Glass: Science and Technology, ed. D. R. Uhlmann and N. J. Kreidl, Academic Press, New York, 1980, vol. 5 Search PubMed.
- N. Terakado, R. Kozawa, T. Yoshimine, Y. Takahashi and T. Fujiwara, AIP Adv., 2018, 8, 115012 CrossRef.
- T. Nakanishi, Y. Katayama, J. Ueda, T. Honma, S. Tanabe and T. Komatsu, J. Ceram. Soc. Jpn., 2011, 119, 609–615 CrossRef CAS.
- K. Muramoto, Y. Takahashi, N. Terakado, Y. Yamazaki, S. Suzuki and T. Fujiwara, Sci. Rep., 2018, 8, 2275 CrossRef PubMed.
- Y. Yamazaki, Y. Takahashi, R. Ihara and T. Fujiwara, Appl. Phys. Lett., 2014, 104, 031901 CrossRef.
- N. Terakado, K. Watanabe, T. Kawamata, Y. Yokochi, Y. Takahashi, Y. Koike and T. Fujiwara, Appl. Phys. Lett., 2015, 106, 141902 CrossRef.
- N. Terakado, Y. Yokochi, K. Watanabe, Y. Takahashi and T. Fujiwara, J. Am. Ceram. Soc., 2016, 99, 1565–1572 CrossRef CAS.
- A. M. Hofmeister, Phys. Chem. Miner., 2014, 41, 361–371 CrossRef CAS.
- E. D. Palik, Handbook of Optical Constants of Solids, Academic Press, Boston, 1st edn, 1991, vol. 2 Search PubMed.
- CRC Handbook of Chemistry and Physics, ed. W. M. Haynes, CRC Press, Boca Raton, 97th edn, 2016 Search PubMed.
- Z. Mao, C. Wang, X. Zheng, J. Yu and L. Xiong, J. Am. Ceram. Soc., 2018, 101, 1500–1507 CrossRef CAS.
- W. Wisniewski, K. Takano, Y. Takahashi, T. Fujiwara and C. Rüssel, Sci. Rep., 2015, 5, 9069 CrossRef CAS PubMed.
- S. Kroeker and J. F. Stebbins, Inorg. Chem., 2001, 40, 6239–6246 CrossRef CAS PubMed.
- F. Angeli, O. Villain, S. Schuller, T. Charpentier, D. de Ligny, L. Bressel and L. Wondraczek, Phys. Rev. B: Condens. Matter Mater. Phys., 2012, 85, 054110 CrossRef.
- A. Masuno, T. Iwata, Y. Yanaba, S. Sasaki, H. Inoue and Y. Watanabe, Dalton Trans., 2019, 48, 10804–10811 RSC.
- https://nmr.cemhti.cnrs-orleans.fr/dmfit.
- K. A. Smith, R. J. Kirkpatrick, E. Oldfield and D. M. Henderson, Am. Mineral., 1983, 68, 1206–1215 CAS.
- H. Trégouët, D. Caurant, O. Majérus, T. Charpentier, T. Lerouge and L. Cormier, J. Non-Cryst. Solids, 2017, 476, 158–172 CrossRef.
- M. Imaoka, J. Ceram. Assoc. Jpn., 1961, 69, 282–306 CrossRef.
- B. Samuneva, S. Kralchev and V. Dimitrov, J. Non-Cryst. Solids, 1991, 129, 54–63 CrossRef CAS.
- S. R. Elliot, Physics of Amorphous Materials, Longman, New York, 2nd revised edn, 1990 Search PubMed.
- K. Pietrak and T. S. Wisniewski, J. Power Technol., 2015, 95, 14–24 CAS.
- A. G. Every, Y. Tzou, D. P. H. Hasselman and R. Raj, Acta Metall. Mater., 1992, 40, 123–129 CrossRef CAS.
- E. Schechtel, Y. Yan, X. Xu, Y. Cang, W. Tremel, Z. Wang, B. Li and G. Fytas, J. Phys. Chem. C, 2017, 121, 25568–25575 CrossRef CAS PubMed.
- A. S. M. Rao and K. Narender, J. Thermodyn., 2014, 2014, 1–8 CrossRef.
- A. Aryan, B. Guillet, J. M. Routoure, C. Fur, P. Langlois and L. Méchin, Appl. Surf. Sci., 2015, 326, 204–210 CrossRef CAS.
| This journal is © The Royal Society of Chemistry 2020 |

