
 Open Access Article
 This Open Access Article is licensed under a Creative Commons Attribution-Non Commercial 3.0 Unported Licence
Electrochemical and structural characterization of lithiation in spray deposited ordered mesoporous titania as an anode for Li ion batteries†
Gunnar Símonarson ,
Giulio Calcagno,
Antiope Lotsari and
Anders E. C. Palmqvist*
,
Giulio Calcagno,
Antiope Lotsari and
Anders E. C. Palmqvist*
Applied Chemistry, Department of Chemistry and Chemical Engineering, Chalmers University of Technology, 412 96 Göteborg, Sweden. E-mail: anders.palmqvist@chalmers.se
First published on 27th May 2020
Abstract
Ordered mesoporous titania, prepared via low-temperature spray deposition, was examined as an anode material for lithium ion batteries. The material exhibits an exceptionally high electrochemical capacity of 680 mA h g−1 during the first discharge, which rapidly decreases over the following cycles. The capacity stabilizes at around 170 mA h g−1 after 50 cycles and the material delivers 83 mA h g−1 at high charge/discharge rates (10C). A combination of electrochemical and structural characterization techniques were used to study the charge/discharge behavior of the material and the origin of the irreversible capacity. To determine the effect of cycling on the structure of the material, X-ray absorption spectroscopy (XAS) and energy filtered TEM were carried out on pristine and cycled samples in intercalated and deintercalated states. Titanium K-edge XAS measurements showed that intercalated lithium affects the NEXAFS region. By comparing peak intensity ratios, we propose a method to quantify the amount of lithium inserted into the titania structure and to differentiate between lithium bound in close proximity to titanium, and lithium bound further away from titanium. Additionally, we suggest that the irreversible loss in capacity is due to the formation of phases that are stable, and thereby electrochemically inactive, over the electrochemical cycling conditions applied.
Introduction
The increased availability and use of techniques that harness intermittent renewable energy sources, such as solar and wind energy, demands efficient and reliable energy storage systems, to be fully utilized. Lithium ion batteries (LIB) are a prominent energy storage device for portable electronics, fully electric vehicles and microelectronic devices due to their high energy density and high power density.1,2 Additionally, LIB are considered a viable option for stationary energy systems.3 Extensive material development has been performed to improve the four key components of the LIB, the electrolyte, the separator, the cathode and the anode.4,5 The conventional anode material is graphite which has an adequate energy and power density, relatively low cost and reasonable cycle life.4 Alternative anode materials have been developed to improve the energy density, the cycling rate capability, and to improve the safety of the batteries. Materials such as Si,6 Sn7 and their oxides8,9 as well as Co3O4 (ref. 10) and Ge11 have been explored as replacements for graphite. These materials have caught the interest of researchers and the industry because of their high capacities. In particular, silicon has about 10 times higher capacity than the traditional graphite anodes. However, during lithiation and delithiation these materials experience drastic volume changes which cause stress fractures and cracking, leading to severe capacity fading and possible collapse of the electrode. In addition, these materials have a low working potential vs. Li/Li+ when used as anodes in LIB which increases the risk of complications during cycling due to electrolyte decomposition leading to formation of solid electrolyte interfaces (SEI) which can cause a degrading performance. In addition, there is a risk of lithium dendrite formation which compromises the safety of the cell.Titania has recently been explored as a potential anode material in LIB due to its high operational potential window, long cycling life and relatively low cost.12,13 At the high operational potential the electrolyte decomposition and lithium dendrite formation is avoided, making titania a safer choice for anodes. In addition, due to very small volume expansion during lithiation/delithiation compared to many other anode materials, titania delivers a more stable performance over long time. However, bulk titania has been found to have poor rate capabilities due to the material's intrinsic low ionic and electrical conductivity. To address these challenges, a plethora of materials with nanosized structural features, high surface areas and short ion diffusion paths have been designed.14 Nanostructured titania has shown higher capacity compared to the respective bulk phases for anatase,15,16 rutile17,18 and TiO2-(B)19,20 crystalline phases. A few other structures of titania have been studied to a lesser extent, including amorphous materials. A few studies have shown that amorphous titania exhibits high capacity in the first cycle, up to about double the theoretical maximum capacity of titania, but which rapidly decreases in the following cycles.21,22 Moreover, amorphous titania displays different charge/discharge curves compared to crystalline titania, which shows distinct potential plateaus corresponding to distinct redox reactions. Amorphous titania is instead characterized by a linear correlation between voltage and capacity from about 2 V.21–23 Additionally, amorphous titania has shown good performance at high charge/discharge rates, making it a promising material for applications that demand high power.22,24 This has been attributed to faster lithium ion diffusion in amorphous titania compared to anatase.23 It has been demonstrated that lithiation may induce the formation of crystalline lithium titanate, which has been concluded to be an inactive phase and its formation thereby the primary source of the irreversible capacity.22,25 Another study suggested that the large irreversibility was due to reactions between Li ions with OH and H2O adsorbed to the surface of titania, leading to the formation of lithium oxide.21
Here, we study the lithium intercalation and deintercalation in spray deposited ordered mesoporous titania composed of a mixture of anatase nanocrystals (∼3–4 nm) and amorphous titania, which preparation has been described elsewhere.26 The material exhibits electrochemical behavior resembling amorphous titania. To characterize the intercalation and deintercalation and to understand the capacity fading processes of the material, galvanostatic charging with potential limitation (GCPL) and cyclic voltammetry (CV) measurements with selected cutoff voltages were performed and compared to a reference anatase titania sample. To characterize the structure of the material and to examine the structural changes it undergoes during cycling, X-ray absorption spectroscopy (XAS), High Resolution Transmission Electron Microscopy ((HR)TEM) and energy filtered TEM techniques were used.
Experimental
Synthesis of ordered mesoporous titania
Spray deposited ordered mesoporous titania was synthesized using a method previously reported.26 In short, a reaction solution was prepared by stirring 3 g ethanol (99.5%, Solveco), 2.25 g block co-polymer Pluronic™ F127 (Sigma Aldrich) and 1.5 g 5 M HCl (Sigma Aldrich) in a closed polypropylene bottle until the F127 was completely dissolved. Subsequently, 1.5 g titanium butoxide (97%, Sigma Aldrich) was added to the solution and the solution was stirred for approximately 10 minutes, until the titania precursor was dissolved. The final molar composition of the reaction solution was (titanium butoxide![[thin space (1/6-em)]](https://www.rsc.org/images/entities/char_2009.gif) :ethanol:HCl:water:F127) (1:14.8:1.57:15.7:0.041). The solution was stored for three hours at 40 °C in the closed polypropylene bottle. The reaction solution was spray deposited (15 second spray time) on glass slides (VWR 631-1551, 76 × 26 mm) using an Aztek A470 Airbrush, with a 0.30 mm general purpose nozzle (Aztek 9305 CX). After deposition, the film was aged for 72 hours in a closed climate chamber at 75% relative humidity (RH). Subsequently, the films were exposed to UV irradiation for 24 hours to photocatalytically remove the F127 polymer template. The ordered mesoporous titania material was collected by scraping the film of the glass slides. Titania anatase nanoparticles of ∼15 nm diameter (Alfa Aesar, product number 45603) were used as a reference.
:ethanol:HCl:water:F127) (1:14.8:1.57:15.7:0.041). The solution was stored for three hours at 40 °C in the closed polypropylene bottle. The reaction solution was spray deposited (15 second spray time) on glass slides (VWR 631-1551, 76 × 26 mm) using an Aztek A470 Airbrush, with a 0.30 mm general purpose nozzle (Aztek 9305 CX). After deposition, the film was aged for 72 hours in a closed climate chamber at 75% relative humidity (RH). Subsequently, the films were exposed to UV irradiation for 24 hours to photocatalytically remove the F127 polymer template. The ordered mesoporous titania material was collected by scraping the film of the glass slides. Titania anatase nanoparticles of ∼15 nm diameter (Alfa Aesar, product number 45603) were used as a reference.
Electrochemical testing
Electrodes were prepared by mixing the mesoporous titania with Carbon Black, Super-P™ (Alfa Aesar) and Kynar® Polyvinylidene Difluoride (PVDF) binder (Arkema) in N-methyl-2-pyrrolidone (NMP) (Sigma Aldrich), and depositing the mixture on a current collector consisting of copper. First, mesoporous titania and the Super-P™ were mixed by ball milling at 10 Hz for 10 minutes in a ZrO2 cup with ZrO2 balls in a Retsch MM400 ball mill, weight ratio (8:1) (titania:carbon). The ball milled mixture was transferred to a glass vial and Kynar® 5% (w/w) in NMP was added and the mixture was stirred overnight in the capped vial, forming a slurry. The weight ratio of (titania:carbon:dry PVDF) was (8:1:1). The slurry was poured onto copper foil placed on a TQC AB3400 motorized automatic film applicator. A stainless-steel doctor blade (Wellcos Co.) was used to coat a 150 μm thick coating of the slurry. The coating was let dry overnight at room temperature with additional drying at 80 °C for 2 hours.
Two electrode and three electrode cells were assembled in a glove box under argon atmosphere with oxygen and water content less than 1 ppm. Electrodes were prepared by cutting a 10 mm diameter circular piece of the coated copper foil and to remove oxygen and water from the sample it was further dried in a high vacuum oven (Buchi oven) at 70 °C for 2 hours before it was transferred to a glove box. Coin cells were prepared in the glove box with the sample as a cathode and a lithium disc as an anode. The titania/carbon electrode was placed in a coin cell case and wet with 20 μL of the electrolyte, 1.0 M LiPF6 in EC/DMC = 50/50 (LP30) (Sigma Aldrich). A glass microfiber separator (Sigma Aldrich) was used and further 40 μL LP30 was used to soak the separator. The coin cells were used for galvanostatic measurements at current rate 165 mA h g−1 (0.5C), which were carried out between 0.7 V and 2.9 V in a Scribner 580 battery cycler. Cyclic Voltammetry (CV) measurements were performed with a three electrode T-cell setup to which lithium foil was used as counter and reference electrode. The working electrode and the counter electrode were pressed together with a separator between them. The cell was filled to the brim with electrolyte before the reference electrode was inserted. The cell was carefully closed and sealed with Parafilm® laboratory film and aluminum foil to prevent leaking and evaporation of the electrolyte out of the cell and oxygen/moisture from entering the cell. The CV measurements were carried out at voltages from 0.7, 1.0, 1.3, or 1.7 to 2.9 V, respectively, in a Bio-Logic VMP-3 potentiostat. Electrochemical Impedance Spectroscopy (EIS) spectra were recorded with a Bio-Logic VMP-3 potentiostat between 1 MHz and 100 mHz.
Characterization techniques
TEM samples were prepared by a TEM lamella lift-out technique in a FEI Versa3D FIB/SEM. The lamella was attached to a copper half grid and was ion thinned to transparency in the FIB/SEM. The TEM observations were performed on a FEI Tecnai G2 operating at 200 kV and on a FEI Titan operating at 300 kV. Energy filtered EFTEM experiments were performed on the Titan. Nitrogen sorption analysis was carried out on a TriStar3000 instrument from Micromeritics Instrument Corporation. Prior to the adsorption measurements, the mesoporous titania was dried at 120 °C under nitrogen flow.X-ray absorption measurements on pristine, cycled and reference samples were performed at the Balder XAS beamline of the MAX IV synchrotron in Lund, Sweden.27 The measurements were carried out in transmission mode and titanium foil was used as a reference for energy calibration of the spectra.
Results and discussion
Electrochemical measurements
Mesoporous titania electrodes were cycled in a half cell configuration between 2.9 V and 0.7 V and the galvanostatic charge/discharge curves of cycles 1, 2, 5, 10 and 50 are shown in Fig. 1a. As a comparison, charge/discharge curves for nanocrystalline anatase electrode are shown in Fig. 1c. Voltage plateaus are observed for the anatase at approximately 1.95 V and 1.75 V for Li+ deintercalation (charge) and intercalation (discharge). The theoretical capacity of lithium intercalation into the anatase phase is achieved when the composition reaches Li1TiO2 which corresponds to a specific capacity of 335 mA h g−1.28 The mesoporous titania, instead, exhibits a quasi linear dependence of the stored charge with the potential through the charge/discharge curve. The trace resembles a pseudocapacitive behavior of intercalation type, which means that fast redox reactions occur due to ion intercalation at the surface of the material.29 A very high capacity of ∼680 mA h g−1 was observed for the first discharge cycle of the mesoporous material, which corresponds to Li2.03TiO2. However, the capacity decreased rapidly in the subsequent cycles and the second and 50th cycle show capacity of ∼280 and ∼170 mA h g−1, respectively. A similar behavior with large irreversibility has been found in studies on amorphous titania materials.21–24 To further understand the electrochemical differences between the mesoporous material and the anatase phase, cyclic voltammetry tests at 0.3 mV s−1 scan rate are reported in Fig. 1b for the mesoporous titania and the anatase reference sample in Fig. 1d. The nanometer sized anatase exhibits typical and well-defined redox peaks. In contrast, the mesoporous titania does not show distinct redox peaks, consistent with the absence of voltage plateaus in Fig. 1a, which suggests that the amorphous titania structure exhibits an intrinsic pseudocapacitive behavior of intercalation type.29 This pseudocapacitive behavior can be attributed to the amorphous structure and the mesoporous morphology. The presence of mesopores, thin titania walls and high surface area allow for the capacitance contribution at potentials over 2 V and for fast surface faradaic reactions, due to reduced diffusion lengths for Li ions into the titania structure.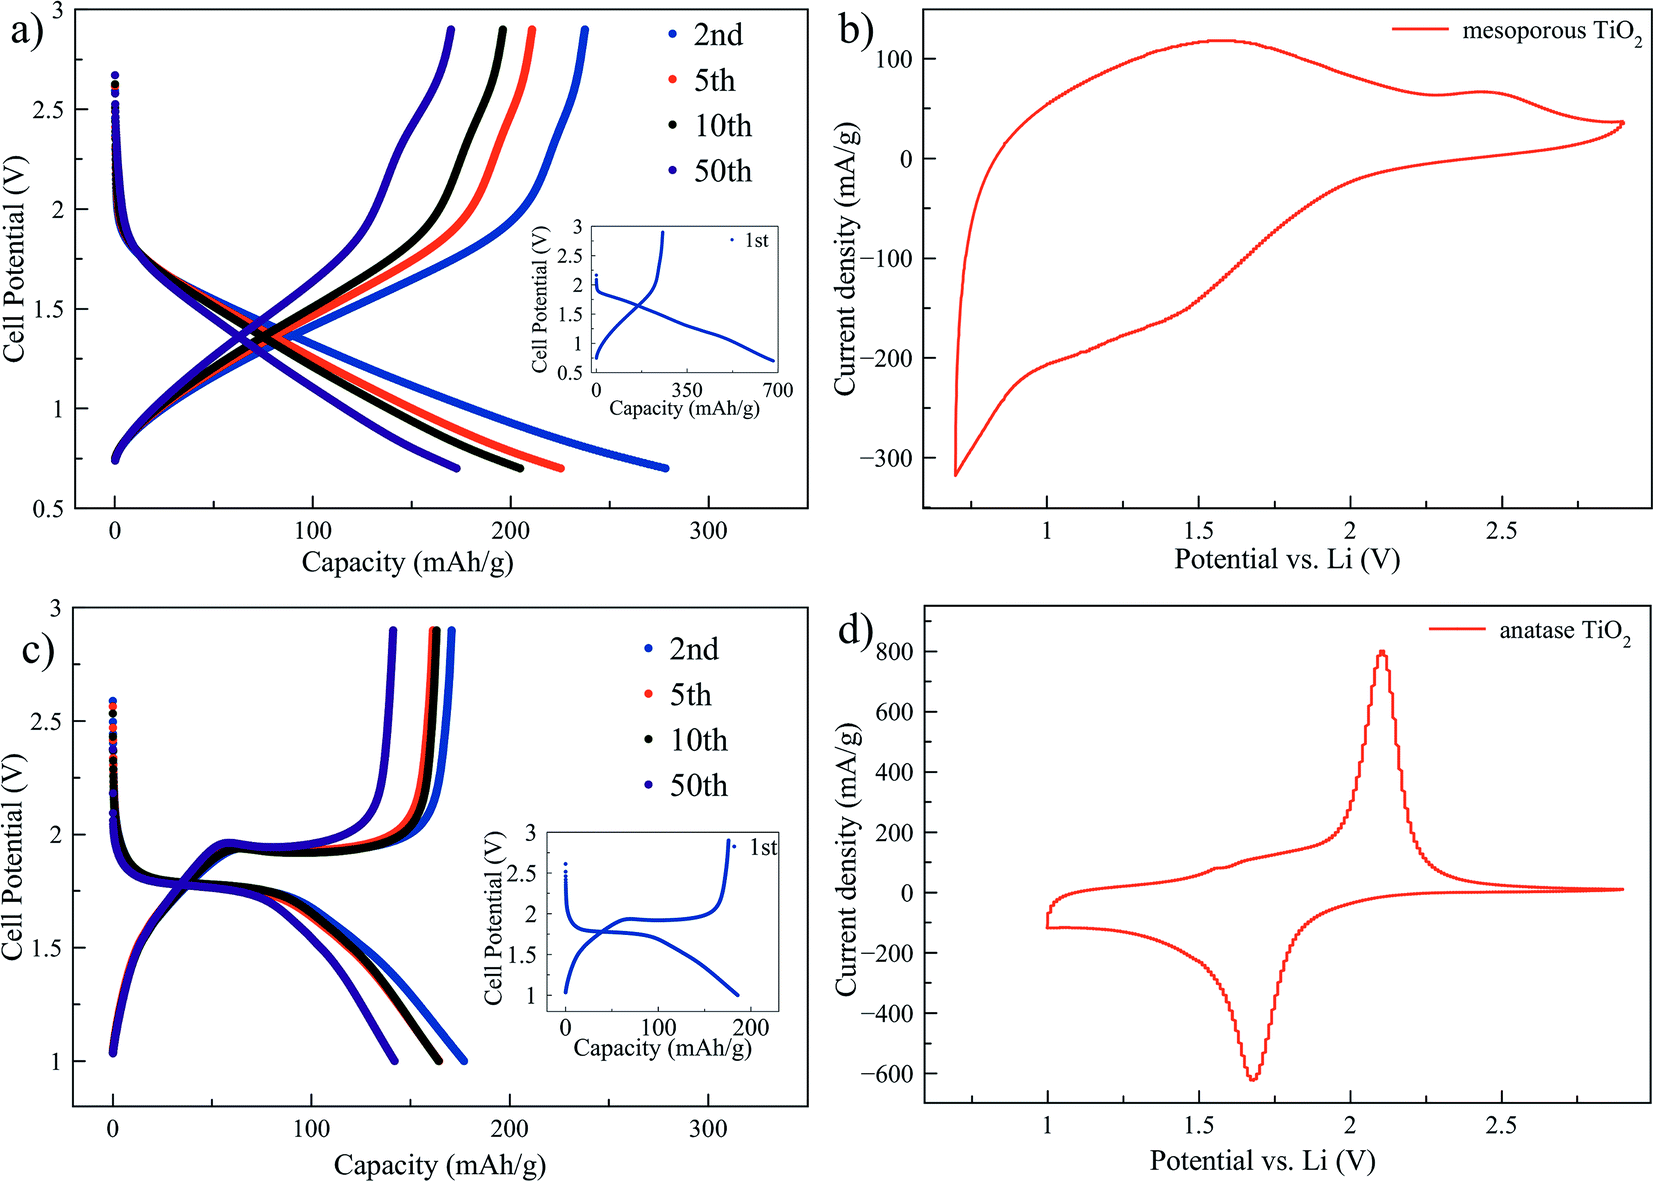 | ||
| Fig. 1 Charge/discharge curves of mesoporous titania electrodes between 2.9 V and 0.7 V (a) and anatase titania electrodes between 2.9 V and 1 V (c) both cycled at 0.5C. Cyclic voltammetry curves (10th cycle) scanned between 2.9 V and 0.7 V for mesoporous titania (b) and scanned between 2.9 V and 1 V for anatase (d) at scan rate 0.3 mV s−1. | ||
To explain the difference in the charge/discharge profiles of the anatase and the mesoporous titania, the local environment of the titanium atom was characterized with X-ray absorption spectroscopy (XAS). Fig. 2a shows the spectra of the anatase reference and the pristine mesoporous material. Notably, by comparing the energy of the edge position where the normalized absorption is 50% of the step height, the anatase and the mesoporous material appear to have an equal edge position, indicating that titanium is in the same oxidation state in both samples (Ti4+).
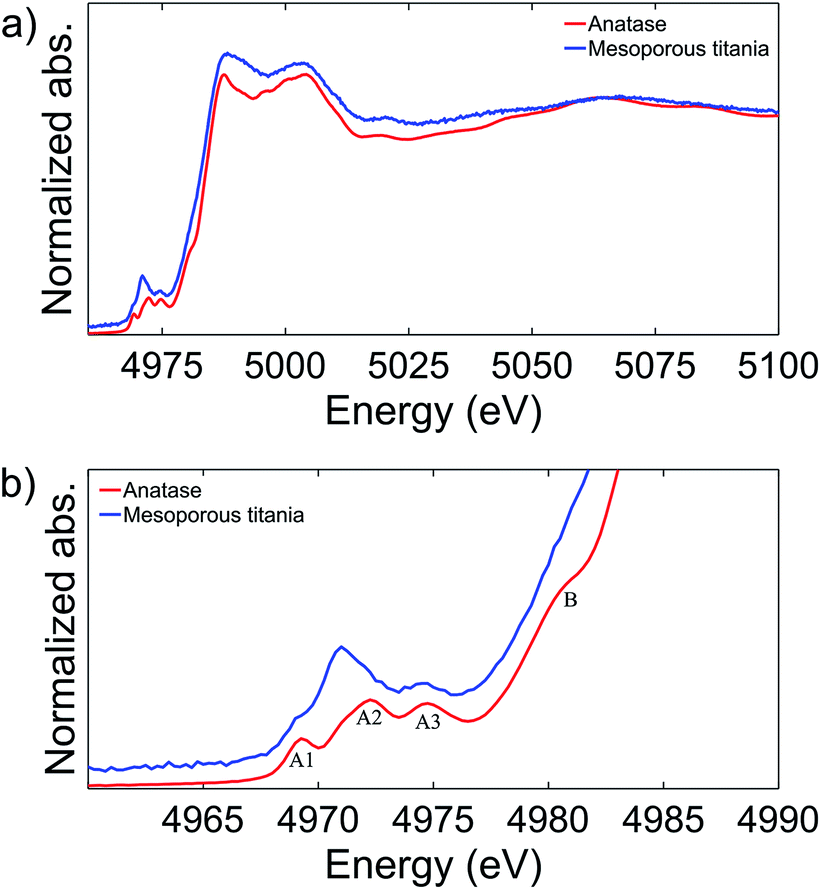 | ||
| Fig. 2 XAS spectra of the anatase and the pristine mesoporous titania samples (a). The pre-edge features are highlighted (b). The absorption spectra are shifted in intensity for clarity. | ||
Fig. 2b shows the rich titanium pre-edge. For anatase, three clear peaks are observed in the pre-edge region, commonly labelled A1, A2 and A3 although there is some discrepancy in the literature.21,30–32 In addition, the A2 peak has a shoulder on the low energy side. In contrast, the pristine mesoporous material shows a higher relative intensity of the A2 peak in the pre-edge region and the position is shifted to slightly lower energies. The three peaks have been ascribed to electronic transitions from the 1s to the outer 3d (split in t2g and eg) and 4p orbitals.30,33
The anatase structure can be described as slightly distorted octahedral where the titanium atom sits in the center of the octahedron. The A1 peak has been assigned to a combination of transitions from 1s to 3d (t2g) and from 1s to a hybridization of 4p–3d (t2g). The A2 peak has a contribution from transitions from the 1s to 4p–3d (eg) hybridization, a weak contribution from the 1s to 3d (t2g) transition, and a contribution from transitions from 1s to a hybridization of the 4p band of the absorber and the 3d band of a neighboring Ti atom.31 The A3 peak was attributed fully to a transition from 1s to a hybridization of 4pz of the absorber and 3d (eg) of a neighboring Ti atom.31
Peak features similar to those of our pristine mesoporous material have been observed before in distorted or amorphous titania structures and in other compounds where the Ti coordination is lower than 6. They were then attributed to increased mixing of the 4d quadrupole and 4p dipole states in accordance with a less centrosymmetric polyhedron leading to the observed increase in intensity of the A2 peak.34,35
Based on the peak position and peak intensity, three characteristic regions of Ti environments have been defined [4]Ti, [5]Ti and [6]Ti, and from the position and intensity of the peak we conclude that the mesoporous material studied here contains a combination of [5]Ti and [6]Ti.35 This is in good agreement with previous studies of amorphous titania nanoparticles, where it was shown that the amorphous structure formed was composed of an anatase-like core with defects near the surface of the particle, and that both [5]Ti and [6]Ti are present.36,37
Finally, a shoulder is observed on the anatase absorption edge, marked B in Fig. 2b. This shoulder peak has been assigned to 1s to 4p transitions with a simultaneous shakedown generating a hole in the highest occupied ligand orbitals.38 The absence of this peak in the mesoporous sample further demonstrates the difference in the symmetry of the titanium atom between the mesoporous and the anatase material. The difference in oxygen coordination number of the titanium atom and the symmetry of the two materials may explain the difference in charge/discharge curves. In particular, the apparently under-coordinated Ti atoms in the mesoporous material may explain its pseudocapacitive character.
In Fig. 3 further electrochemical characterization of the mesoporous titania is presented. After the initial irreversibility during the first 20 cycles, the electrode shows a slow fading of capacity with cycling, as shown in Fig. 3a. The capacity retention between cycles 20 and 200 was ∼80%. Fig. 3b reports the rate capability from 1C to 100C of the mesoporous titania. The material shows good performance at high rates, delivering 83 mA h g−1 at 10C. The fast cycling appears to have a limited effect on the structure of the material as it recovers its high capacity again when cycled at lower rates. Furthermore, the electrochemical impedance spectrum in Fig. S3† confirms the good conductivity of the electrodes thanks to the mesoporous morphology of the titania and the addition of the conductive carbon layer.39–42
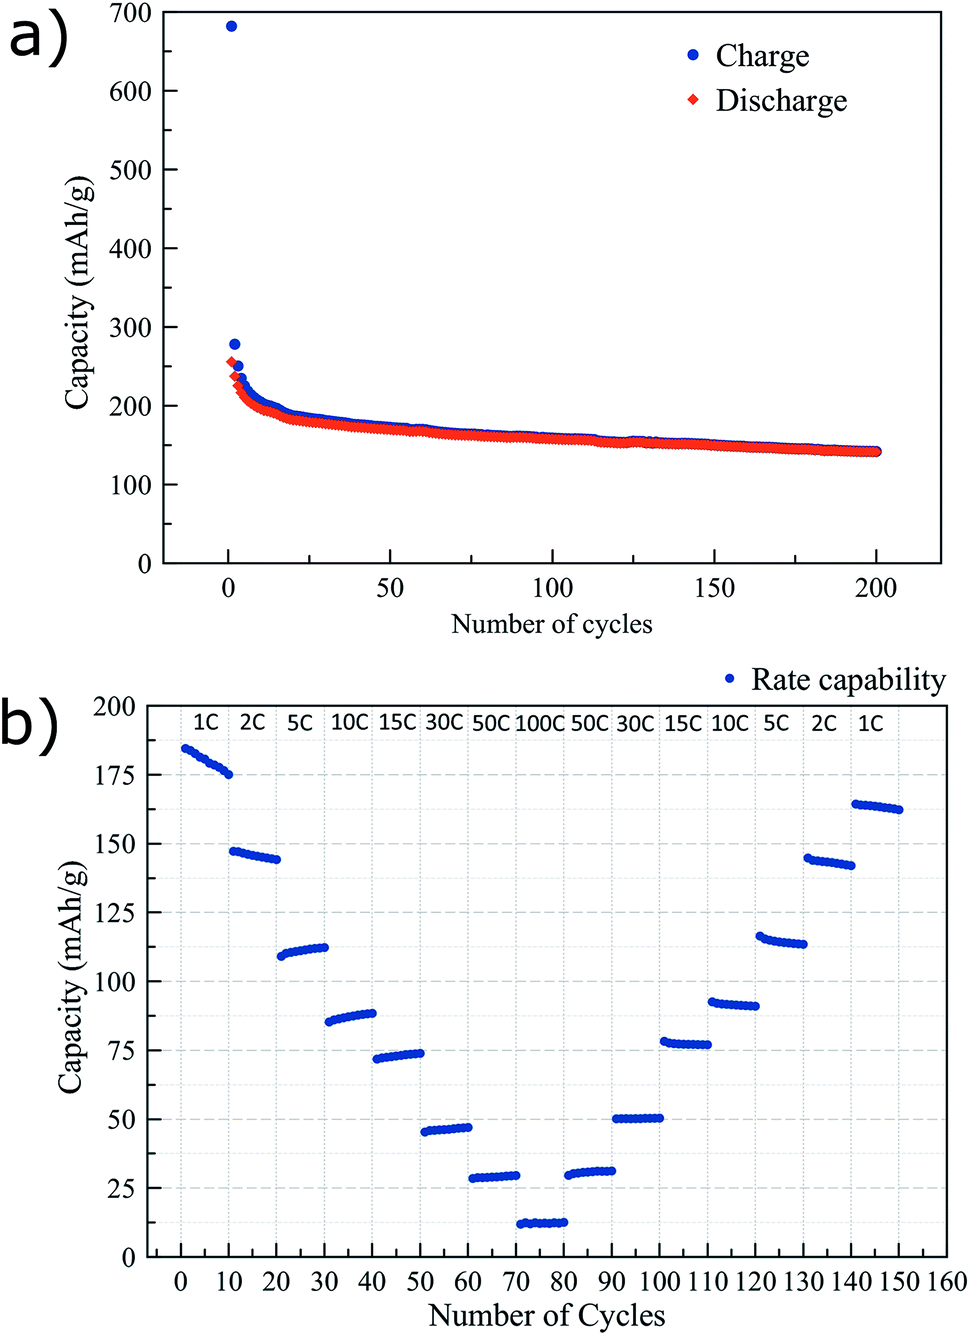 | ||
| Fig. 3 Charge and discharge capacity vs. number of cycles, cycled at 0.5C (a) and the performance at higher rates (b) of the mesoporous titania electrodes. | ||
Origin of the irreversibility
To further investigate the lithium intercalation and the irreversible capacity of the mesoporous titania, several CV tests with cutoff voltages of 1.7, 1.3, 1.0, and 0.7 V, respectively, were performed. These voltage limits were selected based on the discharge peak positions from first cycle of a CV curve cycled to 0.7 V, shown in Fig. 4d. The aim was to determine the onset of the irreversible processes and to study the associated structural changes in the material. In Fig. 4 the CV graphs are reported for electrodes cycled for 50 cycles. A large irreversibility is observed already at 1.7 V, as can be seen by the decrease in stored charge after 50 cycles. To the best of our knowledge the irreversibility of amorphous titania at this high voltage has not been reported before. At this high voltage the concentration of Li ions intercalated in the titania structure is low, typically x < 0.5 in LixTiO2.21,43 Fig. 4d shows the presence of four peaks during reduction, which we believe are associated to the formation of phases that are stable, and thereby electrochemically inactive, over the electrochemical cycling conditions applied (called irreversible phases from hereon). In the literature there is consensus that a solid electrolyte interface (SEI) starts to form around 1.0 V or below.21,44–46 We therefore suggest that the peak at ∼0.7 V is associated with SEI formation. To investigate the origin of the remaining peaks and the possible associated structural changes, additional characterization was performed with XAS and TEM.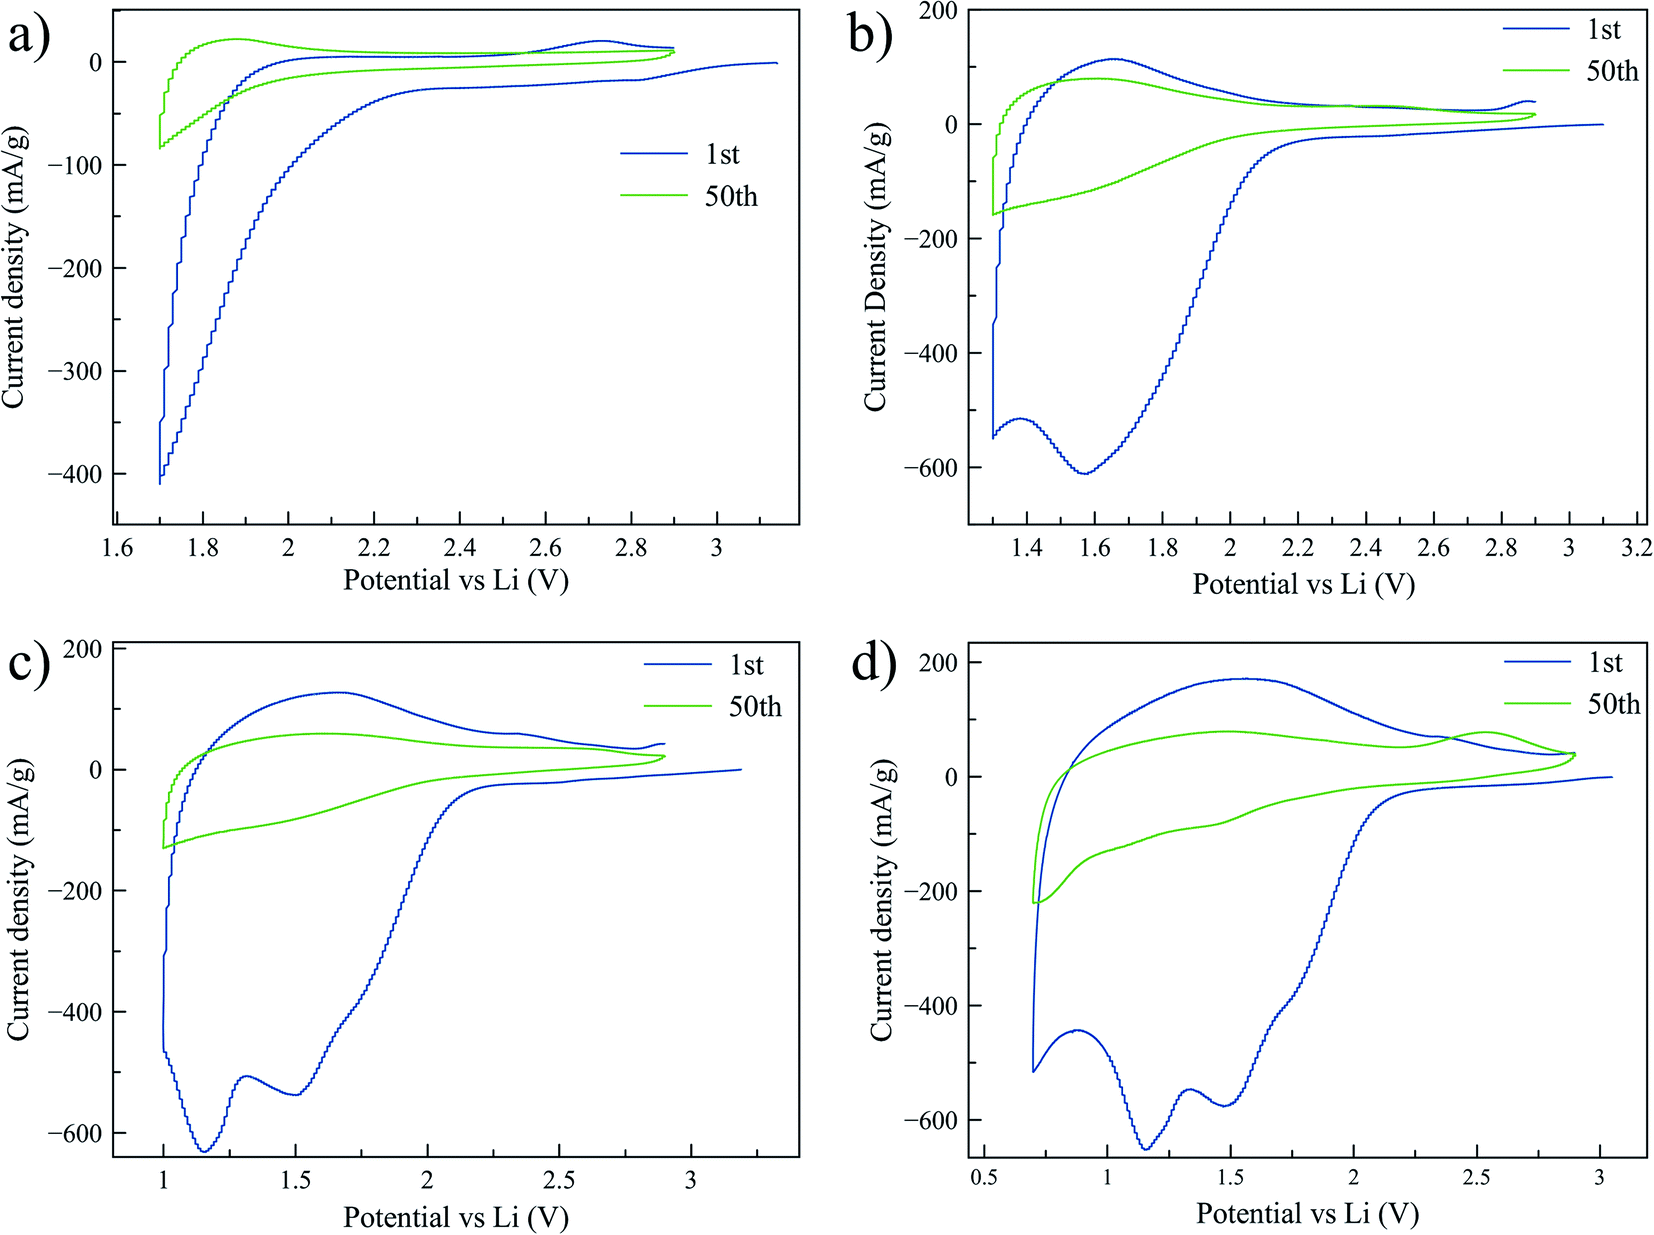 | ||
| Fig. 4 Cyclic voltammetry scans performed with a three-electrode setup at 0.3 mV s−1 between 2.9 V and 1.7 V (a), 2.9 and 1.3 V (b), 2.9 and 1.0 V (c), and 2.9 and 0.7 V (d). The first and fiftieth cycle of each CV are shown in the graphs. | ||
XAS measurements were performed on the samples that were cycled to the previously defined cutoff voltages. After 50 cycles of charge/discharge the cycling was interrupted at 2.9 V which corresponds to the total deintercalation of the reversibly stored Li. Additionally, a sample was prepared by interrupting the cycling at 0.7 V after 50 cycles, corresponding to the highest intercalated state studied here. To prevent the samples from reacting with oxygen or other species in the environment before the measurement, the samples were prepared in an argon filled glovebox with H2O and oxygen concentration < 1 ppm. First, the cell was opened, and the electrode was rinsed with Dimethyl Carbonate (DMC) (∼300 μL) and let to dry. To remove the sample from the copper current collector a piece of Kapton™ tape was applied on top of the electrode and removed, leaving the sample attached to the tape. Subsequently, the tape was folded to isolate the sample before it was moved out of the glovebox. Fig. 5 shows the XAS spectra for the cycled samples. The absorption edge position was determined by the energy position at 50% of the step height of the normalized absorption. Comparing the spectra of the cycled samples in the deintercalated state to the pristine sample or the anatase sample, the edge appears to remain in the same position indicating that the oxidation state has not changed. In Fig. 5b the spectra of the samples cycled to 0.7 V in lithium intercalated state (blue) and in deintercalated state (red) are compared. The spectra show a clear shift of the edge position of the intercalated sample to lower energies, estimated to 0.7 eV from the main peak position. The shift of the absorption edge and the pre-edge region indicates that the titanium atom is in a lower average oxidation state in the intercalated sample.47 Previously it has been shown that the edge shift is 3 eV between Ti4+ (TiO2) and Ti3+ (Ti2O3).48 A linear dependence of the absorption edge shift with the oxidation state would thus suggest that the average oxidation state in the intercalated state is +3.77.
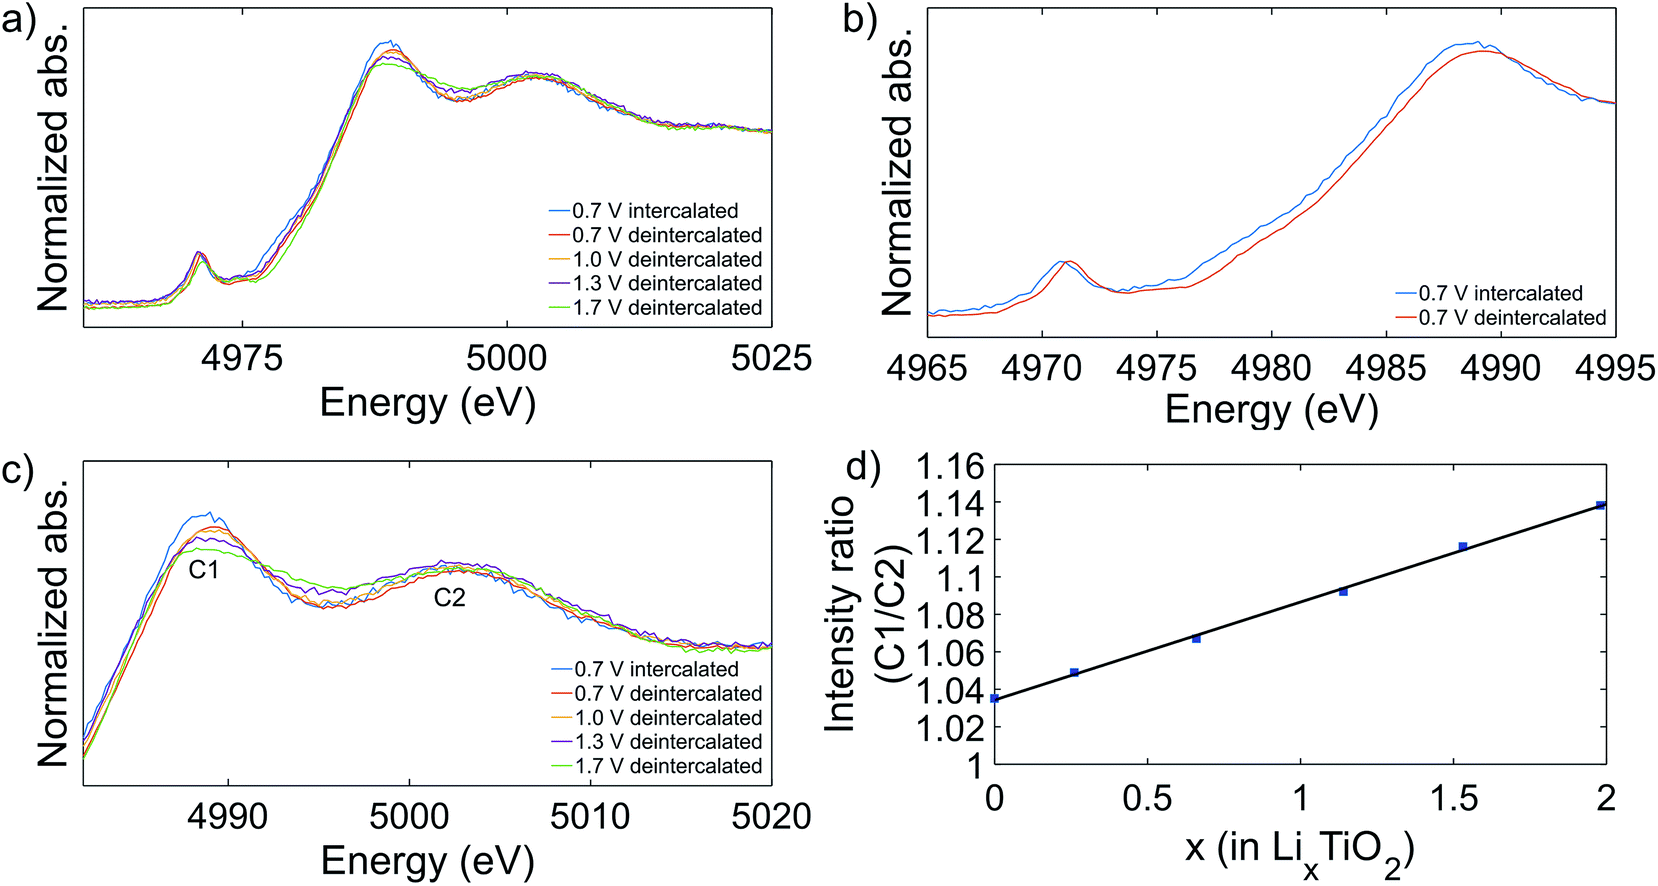 | ||
| Fig. 5 XAS spectra of the cycled samples (a) and a comparison of the intercalated and the deintercalated state of the samples cycled to 0.7 V, showing a shift in the edge position (b). The post-edge region of the XAS spectra of pristine and cycled mesoporous titania is highlighted (c) and the effect of the lithium concentration on the peak intensity ratio C1/C2 (d). The point at x = 0 is for the pristine sample. | ||
In the post-edge region, it is observed that cycling the samples leads to increased peak intensity ratio, C1/C2, compared to the pristine sample. Further, as seen in Fig. 5c, it was observed that the peak intensity C1/C2 increased with lower cutoff potential and at cutoff potential 0.7 V, the sample in the intercalated state has a higher peak ratio than the sample in the deintercalated state. In general, the post-edge or NEXAFS region has spectral features due to scattering of photoelectrons ejected with low kinetic energy.49 Multiple scattering (MS), mostly dominated by contributions from scattering pathways between ejected photoelectron and the atoms of the first shell around the absorber or 1s to Ti 4p transitions, is prominent in this region.30,50 In addition, relatively long pathways involving tightly bonded atoms beyond the first shell can give significant contributions. The electrochemical measurements showed a large irreversibility during cycling, implying that lithium is irreversibly inserted in the electrode. Therefore, it appears that the presence of the irreversibly bound lithium affects the MS processes and the NEXAFS region. The concentration of irreversibly bound lithium conceivably increases with lower cutoff potential and consequently has a larger impact on the MS processes, as seen in the shift in the ratio of the intensity of the C1/C2 peaks in Fig. 5d. The concentration of lithium was deduced from the CV reduction curve at the selected cutoff potentials by calculating the specific capacity from the current response over time, C = ∫Idt where I is the measured current and t is the time. The amount of lithium in the electrodes in the deintercalated state is calculated as the difference in the specific capacity of the first and the fiftieth cycle. For the sample in the intercalated state, containing both irreversibly and reversibly bound lithium, the lithium concentration is calculated as the specific capacity of the first reduction curve. From the graph (Fig. 5d) it is observed that there is a linear correlation between the lithium concentration and the intensity ratio of peak C1 to C2. Further, this linear relationship is valid for the electrodes in the intercalated state, containing reversibly and irreversibly bound lithium, and in the deintercalated state, containing only irreversibly bound lithium. This shows that the NEXAFS signal and possibly also the local environment of the titanium atom are affected in a similar way by the different lithium intercalation phenomena occurring during cycling, further indicating that the distance between the inserted lithium atoms and the titanium atom is very similar regardless if the lithium is reversibly or irreversibly bound. Previously it has been suggested that the distance between the titanium atom and lithium inserted into a titania structure is around 3 Å.51 Because reversibly and irreversibly bound lithium affect the MS in indistinguishable ways we propose that lithium is positioned in close proximity of the titanium atom in both cases, indicating formation of LixTiO2 species. This also implies that formation of lithium containing species outside the near environment of the titania structure, such as lithium oxide, is improbable in our system under the conditions used. Conversely, if the correlation between the lithium concentration and the peak intensity ratio deviates from linearity, it can be assumed that reversible and irreversible lithium are bound at different distances from the titanium atom. Due to the linear relationship, the XAS measurement can presumably be used to quantify the amount of lithium inserted into the titania structure. On the other hand, a deviation from linearity can presumably be used to quantify the relative amount of lithium in the close proximity as well as lithium located further from the titanium atom. In addition, a notable difference between the reversibly and irreversibly bound lithium is observed in the absorption edge position, which is only affected by the reversibly bound lithium, which thereby can be associated with the change in the oxidation state of the titanium atom.
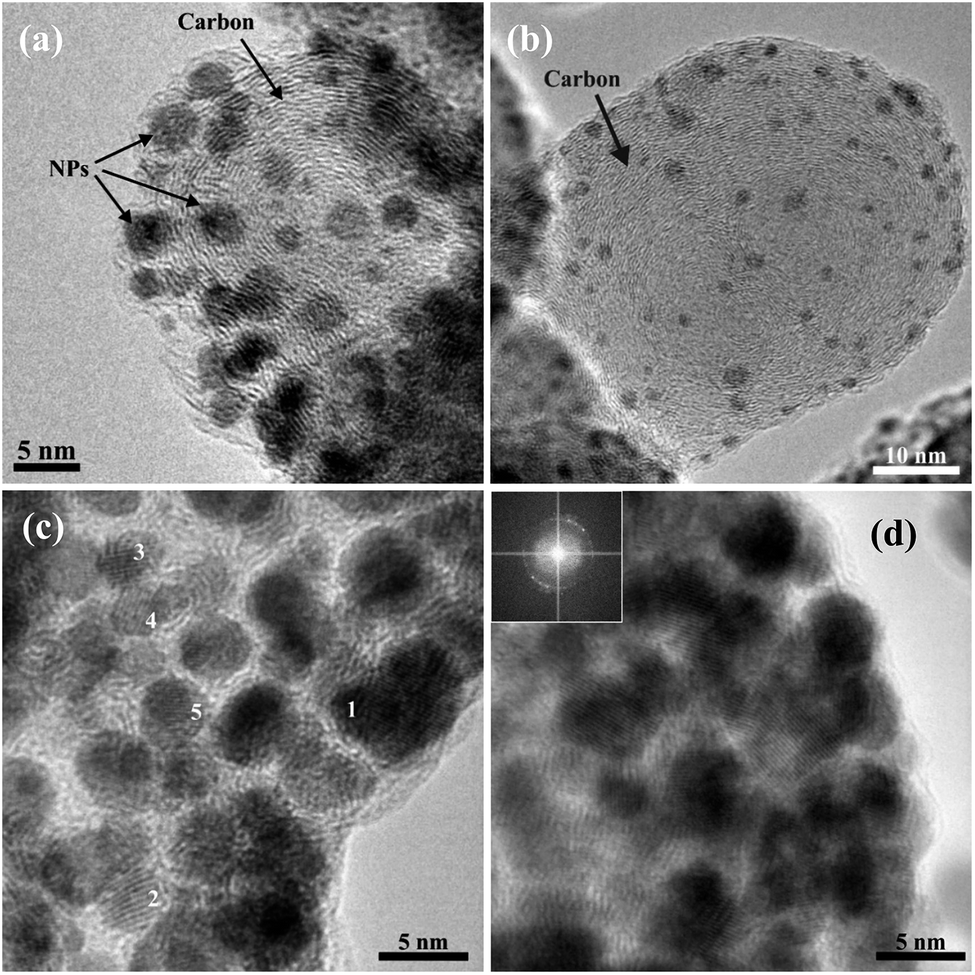
To further assess the nature and the composition of the titania carbon composite after cycling, TEM imaging and elemental mapping were employed. In a previous publication, it was shown that the titania material is mesoporous and contains small anatase crystallites.26 Nitrogen sorption analysis is shown in Fig. S4.† Due to the small sample size, the data is not of high quality but it is sufficient to illustrate the existence of mesopores. Bright field (BF) and high resolution (HR) TEM images of the electrode, composed of mesoporous titania in a carbon matrix, cycled to 1.7 V and interrupted in the deintercalated state, are shown in Fig. 6. The images show that the sample is composed of particles with an average size of 55 nm. The particles show a distinct circular layered pattern, typical for a carbon particle, as is observed in Fig. 6b. Small crystallites with an average size of 3 nm are observed in Fig. 6c. From the measured d-spacing, these crystallites were determined to be anatase. In addition, a lithium titanate crystalline (LiTiO2) phase was detected and is shown in Fig. 6d. The size of this crystal is approximately 15 nm and was found to correspond to the {400} planes of LiTiO2. This suggests that the lithium titanate formation can be associated to the reduction peak at 1.7 V, seen in the CV measurements (Fig. 4a). The observed decrease in current density after 50 cycles between 2.9–1.7 V suggests that the crystalline lithium titanate is, at least, partly responsible for the irreversible capacity observed. It appears that the formation of lithium titanate is formed by local crystallization phenomena occurring even at average Li concentration below x = 1 in LixTiO2. The formation of the lithium titanate phase is in line with the results from the XAS measurements shown in Fig. 5d, suggesting that irreversibly bound lithium causes changes in the MS processes which induce a shift of the C1/C2 ratio.
 | ||
| Fig. 6 Bright field TEM images of the electrode cycled to 1.7 V showing the overall morphology of the sample (a and b) and HR-TEM images showing the nanocrystalline anatase (c) and LiTiO2 (d). | ||
Fig. 7 shows TEM images of the electrode cycled to 1.0 V and interrupted in the deintercalated state. The electrode consists of carbon particles and contains a higher concentration of small crystallites, compared to the sample cycled to 1.7 V. In Fig. 7, the titania crystallites may misleadingly appear to consist of individual nanoparticles due to the thin slicing of the material during sample preparation. Fig. S1 in ESI† shows instead that the titania is interconnected. To establish the nature of the crystalline nanoparticles, the d-spacing was determined with a combination of analysis of the lattice fringes and measurements based on the reflections present in the FFT from the nanoparticle area. The phases investigated as possible structures are anatase, lithium oxide (Li2O) and lithium titanate (LiTiO2). The d-spacing measured are consistent either with both anatase and lithium oxide structures (NP 1, 5) or with anatase and lithium titanate (NP 2, 3, 4) shown in Fig. 7c. Therefore, we are not able to dismiss the presence of any of the three phases. However, it should be noted that the presence of lithium titanate crystal was confirmed in this sample as well and was found to be of a similar size as in the sample cycled to 1.7 V. Moreover, the observed linearity between the shift of the C1/C2 intensity ratio and the lithium concentration (Fig. 5d) supports the hypothesis that more LixTiO2 phases were formed in the electrode. It should be stated that the mesoporous titania material contains a large amount of amorphous phase, which is not readily detected in the TEM images, and the associated lithium containing phases are, presumably, partly amorphous as well.
 | ||
| Fig. 7 BFTEM images of the electrode cycled to 1.0 V consisting of carbon particles incorporating smaller crystalline nanoparticles (a and b). HRTEM images used for d-spacing measurements (c). The inset shows the FFT diffractogram that corresponds to the whole image (d). | ||
To further examine the electrode, including the amorphous phases, and to get more insight into the irreversibly bound lithium distribution, energy filtered (EF) TEM experiments were performed on the electrode cycled to 1.0 V and interrupted in the deintercalated state. The areas were energy filtered so that the maps of C, Li, Ti and O elemental distributions were obtained. Fig. 8 shows BF and energy filtered images and the elemental maps. As can be seen from both the individual maps and from the composite maps, Li appears to be located mainly at the surface while Ti, C and O are distributed over the whole area. Considering the nature of the amorphous titania phase, which contains a large number of defects near the surface, and the lithium elemental map, it appears that the irreversible phases are mainly located at the surfaces. The high quantity of lithium observed in the energy filtered images is in line with the large irreversibility observed in the CV curve of the electrode. Furthermore, the composite elemental maps show that lithium is located in close proximity with both titanium and oxygen, which is in line with our hypothesis that irreversible LixTiO2 species are formed during the cycling of the electrodes.
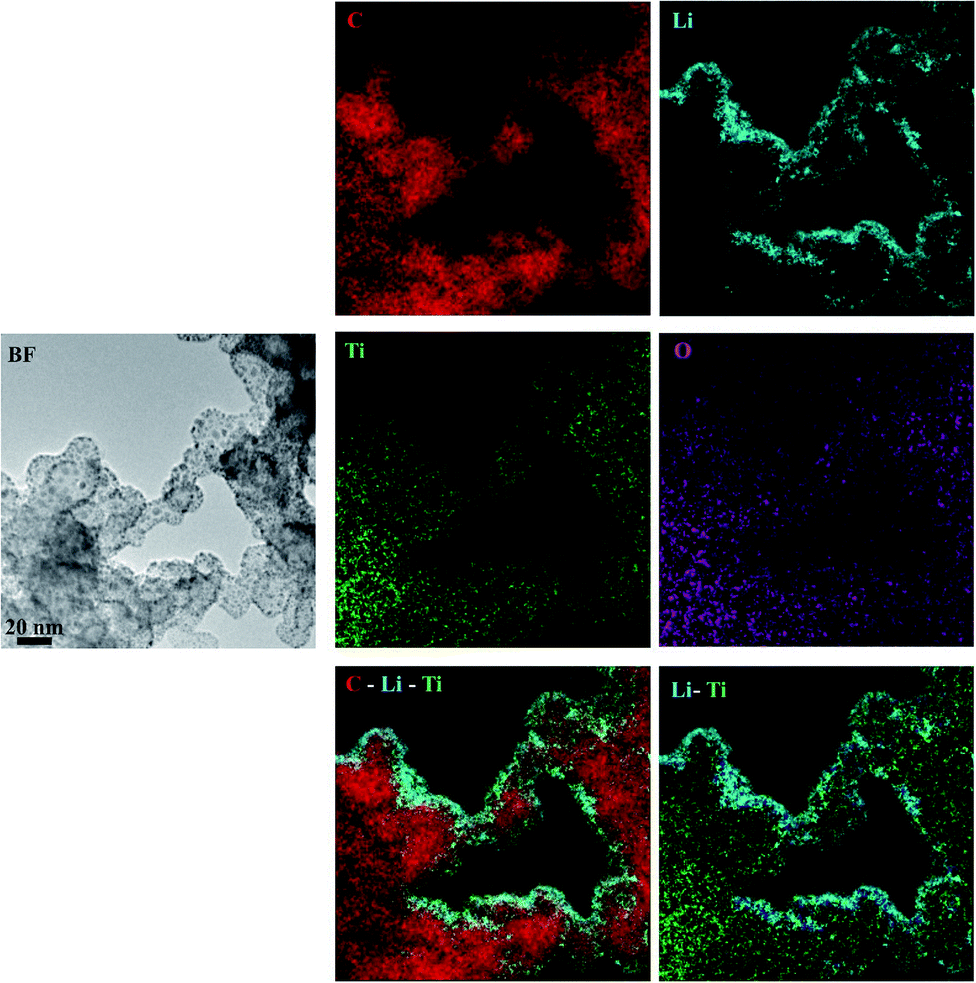 | ||
| Fig. 8 Unfiltered (BF), energy filtered images, and composite elemental maps of the mesoporous titania cycled to 1.0 V. From the composite elemental maps it can be seen that Li appears to be located mainly at the surface while Ti, C and O are distributed over the whole area. The scale is the same for all images. | ||
Conclusions
The lithiation of a mesoporous titania anode was characterized and compared to a reference nanocrystalline anatase titania. The mesoporous titania has a very high initial electrochemical capacity of 680 mA h g−1 in the first cycle, but the capacity quickly fades and is ∼170 mA h g−1 after 50 cycles, which is still higher than the reference material. The mesoporous titania performed well in the rate capability test, delivering 83 mA h g−1 at 10C. The large irreversibility of the material was analysed by cyclic voltammetry and structural characterization was performed by TEM and XAS. The CV revealed that the irreversibility occurs already at 1.7 V, at the position of the first peak which was found to be associated with the formation of crystalline lithium titanate (LiTiO2). Titanium K-edge XAS measurements showed that the average oxidation state of the titanium atom is not affected by the irreversibly bound lithium phases but reduced by the reversibly bound lithium. XAS measurements showed that irreversibly and reversibly intercalated lithium affect the multiple scattering in the NEXAFS region. By comparing peak intensity ratios in the NEXAFS region, we propose a method to quantify the amount of lithium inserted into the titania structure and to differentiate between lithium bound in close proximity and lithium located further away from the titanium atom. The mesoporous titania shows many similarities to amorphous titania, which contains high amounts of defects near the surface. We suggest that the presence of such defects leads to the formation of irreversible phases mainly located at the surface of the material.Conflicts of interest
There are no conflicts to declare.Acknowledgements
This work has been carried out with support from the Swedish Energy Agency project number 38340-1. G. S. thanks the Landsvirkjun Energy Research Fund for financial support. Dr Carmen Cavallo is thanked for discussions and support with electrochemical experiments. We acknowledge use of the Balder beamline at the MAX IV facility, funded by VR under grant DNR 2018-07152, and thank the MAX IV staff for their support. Konstantin Klementiev is gratefully acknowledged for great support at the beamline. Part of this work was performed at the Chalmers Material Analysis Laboratory, CMAL.Notes and references
- M. A. Hannan, M. S. H. Lipu, A. Hussain and A. Mohamed, Renewable Sustainable Energy Rev., 2017, 78, 834–854 CrossRef.
- Y. Wang, B. Liu, Q. Li, S. Cartmell, S. Ferrara, Z. D. Deng and J. Xiao, J. Power Sources, 2015, 286, 330–345 CrossRef CAS.
- M. Müller, L. Viernstein, C. N. Truong, A. Eiting, H. C. Hesse, R. Witzmann and A. Jossen, J. Energy Storage, 2017, 9, 1–11 CrossRef.
- N. Nitta, F. Wu, J. T. Lee and G. Yushin, Mater. Today, 2015, 18, 252–264 CrossRef CAS.
- G. Zubi, R. Dufo-López, M. Carvalho and G. Pasaoglu, Renewable Sustainable Energy Rev., 2018, 89, 292–308 CrossRef.
- J. Liu, P. Kopold, P. A. van Aken, J. Maier and Y. Yu, Angew. Chem., Int. Ed., 2015, 54, 9632–9636 CrossRef CAS PubMed.
- W.-M. Zhang, J.-S. Hu, Y.-G. Guo, S.-F. Zheng, L.-S. Zhong, W.-G. Song and L.-J. Wan, Adv. Mater., 2008, 20, 1160–1165 CrossRef CAS.
- Y. Deng, C. Fang and G. Chen, J. Power Sources, 2016, 304, 81–101 CrossRef CAS.
- X. Zuo, J. Zhu, P. Müller-Buschbaum and Y. J. Cheng, Nano Energy, 2017, 31, 113–143 CrossRef CAS.
- N. Du, H. Zhang, B. Chen, J. Wu, X. Ma, Z. Liu, Y. Zhang, D. Yang, X. Huang and J. Tu, Adv. Mater., 2007, 19, 4505–4509 CrossRef CAS.
- C. K. Chan, X. F. Zhang and Y. Cui, Nano Lett., 2008, 8, 307–309 CrossRef CAS PubMed.
- X. Su, Q. Wu, X. Zhan, J. Wu, S. Wei and Z. Guo, J. Mater. Sci., 2012, 47, 2519–2534 CrossRef CAS.
- Y. Liu and Y. Yang, J. Nanomater., 2016, 8123652 Search PubMed.
- M. Madian, A. Eychmüller and L. Giebeler, Batteries, 2018, 4, 7 CrossRef.
- E. Lim, H. Shim, S. Fleischmann and V. Presser, J. Mater. Chem. A, 2018, 6, 9480–9488 RSC.
- J. Kim and J. Cho, J. Electrochem. Soc., 2007, 154, A542–A546 CrossRef CAS.
- Y. S. H. Hu, L. Kienle, Y. G. Guo and J. Maier, Adv. Mater., 2006, 18, 1421–1426 CrossRef CAS.
- M. A. Reddy, M. S. Kishore, V. Pralong, V. Caignaert, U. V. Varadaraju and B. Raveau, Electrochem. Commun., 2006, 8, 1299–1303 CrossRef CAS.
- A. G. Dylla, G. Henkelman and K. J. Stevenson, Acc. Chem. Res., 2013, 46, 1104–1112 CrossRef CAS PubMed.
- Y. Ren, Z. Liu, F. Pourpoint, A. R. Armstrong, C. P. Grey and P. G. Bruce, Angew. Chem., Int. Ed., 2012, 51, 2164–2167 CrossRef CAS PubMed.
- W. J. H. Borghols, D. Lützenkirchen-Hecht, U. Haake, W. Chan, U. Lafont, E. M. Kelder, E. R. H. van Eck, A. P. M. Kentgens, F. M. Mulder and M. Wagemaker, J. Electrochem. Soc., 2010, 157, A582–A588 CrossRef CAS.
- W. H. Ryu, D. H. Nam, Y. S. Ko, R. H. Kim and H. S. Kwon, Electrochim. Acta, 2012, 61, 19–24 CrossRef CAS.
- S. Moitzheim, S. De Gendt and P. M. Vereecken, J. Electrochem. Soc., 2019, 166, A1–A9 CrossRef CAS.
- A. Lamberti, N. Garino, A. Sacco, S. Bianco, A. Chiodoni and C. Gerbaldi, Electrochim. Acta, 2015, 151, 222–229 CrossRef CAS.
- Q. Gao, M. Gu, A. Nie, F. Mashayek, C. Wang, G. M. Odegard and R. Shahbazian-Yassar, Chem. Mater., 2014, 26, 1660–1669 CrossRef CAS.
- G. Símonarson, A. Lotsari, A. E. C. Palmqvist, Molecules, submitted for publication Search PubMed.
- K. Klementiev, K. Norén, S. Carlson, K. G. V. Sigfridsson Clauss and I. Persson, J. Phys.: Conf. Ser., 2016, 712, 8–12 Search PubMed.
- N. J. J. De Klerk, A. Vasileiadis, R. B. Smith, M. Z. Bazant and M. Wagemaker, Phys. Rev. Mater., 2017, 1, 1–13 Search PubMed.
- Y. Gogotsi and R. M. Penner, ACS Nano, 2018, 12, 2081–2083 CrossRef CAS PubMed.
- G. S. Henderson, F. M. F. De Groot and B. J. A. Moulton, Rev. Mineral. Geochem., 2014, 78, 75–138 CrossRef CAS.
- D. Cabaret, A. Bordage, A. Juhin, M. Arfaoui and E. Gaudry, Phys. Chem. Chem. Phys., 2010, 12, 5619–5633 RSC.
- V. Luca, S. Djajanti and R. F. Howe, J. Phys. Chem. B, 2002, 102, 10650–10657 CrossRef.
- R. Asahi, Y. Taga, W. Mannstadt and A. J. Freeman, J. Phys. Chem. C, 2009, 61, 7459–7465 Search PubMed.
- F. Farges, G. E. Brown and J. J. Rehr, Geochim. Cosmochim. Acta, 1996, 60, 3023–3038 CrossRef CAS.
- F. Farges, G. E. Brown and J. J. Rehr, Phys. Rev. B: Condens. Matter Mater. Phys., 1997, 56, 1809–1819 CrossRef CAS.
- H. Zhang, B. Chen, J. F. Banfield and G. A. Waychunas, Phys. Rev. B: Condens. Matter Mater. Phys., 2008, 78, 1–12 Search PubMed.
- J. L. Mi, K. M. Ø. Jensen, C. Tyrsted, M. Bremholm and B. B. Iversen, CrystEngComm, 2015, 17, 6868–6877 RSC.
- R. Brydson, H. Sauer, W. Engel, J. M. Thomas, E. Zeitler, N. Kosugi and H. Kuroda, J. Phys. Condens. Matter, 1989, 1, 797–812 CrossRef CAS.
- H. Liu, S. Luo, D. Zhang, D. Hu, T. F. Yi, Z. Wang, Y. Zhang, Y. Liu, Q. Wang, A. Hao, X. Liu and R. Guo, ChemElectroChem, 2019, 6, 856–864 CrossRef CAS.
- S. Borhani, M. Moradi, M. A. Kiani, S. Hajati and J. Toth, Ceram. Int., 2017, 43, 14413–14425 CrossRef CAS.
- S. Bao, S. Luo, S. Yan, Z. Wang, Q. Wang, J. Feng, Y. Wang and T. Yi, Electrochim. Acta, 2019, 307, 293–301 CrossRef CAS.
- S. Yan, S. Luo, J. Feng, P. Li, R. Guo, Q. Wang, Y. Zhang, Y. Liu and S. Bao, Chem. Eng., 2020, 381, 122695 CrossRef CAS.
- Y. Ren, L. J. Hardwick and P. G. Bruce, Angew. Chem., Int. Ed., 2010, 49, 2570–2574 CrossRef CAS PubMed.
- E. Ventosa, E. Madej, G. Zampardi, B. Mei, P. Weide, H. Antoni, F. La Mantia, M. Muhler and W. Schuhmann, ACS Appl. Mater. Interfaces, 2017, 9, 3123–3130 CrossRef CAS PubMed.
- E. Madej, E. Ventosa, S. Klink, W. Schuhmann and F. La Mantia, Phys. Chem. Chem. Phys., 2014, 16, 7939–7945 RSC.
- M. Pfanzelt, P. Kubiak, S. Jacke, L. Dimesso, W. Jaegermann and M. Wohlfahrt-Mehrens, J. Electrochem. Soc., 2012, 159, 809–814 CrossRef.
- N. Ollier, P. Lombard, F. Farges and B. Boizot, J. Non-Cryst. Solids, 2008, 354, 480–485 CrossRef CAS.
- F. P. Leitzke, R. O. C. Fonseca, J. Göttlicher, R. Steininger, S. Jahn, C. Prescher and M. Lagos, Contrib. Mineral. Petrol., 2018, 173, 1–17 CrossRef CAS.
- F. Jalilehvand, PhD Thesis, KTH, Stockholm, Sweden, 2000, ISBN 91-7170-561-9.
- J. J. Rehr, A. Ankudinov and S. I. Zabinsky, Catal. Today, 1998, 39, 263–269 CrossRef CAS.
- Ľ. Benco, J.-L. Barras, C. A. Daul and E. Deiss, Inorg. Chem., 2002, 38, 20–28 CrossRef.
Footnote |
| † Electronic supplementary information (ESI) available. See DOI: 10.1039/d0ra02687e |
| This journal is © The Royal Society of Chemistry 2020 |