 Open Access Article
Estimation of a stronger heparin binding locus in fibronectin domain III14 using thermodynamics and molecular dynamics†
Sakshi Guptaa,
Neha Tiwaria,
Jyoti Vermab,
Mohd Waseemb,
Naidu Subbaraob and
Manoj Munde *a
*a
aSchool of Physical Sciences, Jawaharlal Nehru University, New Delhi-110067, India. E-mail: mundemanoj@gmail.com
bSchool of Computational and Integrative Sciences, Jawaharlal Nehru University, New Delhi-110067, India
First published on 27th May 2020
Abstract
The HEP II (Heparin-binding site II) region of fibronectin (FN) containing domain III14 plays a crucial role in cell adhesion and migration through heparin-binding on the cell surface. There are two such fibronectin heparin interacting peptide (FHIP I and FHIP II) sequences present in HEP II. However, the molecular principles by which these sites orchestrate heparin-binding processes are poorly understood. Such knowledge would have great implications in the therapeutic targeting of FN. With this aim, we have explored the binding studies of FHIP I and FHIP II with heparin using various biophysical methods. A fluorescence melting study specifically revealed the preference of heparin for domain III in FN, indicating the key contribution of FHIP I and FHIP II in heparin binding. In isothermal titration calorimetry (ITC), the higher binding affinity observed for FHIP II (∼107 mol−1) compared to FHIP I (∼106 mol−1) is expected due to the presence of a superior cluster of Arg and Lys residues in FHIP II, which can facilitate specific H-bonding interactions with heparin. Based on heat capacity changes, the key role of H-bonding, electrostatic and hydrophobic interactions was demonstrated in binding. Finally, the molecular docking and MD simulation results reinforced that the interaction of heparin (dodecasaccharide) is stronger and stable with the FHIP II peptide. The results described here suggest that these peptides provide all the structural and thermodynamic elements necessary for heparin-binding of HEP II of FN. Subsequently, it can be concluded that FHIP II could be a better location for therapeutic intervention in cell adhesion activity by FN.
Introduction
There is growing evidence that heparin-binding sites in the C-terminal domain of fibronectin (FN) participate in cell adhesion and migration through the recognition of heparin located on the cell surface.1–3 This ability of FN plays a critical role in the development of several devastating pathologies including cancer and inflammation.4 The heparin-binding sites of FN have populated in type III modules (12 to 14). The crystal structure of FN insinuated a distinctive basic patch in module III14 of FN,5 which also encompasses a well-known heparin-binding site II (HEP II), located within the carboxy-terminal of FN.1 There is another site, HEP I, located in domain I of the N-terminus of FN.6 However, the FN interactions with heparin are particularly dominated by the HEP II region.7–10Heparin, a member of glycosaminoglycan (GAG) family, is often chosen as a model compound in the experimental studies of proteins and GAGs. It is highly negatively charged alternating copolymers containing uronic acid (L-iduronic acid or D-glucuronic acid) and D-glucosamine.11 The presence of N-sulfamido, ester sulfate and uronic acid carboxylate groups results in high negative charge density. Over the years, several reports have been published on biophysical studies of protein–heparin interaction.12–16 Interactions of several peptides such as cell penetrating peptides (CPPs) have also been reported with heparin.17–21
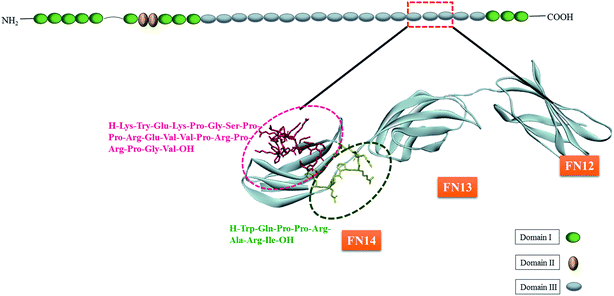
Since HEP II–heparin interactions can cause or exacerbates pathophysiological conditions,22 there is a great prospect of developing agents that can block these interactions. However, there are multiple heparin-binding sites spread across HEP II, and in particular III14 of FN, and therefore identifying the strongest heparin-binding site is critical for therapeutic intervention. For example, as shown in Fig. 1, FHIP I (203–210 sequence) is known to promote focal adhesion formation through heparin-binding,1 and FHIP II (216–235) is another stretch involved in heparin interaction.5 Despite the potential of FHIP I and FHIP II sites to bind heparin and drive FN function, the thermodynamic assessment and molecular mechanism of their heparin-binding capabilities are elusive in literature.
To fulfill this goal, we have focused on both biophysical and computational tools to explore the interactions of heparin with FHIP I and FHIP II. Additionally, the results were also compared with the whole FN. Based on rigorous thermodynamic and MD simulation analysis, it was established that the interaction of heparin is stronger and stable with the FHIP II peptide. Subsequently, it was concluded that FHIP II could be a better location for therapeutic intervention in FN. Further, the knowledge gained here can be used to answer the fundamental question allied to the physical basis of the heparin–FN interaction. Also, the study may open a new approach to come up with broad-based peptide inhibitors against FN. Previously, it has been established that agents that block the protein–heparin interaction can be powerful therapeutic candidates.14 A similar approach has also been adapted to carry out inhibition of protein–protein, protein–DNA complexes.23 Additionally, such peptides also have applications as cell adhesive biomaterials.24
Materials and methods
Materials
Fibronectin from bovine plasma (MW 450 kDa), fibronectin (Adhesion Promoting) heparin interacting peptide (FHIP I), 8 amino acid sequence (H-Trp203-Gln204-Pro205-Pro206-Arg207-Ala208-Arg209-Ile210-OH) KI and heparin (13 kDa) from porcine intestinal mucosa were purchased from Sigma Aldrich. FHIP II, a 20 amino acid sequence (H-Lys216-Try217-Glu218-Lys219-Pro220-Gly221-Ser222-Pro223-Pro224-Arg225-Glu226-Val227-Val228-Pro229-Arg230-Pro231-Arg232-Pro233-Gly234-Val235-OH) was purchased from Integrated DNA Technologies. Amino acid residue number was followed according to a ref. 5. FN was dialyzed overnight in PBS, pH 7.4 at 4–5 °C. All the samples were prepared in 20 mM phosphate buffer containing 10 mM Na2HPO4, 10 mM NaH2PO4, 1 mM EDTA and 25 mM NaCl. The concentration of the protein was measured using absorbance at 280 nm on the UV-vis spectrophotometer. The molar extinction coefficient used for FN, FHIP I and FHIP II were 580.5 × 10³ M−1 cm−1, 5690 M−1 cm−1 and 6354 M−1 cm−1 respectively. For pH dependent study at pH 4.0, 10 mM sodium acetate buffer was prepared using CH3COONa, 1 mM EDTA and 25 mM NaCl. For 10 mM citrate buffer was prepared using 3.3 mM HOC(COONa)(CH2COONa)2·2H2O, 6.7 mM C6H8O7, 1 mM EDTA and 25 mM NaCl.Methods
The interaction of heparin interacting peptide FHIP I and FHIP II in domain III14 of the protein was studied with the dodecasaccharide unit. Since both the peptides are present in the III14 domain therefore docking was carried out using this single domain of the protein. Molecular docking was performed using the GOLD software.27 Protein was prepared by removing water molecules, and adding missing hydrogens. Hydrogen atoms were added to the ligand molecule using Open Babel software.28 Two different docking experiments were performed by defining two different binding sites. First binding site corresponds to the FHIP I peptide and the second binding site is FHIP II. The resulting docked complexes were analysed using Pymol (https://pymol.org/2/).
First, the protein topology was generated using AMBER99SB force field and the ligand was parameterized by ACPYPE using general Amber force field (GAFF).30,31 The complex was solvated using TIP3P water molecules and a cubic box was generated with 1.2 nm distance between the surface of the protein and the edge of the box. The whole system was solvated and neutralized by adding Na+Cl− counter ions. Energy minimization was carried out using steepest descent and conjugate gradient methods to ensure no steric clashes or inappropriate geometry in the system. After the minimization, equilibration was done in two steps, in the first step NVT (N = number of particles, V = volume, and T = temperature) were kept constant and in the second, NPT (N = number of particles, T = temperature, and P = pressure) were constant throughout the simulation process. Finally, a 50 nanosecond (ns) simulations were performed for both the complexes. Different conformations of the ligand during the simulation at site FHIP I and FHIP II are shown in Fig. S4 and S5,† respectively. Since the ligand has many subunits, conformational change between the subunits may take place throughout the simulation process.
Results and discussion
Interaction of heparin with FHIP I
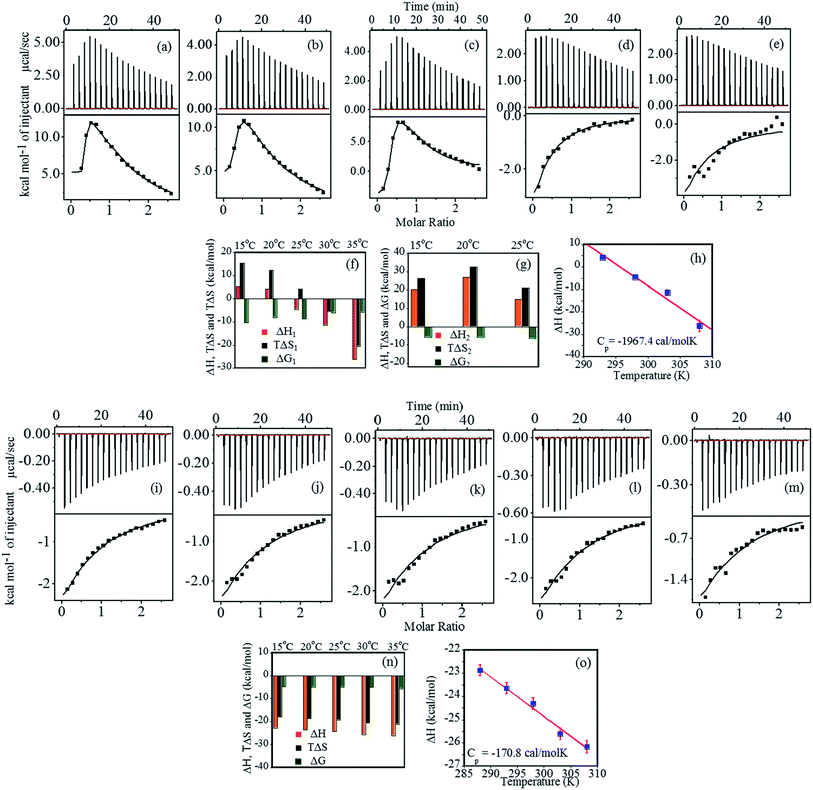
Thermodynamic characterization of the binding of heparin with FHIP I at pH 4.0 was performed using ITC (Fig. 2a–e). The binding thermograms were biphasic in nature at temperatures 15 °C, 20 °C and 25 °C, which gave a strong primary binding site and a weaker non-specific secondary binding site.32 The data were best fitted using two sets of binding site model (Table 1). Although the data fitted consistently over the wide range of temperature for the primary binding mode (Fig. 2f), the secondary binding mode showed quite an unusual temperature dependence (Fig. 2g). At 35 °C and 40 °C, the secondary binding mode became less prominent, suggesting the loss of the non-specific interactions at a higher temperature. The primary binding mode was marked with a strong binding affinity (106 to 107 M−1 at 15 °C, 20 °C, 25 °C). At higher temperatures (30 °C and 35 °C), complexation was less favorable, resulting in ∼100 times lower binding affinity. The stoichiometry of binding (N1) was observed in the range of 0.2–0.3 at all the temperatures, indicating 4–5 moles of FHIP I binding to 1 mole of heparin.| Primary sites | N1 | ΔH1 (kcal mol−1) | TΔS1 (kcal mol−1) | aΔG1 (kcal mol−1) | aKA1 × 106 (M−1) |
|---|---|---|---|---|---|
| a Errors were about 15 to 20% in KA and ΔG. | |||||
| 288 K | 0.316 ± 0.01 | 5.20 ± 0 | 15.5 | −10.3 | 66.0 ± 0 |
| 293 K | 0.26 ± 0.01 | 4.251 ± 0.5 | 12.4 | −8.1 | 1.2 ± 0.5 |
| 298 K | 0.2 ± 0.01 | −4.531 ± 0.7 | 4.23 | −8.7 | 2.6 ± 1.41 |
| 303 K | 0.23 ± 0.1 | −11.4 ± 6.9 | −5.4 | −6.0 | 0.018 ± 0.004 |
| 308 K | 0.20 | −26.3 ± 3.5 | −20.6 | −5.7 | 0.01 ± 0.002 |
| Secondary sites | N2 | ΔH2 (kcal mol−1) | TΔS2 (kcal mol−1) | ΔG2 (kcal mol−1) | KA2 × 104 (M−1) |
|---|---|---|---|---|---|
| 288 K | 1.08 ± 0.2 | 20.5 ± 5.5 | 26.3 | −5.7 | 2.1 ± 0.98 |
| 293 K | 0.9 ± 0.14 | 26.9 ± 5.3 | 32.5 | −5.6 | 1.3 ± 0.2 |
| 298 K | 0.83 ± 0.1 | 15.1 ± 2.8 | 21.3 | −6.2 | 3.6 ± 0.9 |
The ΔH1 values are positive at lower temperatures (Fig. 2g) indicating that the complex formation is associated with electrostatic33 and/or hydrophobic interaction.34 The ΔH1 values changed strongly from positive to negative with increase in temperature (Fig. 2f). At 25 °C, the binding is enthalpically as well as entropically driven. The negative increase in the entropy values illustrates that the hydrophobic interactions become less dominant with increasing temperature. The increase in negative enthalpy try to compensate this, however, the loss of entropy is much higher compared to gain in enthalpy resulting in a decrease in ΔG1 with increasing temperature. Furthermore, heat capacity change (ΔCP) was obtained by the linear fitting of ΔH1 vs. temperature (Fig. 2h). A large negative ΔCP (−1967.4 cal mol−1 K−1) is generally resulted when hydrophobic residues in water are transferred to a more nonpolar environment. This confirms the presence of dominant hydrophobic interactions at the binding interface.35
The enthalpy (ΔH2) and entropy (ΔS2) values were found to be positive with the overall binding driven mainly by entropy (Fig. 2g). Thus, ΔG2 resulted in negative values, although less favorable than ΔG1. The non-sigmoidal curve associated with the binding of the peptide to the two different sets of sites often suggests the evidence of cooperativity. Thus, the binding of the peptide to the first set of sites energetically makes binding to the second set of sites less favorable which can be easily seen from ΔG1 and ΔG2 values, resulting in negative cooperativity.36 Reduction in the stoichiometry (N) with a rise in temperature suggests an alteration in heparin–peptide interaction pattern at higher temperatures. The parameters obtained after fitting are shown in Table 2. The second binding phase, which disappeared at a higher temperature, must be driven by weaker hydrophobic interactions, whereas the first phase is consequence of strong, specific interactions from residues such as Arg and Glu.
| Temperature (K) | N | ΔH (kcal mol−1) | TΔS (kcal mol−1) | ΔG (kcal mol−1) | KA × 103 (M−1) |
|---|---|---|---|---|---|
| a Errors were too large due to lack of initial data points in ITC fitting.b Errors not shown as parameter was constraint during fitting exercise. | |||||
| 288 | 0.25b | −22.8 ± 0.4 | −17.9 | −4.9 | 5.6 ± 0.2 |
| 293 | 0.26 ± 0.75 | −23.6a | −18.6 | −5.0 | 5.2 ± 2.8 |
| 298 | 0.25b | −24.3 ± 1.6 | −19.3 | −5.0 | 4.9 ± 0.5 |
| 303 | 0.28 ± 0.67 | −25.6a | −20.5 | −5.1 | 5.0 ± 2.2 |
| 308 | 0.2 ± 1.44 | −26.1a | −21.0 | −5.1 | 4.4 ± 3.6 |
The binding of FHIP I was further studied at pH 7.4 as shown in Fig. 2i–m. The binding parameters (Fig. 2n) were obtained using the single set of identical binding sites model. The binding affinity KA was found to decrease slightly (5.6 × 10³ M−1 to 4.4 × 10³ M−1) with an increase in temperature. N values were in the range of 0.19–0.27, suggesting that 4–5 molecules of peptide were bound to a single molecule of heparin (one peptide/10 saccharides) and the effect was independent of the temperature.37 The much weaker binding affinity mostly suggests the presence of a non-specific binding mode resulted from hydrophobic interaction. The binding enthalpy (Fig. 2n) was found to be negative within the temperature range studied which indicates that the reaction was enthalpically driven. The ΔH values became slightly more negative (−22.88 to −26.17 kcal mol−1) on increasing the temperature and the plot of ΔH vs. T yielded the very small negative value for ΔCP (−170.8 cal mol−1 K−1) from the slope of a linear least-squares fit (R = 0.99) (Fig. 2o).38 Small negative ΔCP indicates the contribution of hydrophobic interaction perhaps resulting in the burial of non-polar amino acid residues within the peptide–heparin binding interface. This effect was more predominant at pH 4.0 with a negative ΔCP value being almost 20 times higher than ΔCP value at pH 7.4. It shows that hydrophobic interactions are a critical factor in the overall binding affinity of FHIP I.
The negative entropy shows unfavorable entropic contributions, which has an upward trend with the increasing temperature. This suggest that conformational entropy (negative contribution) must be dominant over solvation entropy (positive contribution).36 The more negative enthalpic contributions overcome unfavorable entropic contributions, which makes ΔG negative and the reaction feasible. ΔG values showed only small variation with temperature where favorable enthalpy is compensated by unfavorable entropy.
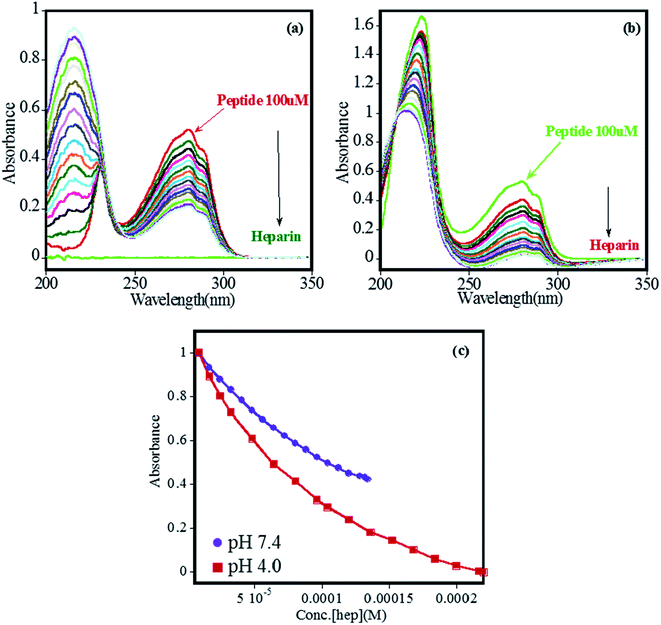
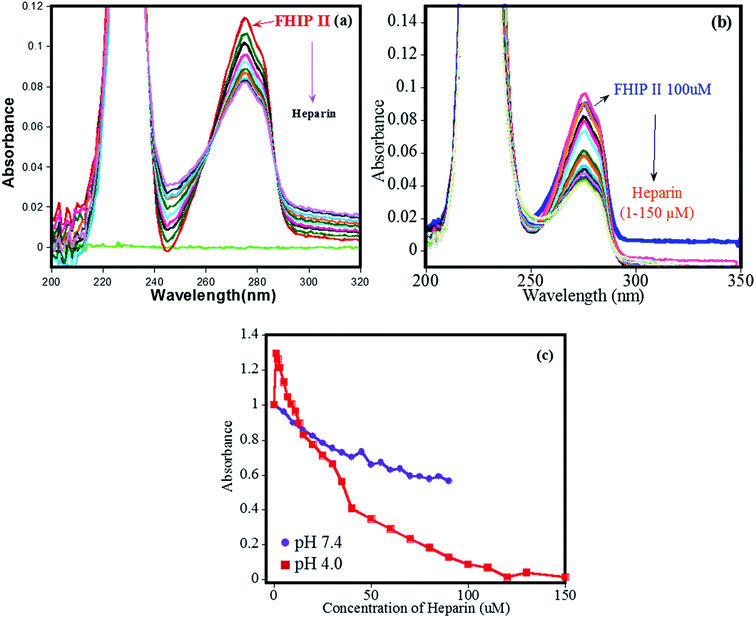
The binding of heparin–FHIP I association was further studied by UV-absorbance studies. Absorbance spectrum of FHIP I was recorded over a wide range of wavelengths (200–300 nm) and changes at λmax at 275 nm was observed on the addition of heparin at both the pHs (Fig. 3a–b). It was observed that binding of FHIP I with heparin resulted in a clear isosbestic point at 225 nm at pH 7.4, indicating the involvement of only one type of interaction, whereas, at pH 4.0, no clear isosbestic point indicates the presence the contribution of more than one type of interaction,39 including possible nonspecific mode. This was supported by ITC in Fig. 2, where we found two types of complexes at pH 4.0. In Fig. 3c the plot of absorbance vs. concentration of heparin clearly suggests better binding at pH 4.0 compared to pH 7.4, in agreement with ITC.
Interaction of heparin with FHIP II
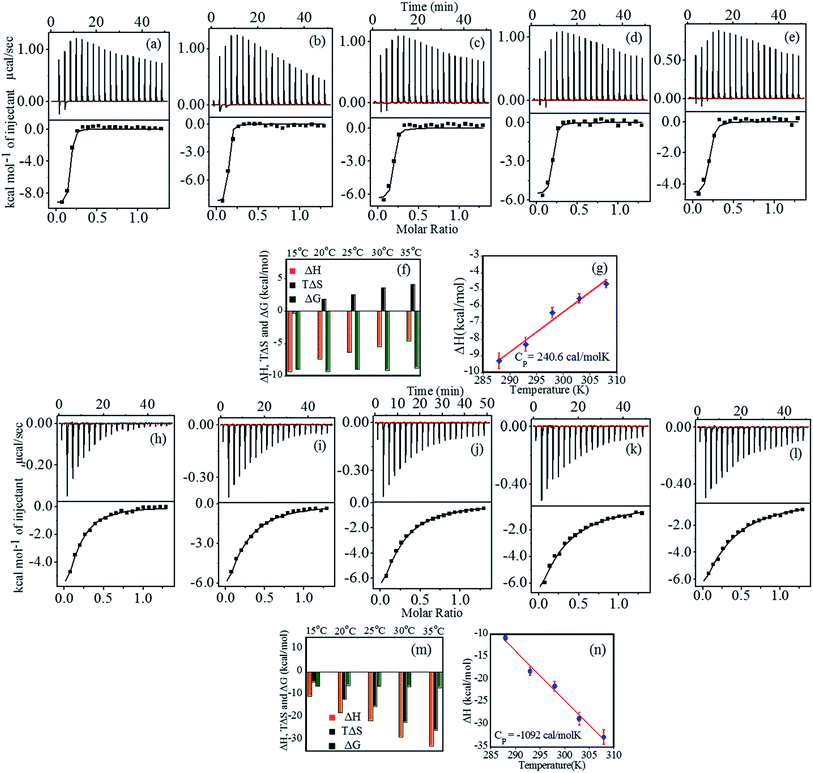
Interaction between FHIP II and heparin at pH 4.0 was performed using ITC at different temperatures (15 °C to 35 °C). Fig. 4a–e (upper panel) shows the representative raw ITC profiles resulting from the titration of FHIP II with heparin. Thermodynamic parameters are listed in Table 3. The binding enthalpy was found to be negative (−9.3 to −4.66 kcal mol−1), which became less negative on increasing the temperature (Fig. 4f). The entropy (TΔS) value was slightly negative at 15 °C which turned more positive at a higher temperatures (−0.3 to 4.2 kcal mol−1). The binding affinity (KA) decreased slightly on increasing the temperature (7.0 × 10⁶ M−1 to 2.45 × 10⁶ M−1). At 15 °C the reaction was enthalpically driven, whereas at higher temperatures it was enthalpically as well as entropically driven (Table 3). The ΔCP obtained from Fig. 4g is +240.6 cal mol−1 K−1. The positive heat capacity can be assigned to the exposure of the hydrophobic groups to the aqueous environment upon complex formation. This also is a signature of electrostatic and specific H-bonding interaction driving the complex formation, which can be attributed to the presence of charged amino acids such as Arg and Lys in the FHIP II.| Temperature (K) | N | ΔH (kcal mol−1) | TΔS (kcal mol−1) | aΔG (kcal mol−1) | aKA |
|---|---|---|---|---|---|
| a Errors were about 15 to 20% in KA and ΔG. | |||||
| 288 | 0.15 ± 0.003 | −9.3 ± 0.31 | −0.3 | −9.02 | 7.0 × 10⁶ |
| 293 | 0.14 ± 0.01 | −7.4 ± 0.67 | 1.9 | −9.3 | 9.2 × 10⁶ |
| 298 | 0.17 ± 0.006 | −6.4 ± 0.38 | 2.6 | −9.02 | 4.12 × 10⁶ |
| 303 | 0.17 ± 0.004 | −5.5 ± 0.22 | 3.6 | −9.13 | 4.6 × 10⁶ |
| 308 | 0.18 ± 0.006 | −4.6 ± 0.25 | 4.2 | −8.8 | 2.45 × 10⁶ |
Fig. 4h–l represents the calorimetric profiles for binding between FHIP II and heparin (15 °C to 35 °C) at pH 7.4. The binding enthalpy was found to be negative at 15 °C, which became more negative (−10.8 to −32.8 kcal mol−1) on increasing the temperature (Table 4). The TΔS was also negative (−4.5 to −25.8 kcal mol−1) accounting for the unfavorable entropic contributions. Thus the binding was basically dominated by favorable ΔH. The negative entropy suggested the role of conformational entropy, which restricted the rotational freedom of the heparin–FHIP II complex.35 N value obtained was found to be 0.15, signifying that 6–7 molecules of FHIP II bind to 1 molecule of heparin. All the binding parameters are compared as shown in Fig. 4m. ΔCP was determined to be negative (−1092.0 cal mol−1 K−1) for the FHIP II attributing to the typical hydrophobic effects in the interactions (Fig. 4n). The KA and ΔG values showed very slight temperature dependence. The KA at pH 7.4 is about 100 times lower than pH 4.0, which may have its origin in the possible role of electrostatic and hydrogen bonding interaction in the binding. A negative ΔCP at pH 7.4 versus positive at pH 4.0 further supports this.
| Temperature (K) | Nb | ΔH (kcal mol−1) | TΔS (kcal mol−1) | aΔG (kcal mol−1) | aKA × 104 |
|---|---|---|---|---|---|
| a Errors were about 15 to 20% in KA and ΔG.b Errors not shown as parameters was constrained. | |||||
| 288 | 0.15 | −10.8 ± 0.3 | −4.5 | −6.3 | 8.53 ± 0.56 |
| 293 | 0.15 | −18.1 ± 0.3 | −12.1 | −6.0 | 4.08 ± 0.16 |
| 298 | 0.15 | −21.5 ± 0.3 | −15.2 | −6.3 | 3.59 ± 0.09 |
| 303 | 0.15 | −28.7 ± 0.7 | −22.2 | −6.5 | 2.38 ± 0.1 |
| 308 | 0.15 | −32.8 ± 0.6 | −25.8 | −7.0 | 1.9 ± 0.06 |
Here, since arginine and lysine have high pKa (10 and 12, respectively),12 and their side chains remain positively charged at pHs under study, these residues are unlikely to play any significant role in a decreased affinity of FHIP I and FHIP II at pH 7.4 compared to 4.0. Therefore, to understand this further, we focused on the pH-dependent conformational status of free heparin using CD. It is evident from Fig. 5a that the free heparin showed a broad minimum between 208 nm and 214 nm, which is a clear sign of the presence of helical structures.40 The helical content of heparin was found to be reduced at pH 7.4 compared to pH 4.0, which would suggest an alteration in heparin structure. Heparin is a negatively charged structure due to the presence of sulfate and carboxylate moieties, which gets protonated at lower pH, resulting in more structured helical arrangement. An altered heparin conformation at pH 7.4 may be less suitable for its interaction with FHIP I or FHIP II, resulting in its reduced binding (Fig. 5b and c), also supported by ITC. Previously, a complete loss of binding for heparin was observed at extreme alkaline pH.21 CD spectrum for free peptide around 200 nm showed the presence of a random coil structure (data not shown). Therefore, it can be concluded that the reduced intensity of CD spectrum of the FHIP I/FHIP II–heparin complex at higher pH (Fig. 5c) is due to the unfavorable conformation of heparin at that pH.41
 | ||
| Fig. 5 CD spectrum carried from 200 nm to 260 nm at pH 4.0 and 7.4 for (a) heparin, (b) FHIP I–heparin complex and (c) FHIP II–heparin complex. | ||
The binding of heparin–FHIP II by UV-absorbance studies is shown in Fig. 6a–b. The presence of sharp isobestic points at pH 4.0 at 265 nm and 285 nm indicates the involvement of only one type of interaction.39 On the contrary, at pH 7.4, there are no such isobestic points, indicating the presence of non-specific mode of binding between FHIP II and heparin. The higher binding capacity of FHIP II observed in Fig. 6c is in excellent agreement with ITC.
Interaction of heparin with FN
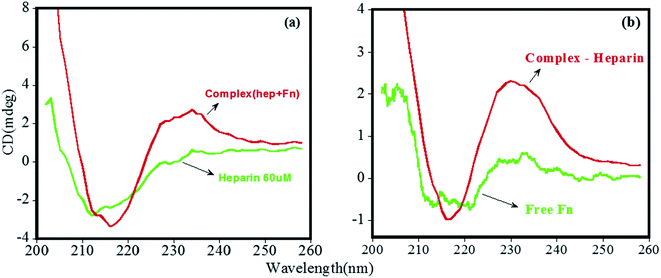
Due to the limited commercial availability of FN protein, we performed select experiments to get insights into its heparin-binding phenomenon. Fig. 7a displayed the CD spectra of free heparin and its complex with FN. The complex has a broad positive peak between 220 nm and 240 nm resulting from the involvement of intermolecular disulfide bonds present in the domain I and II as well as the two intramolecular disulfide bridges that connect the two fibronectin units.40,42,43 CD of Free FN (Fig. 7b) showed a characteristic broad minimum between 212 and 218 nm, which arises due to the presence of β-structure in native FN.44 The spectrum of heparin-bound FN, which was obtained by subtracting the spectrum of free heparin from the FN–heparin complex (Fig. 7b), was changed significantly, suggesting that heparin altered the structure of FN upon complex formation.45 Also, the increase in the positive peak at 230 nm for heparin-bound FN indicates the stabilization of the disulfide group in FN as a result of heparin-binding.46,47TEM micrographs were used to study the dimensions and shape of FN when complexed with heparin. Fig. 8a shows the view of FN molecules, which appear in the form of fibrils and exhibited folded domains on their extended arms. Images are also consistent with the previous structure of FN.48 The TEM image of free heparin in Fig. 8b shows spherical morphology with the particle size in the range of 2–10 nm.21 Interestingly, the FN on complexation with heparin showed a major change in protein morphology with the roughly embedded structures, which indicate that heparin molecules are bound to FN (Fig. 8c). Also, it can be seen that some of the heparin is in an unbound form.
Temperature-induced stability of FN in the presence of heparin
The melting studies of FN in the presence and absence of heparin gives two-step transition demonstrated using a plot of wavelength vs. temperature in Fig. 9. It implies that different domains of FN have different stability against temperature denaturation, which helped to distinguish the three domainial structures of FN. In the first transition (Tm = 52 °C), it shows a remarkable red shift from 329 nm to 343 nm with an increase of temperature, which could be due to Trp residues being exposed at a higher temperature. The absence of the disulfide linkages in the domain III makes it unstable towards increased temperature and thus chances of its unfolding are faster in the first transition, which enabled to distinguish the first transition as domain III of FN. Further increase in temperature led to a second (Tm = 63 °C) and third transition (Tm = 70 °C), which were more resistant towards protein unfolding.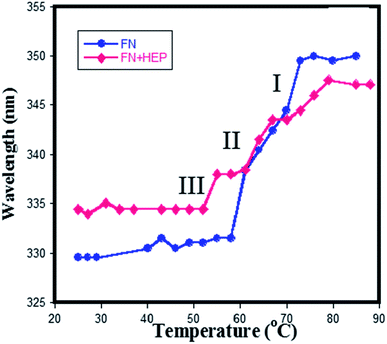 | ||
| Fig. 9 Plot wavelength vs. temperature obtained from the melting of (♦) only FN (●) heparin–FN complex at pH 7.4. | ||
In the presence of heparin, the melting temperature has shifted only for the first transition (lower) and for the third transition (higher). Since the first transition is designated as domain III, the third transition should correspond to the domain I, as heparin is known to bind only a domain I and III of plasma FN. Thus, no changes were observed in the second transition of a protein in the presence of heparin, confirming the second transition belonging to domain II of the protein.
Mid-point of transition I (domain III) for free protein was observed at 335 nm and for a complex at 330 nm i.e. there is a blue shift in the emission spectra, indicating that the Trp in the domain III are buried in the hydrophobic environment, resulting into its more folded structure when heparin binds to FN. Since FHIP I and FHIP II are derived from domain III14, it supports the fact that heparin is involved in specific interaction with this part of domain III. The binding affinity of heparin with FN was reported to be around ∼106 mol−1.49 On the contrary, transition III (domain I) for free protein occurred at 347 nm and for complex occurred at 350 nm showing more exposed Try in domain I upon binding of heparin. In separate studies, it was reported that domain III (III12,13,14) of FN shows a maximum binding affinity for heparin.50 To conclude, fluorescence melting suggested the strong interaction of heparin with domain III14. Interestingly, FHIP I and FHIP II sites are close to each other and may contribute to forming a single binding surface in III14. Thus, domain III14 has two independent binding sites, which could be brought together promoting heparin binding.
KI quenching studies of FN were performed in the presence and absence of heparin (Fig. S1a, b, S2a and b†) to determine the surface accessibility of Trp in FN. FN quenching by KI gives lower Ksv values (Fig. S1c and Table S1†) in the absence of heparin, indicating that KI has limited access to Trp as all the Trp are buried inside the hydrophobic core of the protein.51 In the presence of heparin, Ksv values do not change indicating that heparin-binding to FN does not lead to an overall change in the environment of Trp. As was also seen in the temperature-dependent study (Fig. 9), domain III folds, whereas domain I partially unfolds as a result of heparin binding. This implies that Trp in domain I become partially exposed, and in domain III, they become buried upon heparin-binding. However, the average Trp exposure to a solvent remains the same, resulting in no change in the overall KI quenching.
Molecular docking and MD simulation
Based on experimental results, it was concluded that 10–12 saccharides bind per peptide molecule. Therefore, we used dodecasaccharide structure available in PDB to perform its molecular docking study with two different sites (FHIP I and FHIP II) in fibronectin Hep-II domain. The GOLD software was used to predict the docking scores of the complexes. The GOLD score for the site 1 (FHIP I) and site 2 (FHIP II) was 49.14 and 72.12, respectively. The protein–ligand complexes were analyzed using Pymol. Fig. 10 shows the docking pose of the ligand (dodecasaccharide) with FHIP I (Fig. 10a) and FHIP II (Fig. 10b).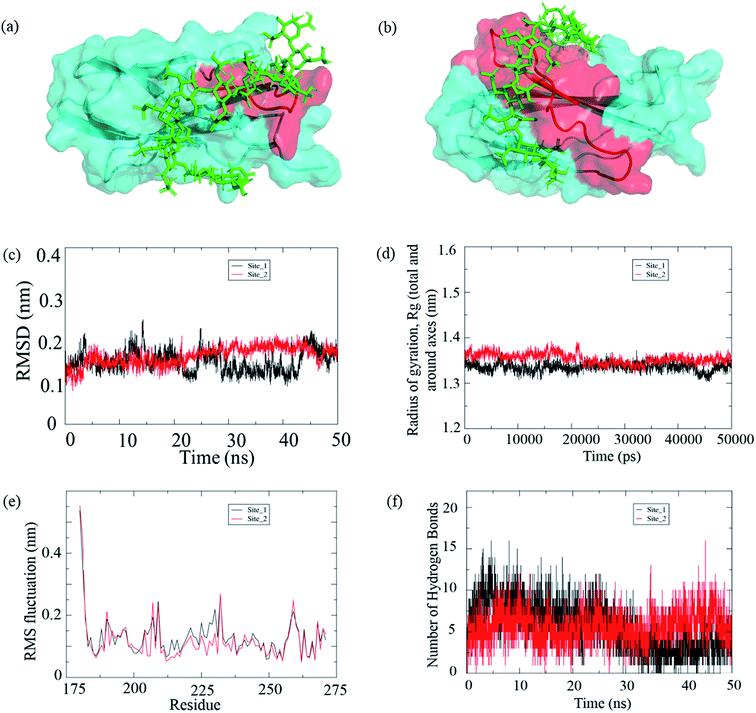 | ||
| Fig. 10 (a) Ligand (dodecasaccharide (PDB: 1HPN); green) bound to the F14 (PDB: 1FNH) domain with FHIP I shown in red as the active site, (b) ligand (dodecasaccharide; green) bound to the F14 domain with FHIP II shown in red as the active site; (c–f) molecular dynamics simulation of the complexes (c) RMSD of the two complexes, site 1 represents the complex with FHIP I as active site and site 2 represents the complex with FHIP II as the active site (d) radius of gyration (e) C-alpha RMSF graph and (f) hydrogen bonds between protein and ligand. | ||
It is well known that accurately describing the bimolecular interactions using computational techniques are difficult, which needs an excellent atomic-level understanding of the system. Often, the choice of force field parameters during MD simulation may affect the predicted structural properties. The limitations of the molecular mechanics force field still exist. They lack the ability to accurately capture subtle and weak interactions in the biomolecules to determine correct distribution of conformational ensembles. Usually in a biological system, the ligand-free binding pocket of protein is occupied by water molecules with few hydrogen bonds resulting in imperfect hydration of the critical residues. These water molecules are modulated during ligand binding. Hence, the solvent water has major impact on ligand binding and energetics.52 We have used the TIP3P model in our study along with the AMBER force filed. The water model is a 3-point model having an angle of 104.5° with a rigid geometry matching that of actual water molecules. However, this model is suitable for simulation while using the AMBER99SB force field.53
In order to confirm and compare the stability of both the complexes, we carried out a MD simulation of 50 ns, and the protein–ligand complex stability throughout the trajectory was analyzed. After running a 50 ns simulation for both the complexes, it was observed that the complexes were stable and reached a plateau. Also, we could find a consistency with the experimental results; hence, we stopped at 50 ns simulation time. The root mean square deviation (RMSD) for the complex with site 1 (FHIP I) shows deviations between 20 to 40 ns whereas, the site 2 (FHIP II) complex shows relatively stable graph throughout the 50 ns simulation (Fig. 10c and S6†). The radius of gyration (Rg) is the measure of structural stability and compactness of the protein. The Rg value for the protein was between 1.3 nm to 1.4 nm for both the complexes (Fig. 10d). In the initial trajectory analysis, we found that the RMSD and the gyration time plot had reached a plateau. Therefore, the comparison between these complexes could be reliable. The root mean square fluctuations (RMSF) of residues in the F14 domain were analyzed throughout the trajectory (Fig. 10e). When the major residue fluctuations were compared between FHIP I (203–210) and FHIP II (216–235), it was observed that fluctuation in both the peptides were in the same range. The hydrogen bonding interaction between the protein and ligand throughout the simulation was analyzed. The number of hydrogen bonds between the protein and dodecasaccharide were constant for the complex with FHIP II whereas, for FHIP I complex the hydrogen bond number decreased (Fig. 10f) during the last 20![[thin space (1/6-em)]](https://www.rsc.org/images/entities/char_2009.gif) 000 ps (30 to 50 ns). Hence, the molecular docking and MD simulation results show that the interaction of dodecasaccharide is stronger and stable with the FHIP II peptide in the F14 domain of FN.
000 ps (30 to 50 ns). Hence, the molecular docking and MD simulation results show that the interaction of dodecasaccharide is stronger and stable with the FHIP II peptide in the F14 domain of FN.
Conclusions
Here, we have investigated the interaction of two peptides (FHIP I and FHIP II) of FN originating from domain III14 of HEP II, which has important role in regulating FN function. Previously, FHIP I has been shown promoting focal adhesion assembly.1 There, it was emphasized that specific sequence of FHIP I is a necessity for the underlined biological activity of FN. FHIP II can also contribute to heparin-binding owing to the presence of a basic amino acid cluster. In spite of so much interest, there is a lack of structural and thermodynamic information on the interaction of these peptide sequences with heparin. In the present paper, using a thorough experimental and simulation studies, we have tried to provide specified conclusions about the molecular basis of binding of these peptides with heparin.Firstly, the observed binding affinities of FHIP I and FHIP II for heparin in this study are comparable to that of HEP II from where they originate.10 Heparin is expected to interact with Arg and Lys of FHIP I or FHIP II that are found to be exposed on the surface of FN through ionic and H-bonding interactions. Thus, the much higher binding affinity of FHIP II (∼107 mol−1) than FHIP I (∼106 mol−1) (Tables 1 and 3) is due to its ability to form strong, specific H-bonding interactions using Arg and Lys residues with heparin, supported by the enthalpically driven binding in ITC. The results were further supported by the MD simulation data, which showed that the number of hydrogen bonds for heparin–FHIP II complex were constant throughout the simulation, whereas for FHIP I complex the hydrogen bond number decreased (Fig. 10f and S6†) towards the end of simulation. This is further buttressed by the existence of a positive ΔCP for FHIP II, which indicates the burial of polar residues at the binding interface involved in specific H-bonding interactions. Earlier, similar studies on the binding of heparin with brain natriuretic peptide resulted in a positive ΔCP. The study also concluded that H-bonding drove 94% of the interactions.20 Several other proteins have been reported to form such specific interactions with heparin.21,54
Conversely, the interactions resulted in negative ΔCP values for FHIP I at both the pHs. A negative ΔCP is generally derived from the non-polar buried surface area, having strong implications in weak, hydrophobic interaction in complex formation.5 Thus, the resultant FHIP I–heparin complex may have hydrophobic residues buried within its binding surface. The hydrophobic part in side chains of lysine and arginine can also contribute to the hydrophobic interactions with the heparin backbone. The hydrophobic parts of heparin are limited to the acetamide group (39), giving a narrow contribution to the binding. The heat capacity values are in a similar range as observed for other proteins binding to heparin.55 Also, the observed pH dependent-binding of FHIP I or FHIP II can not be correlated with peptide sequence since Arg and Lys residues present in these sequences have pKa much higher that the pH conditions used here. In fact, the lower affinity for either peptide at higher pH (Table 2) was attributed to weak helical structure of heparin as observed in CD (Fig. 5a).
It can be concluded that FHIP I and FHIP II provide all the structural and thermodynamic elements necessary for binding of HEP II with heparin. The reasonably tight interaction between these peptides of FN and heparin may provide a clue about their biological role in cell adhesion activity, and allow the design of inhibitors or agonists of FN. Subsequently, it can be concluded that FHIP II could be a better location for therapeutic intervention in cell adhesion activity by FN.
Conflicts of interest
There are no conflicts to declare.Acknowledgements
This work was supported by grants from DST-SERB, UPEII-JNU, DST-Purse-JNU and DST-FIST, DST-DPRP. NT acknowledges fellowship support from UGC. We also thank AIRF for instrument facility.References
- A. Woods, J. B. McCarthy, L. T. Furcht and J. R. Couchman, Mol. Biol. Cell, 1993, 4, 605–613 CrossRef CAS PubMed.
- D. Missirlis, T. Haraszti, H. Kessler and J. P. Spatz, Sci. Rep., 2017, 7, 3711 CrossRef PubMed.
- R. Pankov and K. M. Yamada, J. Cell Sci., 2002, 115, 3861–3863 CrossRef CAS PubMed.
- Y. Attieh, A. G. Clark, C. Grass, S. Richon, M. Pocard, P. Mariani, N. Elkhatib, T. Betz, B. Gurchenkov and D. M. Vignjevic, J. Cell Biol., 2017, 216, 3509–3520 CrossRef CAS PubMed.
- A. Sharma, J. A. Askari, M. J. Humphries, E. Y. Jones and D. I. Stuart, EMBO J., 1999, 18, 1468–1479 CrossRef CAS PubMed.
- K. L. Bentley, R. J. Klebe, R. E. Hurst and P. M. Horowitz, J. Biol. Chem., 1985, 260, 7250–7256 CAS.
- X. Zhong, O. Arnolds, O. Krenczyk, J. Gajewski, S. Pütz, C. Herrmann and R. Stoll, Biochemistry, 2018, 57, 6045–6049 CrossRef CAS PubMed.
- M. J. Benecky, C. G. Kolvenbach, D. L. Amrani and M. W. Mosesson, Biochemistry, 1988, 27, 7565–7571 CrossRef CAS PubMed.
- M. Carpentier, A. Denys, F. Allain and G. Vergoten, Glycoconjugate J., 2014, 31, 161–169 CrossRef CAS PubMed.
- L. I. Gold, B. Frangione and E. Pearlstein, Biochemistry, 1983, 22, 4113–4119 CrossRef CAS PubMed.
- G. Giancarlo, Medicines, 2019, 6, 1–26 Search PubMed.
- I. Capila and R. J. Linhardt, Angew. Chem., Int. Ed. Engl., 2002, 41, 391–412 CrossRef.
- M. Rusnati, D. Coltrini, P. Caccia, P. Dell'Era, G. Zoppetti, P. Oreste, B. Valsasina and M. Presta, Biochem. Biophys. Res. Commun., 1994, 203, 450–458 CrossRef CAS.
- T. Logue, M. Lizotte-Waniewski and K. Brew, FEBS Lett., 2020, 594(1), 94–103 CrossRef CAS.
- K. T. Yip, X. Zhong, N. Seibel, O. Arnolds, M. Schöpel and R. Stoll, Biointerphases, 2017, 12, 02D415 CrossRef PubMed.
- C. Tanmay, M. Mrinal, D. Ananya, B. Kalishankar, D. Ayan and M. K. Prasun, J. Phys. Chem. B, 2016, 120, 2187–2197 CrossRef PubMed.
- J. R. Fromm, R. E. Hileman, E. E. Caldwell, J. M. Weiler and R. J. Linhardt, Arch. Biochem. Biophys., 1997, 343, 92–100 CrossRef CAS PubMed.
- T. Goel, S. Kumar and S. Maiti, Mol. BioSyst., 2013, 9, 88–98 RSC.
- E. Gonçalves, E. Kitas and J. Seelig, Biochemistry, 2006, 45, 3086–3094 CrossRef PubMed.
- R. E. Hileman, R. N. Jennings and R. J. Linhardt, Biochemistry, 1998, 37, 15231–15237 CrossRef CAS PubMed.
- N. Tiwari, A. Srivastava, B. Kundu and M. Munde, J. Mol. Recognit., 2018, 31 Search PubMed.
- J. B. McCarthy, M. K. Chelberg, D. J. Mickelson and L. T. Furcht, Biochemistry, 1988, 27, 1380–1388 CrossRef CAS PubMed.
- J. L. Lau and M. K. Dunn, Bioorg. Med. Chem., 2018, 26, 2700–2707 CrossRef CAS PubMed.
- K. Hozumi, K. Nakamura, H. Hori, M. Miyagi, R. Nagao, K. Takasaki, F. Katagiri, Y. Kikkawa and M. Nomizu, BioRes. Open Access, 2016, 5, 356–366 CrossRef CAS PubMed.
- N. Tanwar and M. Munde, Int. J. Biol. Macromol., 2018, 112, 1084–1092 CrossRef CAS PubMed.
- S. Gupta, N. Tiwari and M. Munde, Sci. Rep., 2019, 9, 5891 CrossRef PubMed.
- G. Jones, P. Willett, R. C. Glen, A. R. Leach and R. Taylor, J. Mol. Biol., 1997, 267, 727–748 CrossRef CAS PubMed.
- N. M. O'Boyle, M. Banck, C. A. James, C. Morley, T. Vandermeersch and G. R. Hutchison, J. Cheminf., 2011, 3, 33 Search PubMed.
- H. J. C. Berendsen, D. van der Spoel and R. van Drunen, Comput. Phys. Commun., 1995, 91, 43–56 CrossRef CAS.
- V. Hornak, R. Abel, A. Okur, B. Strockbine, A. Roitberg and C. Simmerling, Proteins, 2006, 65, 712–725 CrossRef CAS PubMed.
- A. W. Sousa da Silva and W. F. Vranken, BMC Res. Notes, 2012, 5, 367 CrossRef PubMed.
- J. E. Ladbury, J. G. Wright, J. M. Sturtevant and P. B. Sigler, J. Mol. Biol., 1994, 238, 669–681 CrossRef CAS PubMed.
- E. Ortiz-Salmerón, C. Barón and L. García-Fuentes, FEBS Lett., 1998, 435, 219–224 CrossRef.
- A. Velazquez-Campoy, M. J. Todd and E. Freire, Biochemistry, 2000, 39, 2201–2207 CrossRef CAS.
- N. R. Syme, C. Dennis, S. E. Phillips and S. W. Homans, Chembiochem, 2007, 8, 1509–1511 CrossRef CAS PubMed.
- D. J. Samuel, P. Lauren, D. S. Matthew and C. J. Aaron, J. Therm. Anal. Calorim., 2017, 127 Search PubMed.
- A. Basu, P. Jaisankar and G. Suresh Kumar, Bioorg. Med. Chem., 2012, 20, 2498–2505 CrossRef CAS PubMed.
- I. Haq, J. E. Ladbury, B. Z. Chowdhry, T. C. Jenkins and J. B. Chaires, J. Mol. Biol., 1997, 271, 244–257 CrossRef CAS PubMed.
- K. B. Kale and D. P. Ottoor, Luminescence, 2019, 34, 39–47 CrossRef CAS PubMed.
- A. Biswas, R. K. Swarnkar, B. Hussain, S. K. Sahoo, P. I. Pradeepkumar, G. N. Patwari and R. Anand, J. Phys. Chem. B, 2014, 118, 10035–10042 CrossRef CAS PubMed.
- R. Cerpa, F. E. Cohen and I. D. Kuntz, Folding Des., 1996, 1, 91–101 CrossRef CAS PubMed.
- C. A. Fitch, G. Platzer, M. Okon, B. E. Garcia-Moreno and L. P. McIntosh, Protein Sci., 2015, 24, 752–761 CrossRef CAS PubMed.
- S. Patel, A. F. Chaffotte, B. Amana, F. Goubard and E. Pauthe, Int. J. Biochem. Cell Biol., 2006, 38, 1547–1560 CrossRef CAS PubMed.
- U. Anand, C. Jash and S. Mukherjee, J. Phys. Chem. B, 2010, 114, 15839–15845 CrossRef CAS PubMed.
- L. Jendeberg, M. Tashiro, R. Tejero, B. A. Lyons, M. Uhlén, G. T. Montelione and B. Nilsson, Biochemistry, 1996, 35, 22–31 CrossRef CAS PubMed.
- M. Goodman and C. Toniolo, Biopolymers, 1968, 6, 1673–1689 CrossRef CAS PubMed.
- R. C. Hider, G. Kupryszewski, P. Rekowski and B. Lammek, Biophys. Chem., 1988, 31, 45–51 CrossRef CAS PubMed.
- H. Lin, R. Lal and D. O. Clegg, Biochemistry, 2000, 39, 3192–3196 CrossRef CAS PubMed.
- Sachchidanand, O. Lequin, D. Staunton, B. Mulloy, M. J. Forster, K. Yoshida and I. D. Campbell, J. Biol. Chem., 2002, 277, 50629–50635 CrossRef CAS PubMed.
- D. Carstanjen, P. Dutt and T. Moritz, J. Virol., 2001, 75, 6218–6222 CrossRef CAS PubMed.
- R. M. Srikumar, R. S. Satinder, C. Amitabha and L. K. Anil, Biophys. J., 1999, 76, 1469–1479 CrossRef.
- J. Schiebel, R. Gaspari, T. Wulsdorf, K. Ngo, C. Sohn, T. E. Schrader, A. Cavalli, A. Ostermann, A. Heine and G. Klebe, Nat. Commun., 2018, 9, 3559 CrossRef PubMed.
- N. T. Truc, V. M. Hoang and L. S. Mai, Sci. World J., 2014, 2014, 1–14 Search PubMed.
- H. V. Patel, A. A. Vyas, K. A. Vyas, Y. S. Liu, C. M. Chiang, L. M. Chi and W. Wu, J. Biol. Chem., 1997, 272, 1484–1492 CrossRef CAS.
- D. Chandler, Nature, 2002, 417(6888), 491 CrossRef CAS.
Footnote |
| † Electronic supplementary information (ESI) available. See DOI: 10.1039/d0ra01773f |
| This journal is © The Royal Society of Chemistry 2020 |

