DOI:
10.1039/D0RA01852J
(Paper)
RSC Adv., 2020,
10, 17918-17929
Polymer-assisted synthesis and applications of hydroxyapatite (HAp) anchored nitrogen-doped 3D graphene foam-based nanostructured ceramic framework
Received
27th February 2020
, Accepted 14th April 2020
First published on 11th May 2020
Abstract
In the present work, a hydroxyapatite anchored nitrogen-doped three-dimensional graphene (HAp-N3DG) skeletal network (foam) based nanostructured ceramic framework (CF) was developed through a polymer-assisted solvothermal route. Field emission scanning electron microscopy (FESEM) and transmission electron microscopy (TEM) studies reveal that the nano sized 0D HAp particles are anchored on the N3DG skeletal network with an average size of less than 50 nm. EDX and X-ray photoelectron spectroscopy (XPS) analysis confirmed the presence of Ca, P, O, N, and C. In addition, XPS analysis reveals the existence of N–C bonds in the prepared sample. The X-ray diffraction (XRD) patterns indicate the presence of hexagonal phase hydroxyapatite and the calculated average crystallite size was found to be 12 nm. The developed HAp-N3DG foam based nanostructured CF was found to have a mesoporous structure and the measured specific surface area (SSA) and the mean pore diameter were found to be 64.73 m2 g−1 and 23.6 nm, respectively. Electrochemical analysis shows that HAp anchored on nitrogen-doped 3D graphene foam based nanostructured CF has moderate electrochemical activity towards lithium ion charge/discharge. In addition, the prepared material showed adsorption activity values of 204.89 mg g−1 and 243.89 mg g−1 for the volatile organic compounds (VOCs) benzene and toluene, respectively. The present findings suggest that the newly developed HAp anchored nitrogen-doped 3DG (HAp-N3DG) skeletal network (foam) based nanostructured CF material can be used in energy devices and in the removal of volatile organic compounds. Moreover, the present study initiates a new kind of approach in energy device (lithium ion battery-LIB) research and in the removal of VOCs.
1. Introduction
Hydroxyapatite (Hap, Ca10(PO4)6(OH)2) is an inorganic ceramic material of the calcium phosphate family, which finds uses in different fields such as biomedical engineering, removal of heavy metals, photocatalysis, electrochemical sensors, energy devices, and adsorption studies.1–9 The constituents of HAp are calcium (Ca2+), phosphate (PO42−), and hydroxide (OH−) ions. These ions and the structure play a vital role in the transportation of electrons and storage of energy, and adsorption of toxic materials and pollutants.7,9 HAp is also a dielectric material with piezoelectric behaviour.4 Further, its ionic conductivity can be increased by doping with other materials.9 In recent years, the development of modern as well as efficient devices for a green and clean environment has become a tricky task because most of the industrial activities cause depletion of environmental resources and subsequent pollution. Hence, the worsening of these problems creates a vital demand for the development of environmentally benign energy storage devices and adsorbents.
Lithium ion batteries (LIBs) have played a significant role in the development of modern-portable electronic devices, electric vehicles, energy storage devices, consumer devices, and so on.10,11 Meanwhile, the growth of technologies and these devices emit several different kinds of volatile organic compounds (VOCs) into the surroundings (environs), which are harmful to human beings, other living organisms, and the environment.12 The manufacturing, handling, and distribution processes involved in chemical industries are the major sources of VOCs. The examples of such industries are foundries and industries that manufacture paints, liquid fuels, petrochemicals, cosmetics, detergents, lubricants, and pesticides. Among the different kinds of VOCs, benzene and toluene are considered hazardous in view of their harmful effects to living things and the environment.13–15 The associated environmental problems are acid rain, ground-level ozone effects on plant growth, and so on. Further, adverse health implications such as central nervous system disorder, headache, dizziness, cognitive impairment, vision and hearing loss, allergic skin reactions, and diseases of the kidney, liver, and reproductive system are also caused in human beings and animals.13–15 The removal of VOCs has hence acquired great significance in view of the safety of living organisms and for a healthy environment.
In recent years, carbon-based materials have emerged as potential materials, which have a significant impact on energy storage and in the field of adsorption. For example, graphene (G), carbon nano tubes (CNTs), and carbon dots show improved electrochemical performance in energy storage and in the adsorption of volatile organic compounds (VOCs).12,16,17 Recently, Chandra et al. utilized nitrogen-doped carbon derived from polypyrrole functionalized graphene sheets for the selective removal of CO2.18 In addition, different types of graphene supported HAp play a key role in biomedical applications.19 However, among all the aforementioned carbon allotropes, the three-dimensional graphene (3DG foam) network is extremely light in weight, has excellent electrical conductivity, large internal surface area, high mechanical strength, macroscopic porous structure, good flexibility, and rapid mass and electron transport kinetics for lithium ions.17 Owing to these characteristics, the continuous and interconnected 3DG foam network is recognized as an excellent current collector for energy storage and conversion.17 Further, to enhance the intrinsic electrochemical activity of the 3DG foam network, hetero atoms such as nitrogen are doped into the 3DG network.20 Luo et al. developed nitrogen-doped graphene–hydroxyapatite hybrid material by using commercially purchased N-doped graphene powder for biomedical applications.21 In addition, hydroxyapatite supported nitrogen-doped carbon quantum dots (N-CQDs) are used for water splitting.22 More recently, Xie et al. successfully coated hydroxyapatite–calcium phosphate salt on the surface of 3D graphene foam by the electrochemical deposition method.23 In this study, the prepared HAp-calcium phosphate coating was observed to have a highly robust structure. In addition, self-assembled peptide nanofibers on graphene oxide nanosheets were used to grow hydroxyapatite crystals on their surface in SBF solution.24 However, there are no reports on the formation of nano HAp on nitrogen-doped 3D graphene (foam) skeletal structure through a facile technique without surfactants/chelates. Furthermore, there are no reports on the utilization of HAp anchored on nitrogen-doped 3D graphene (foam) skeletal structure (N-3DG) based nanostructured ceramic framework (CF) for energy storage applications and for the adsorption of volatile organic compounds.
Recently, hydroxyapatite nanowire-based separators were used in advanced lithium ion batteries.2 Magnesium ion incorporated hydroxyapatite was used as an electrode material for supercapacitor applications.4 Kawai et al. reported that the hydroxyapatite coating on organic substrates acted as a good adsorbent for the removal of the VOC formaldehyde.25 Nishikawa et al. reported the oxidative decomposition of VOCs such as toluene, ethyl acetate, and iso-propanol by using calcium-deficient HAp at high temperature.26 Xin et al. developed needle-like HAp and plate-like HAp for the thermal decomposition of VOCs such as ethyl acetate and reported that the plate-like HAp shows higher decomposition of the VOCs than the needle-like HAp.27 This is attributed to the larger number of –OH groups in the plate-like HAp that can produce more active radicals, which offer higher catalytic activity than the needle-like HAp.
The need to overcome energy scarcity is pushing us to concentrate on the development of a new kind of environmentally benign electrode material for LIBs. Meanwhile, the removal of VOCs also attracts much concern. Therefore, considering the unique characteristics of HAp and the nitrogen-doped 3D graphene foam, the formation of a new kind of HAp-N3DG (foam) skeletal network based nanostructured ceramic framework (CF) by coupling them is expected to make a better adsorbent for VOCs and a better anode material for LIBs. In the present study, we have reported the development of a new kind of HAp-N3DG (foam) skeletal network based nanostructured ceramic framework through a polymer-assisted solvothermal route for VOC adsorption and as an anode material for energy storage devices such as lithium ion batteries.
2. Materials and methods
2.1. Materials
All the chemicals were purchased from Shanghai Macklin Biochemical Co. Ltd (China) and Shanghai Richjoint Chemical Reagents Co. Ltd (China), and were used without further purification. 3D Graphene on nickel foam (1.0 mm thickness) was purchased from Six Carbon Technology Co. Ltd (China).
2.2. Ni etching on the 3D graphene foam
The 3D graphene on nickel foam was cut into several pieces of size 1 × 1 cm2 and immersed in 1 mol L−1 FeCl3 and HCl mixture solution at room temperature for 24 h. The foams were washed with distilled water and ethanol several times and dried at 65 °C in a hot air oven. The dried foams were placed in 3 mol L−1 HCl solution for 24 h to ensure that the residual Ni or Fe dissolved completely, were washed with distilled water and ethanol, and dried at 65 °C for 24 h in a hot air oven.
2.3. Preparation of HAp-N3DG nanostructured ceramic framework
Calcium acetate (Ca(CH3COO)2·H2O) and diammonium hydrogen phosphate ((NH4)2HPO4) were used as the calcium (Ca) and phosphate (P) precursor materials, in which the aliquot amount of the precursors (molar ratio 1![[thin space (1/6-em)]](https://www.rsc.org/images/entities/char_2009.gif) :0.6) was dissolved separately in ethylene glycol in order to maintain the stoichiometric ratio of HAp (the Ca/P molar ratio is 1.67). The pH of the phosphate ion solution was increased to 10.5 by the addition of 35% ammonium hydroxide. For nitrogen doping, 5 M urea was added to the calcium solution and stirred well. The phosphate containing solution was then transferred dropwise to the calcium solution and the resultant mixture was stirred vigorously. 0.5 g polyethylene glycol (PEG, MW 20000) was then added into the mixture and stirred. The resultant mixture was transferred to a 100 mL Teflon-lined stainless steel autoclave. Afterwards, ethylene glycol-cured Ni-etched 3D graphene foam was put into the abovementioned mixture. Finally, the autoclave was sealed well and placed inside a hot air oven at 180 °C for 24 h for further reaction, after which it was allowed to cool down naturally to room temperature. The obtained materials were washed with distilled water several times and dried at 100 °C in a vacuum oven. The schematic diagram (Fig. 1) illustrates the synthetic procedure followed in this study.
:0.6) was dissolved separately in ethylene glycol in order to maintain the stoichiometric ratio of HAp (the Ca/P molar ratio is 1.67). The pH of the phosphate ion solution was increased to 10.5 by the addition of 35% ammonium hydroxide. For nitrogen doping, 5 M urea was added to the calcium solution and stirred well. The phosphate containing solution was then transferred dropwise to the calcium solution and the resultant mixture was stirred vigorously. 0.5 g polyethylene glycol (PEG, MW 20000) was then added into the mixture and stirred. The resultant mixture was transferred to a 100 mL Teflon-lined stainless steel autoclave. Afterwards, ethylene glycol-cured Ni-etched 3D graphene foam was put into the abovementioned mixture. Finally, the autoclave was sealed well and placed inside a hot air oven at 180 °C for 24 h for further reaction, after which it was allowed to cool down naturally to room temperature. The obtained materials were washed with distilled water several times and dried at 100 °C in a vacuum oven. The schematic diagram (Fig. 1) illustrates the synthetic procedure followed in this study.
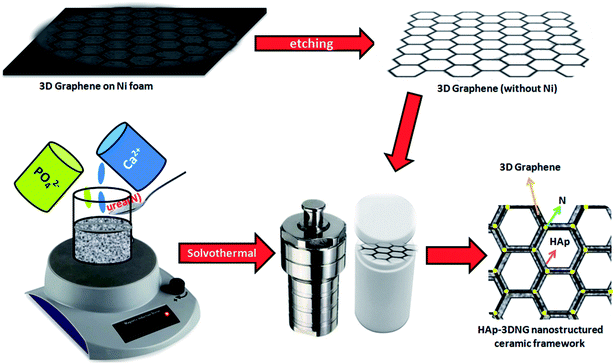 |
| | Fig. 1 Schematic illustration of the synthetic process of HAp anchored N3DG foam based nanostructured CF. | |
2.4. Electrochemical measurements
Electrochemical measurements were recorded by assembling half cells of CR2032 type coin cells, which were assembled in an argon filled glove box. The as-prepared HAp-N3DG ceramic framework samples were used directly as the working electrode without the addition of binding materials and conductive agents. Herein, Celgard 2600 was used as the separator, metallic lithium foil as the counter electrode, and 1 M LiPF6 (ethylene carbonate/diethyl carbonate 1:1 by volume) as the electrolyte. The galvanostatic charge–discharge experiment was conducted in a Land CT-2001A (Wuhan Blue Electronics Co., Ltd. China) battery system at the current densities of 0.2C and 1C in the voltage range between 0.01 V and 3 V (Li/Li+). The capacity values were based on the total mass of the active material. A CHI 660 E (Chenhua Ltd. Co., China) electrochemical workstation was used to record the cyclic voltammograms between 0.01 V and 3 V (vs. Li/Li+) at a 0.2 mV s−1 sweep rate. Electrochemical impedance spectroscopic (EIS) measurements were performed using an electrochemical workstation (Autolab 302 N) in the frequency range from 0.1 Hz to 106 Hz with 10 mV amplitude of the ac voltage.
2.5. Adsorption of volatile organic compounds (VOCs)
The adsorption isotherms of the VOCs, namely, benzene and toluene vapours, on the prepared samples (HAp-N3DG) were measured by using a standard static volumetric method with the help of a Belsorp-MAX volumetric gas adsorption instrument (Microtrac BEL Corporation, Japan) at 298 K. A stainless steel chamber with a hard seal and manual cut-off valve, which was attached in the place of the Psat tube, was used to generate the VOC vapour. The adsorption temperature was achieved and 35 mg sample was needed for each run. Before starting the experiment, all the samples (HAp-N3DG) were degassed under vacuum at 473 K for at least 8 h.
The adsorption measurement was carried out according to the standard static capacity method using a steam absorber from McKinley Bayer Co., Ltd, Japan. 20 mL of the benzene/toluene solution was taken in the stainless steel constant temperature volatilization chamber, and liquid nitrogen and boiling water were used to carry out three or more freeze–thaw cycles of the benzene/toluene solution to remove excess gas in the volatilization chamber. 30 to 50 mg of the adsorbent material was weighed accurately and subjected to vacuum degassing at 180 °C for 12 h, and the quality of the pre-treated material was noted. The sample tube containing the adsorbent material was kept in the adsorption test position and the position of the constant temperature water bath was adjusted so that the sample tube was submerged. Using the Antoine equation, log10P0 = AB/(T + C), the vapour pressure P0 (unit: mmHg) of the volatile organic compounds was calculated at the test temperature T. Here, A, B, and C are constants that are different for different substances and P0 is converted into the international unit kpa. The obtained P0 value is the saturated vapour pressure of the VOC gas at ambient temperature. 0.1 P0, 0.2 P0, 0.3 P0,…, 0.9 P0, and P0 were set as the air pressure value P to be measured. Finally, the adsorbed gas volume Va (unit: cm3 (STP) g−1) in the standard state corresponding to different pressures was obtained and the corresponding gas adsorption amount was obtained by using eqn (1).
Here,
Ma is the adsorption amount of the gas (mg g
−1) and
Mg is the relative molecular weight of the adsorbed gas. Taking
P/
P0 as the abscissa and the adsorption amount
Ma of the gas as the ordinate, the corresponding isothermal adsorption curve was drawn.
2.6. Material characterization techniques
X-ray diffraction (XRD) patterns were recorded using a Shimadzu XRD-6000 diffractometer with Cu-Kα (0.15406 nm) radiation. Renishaw Laser Raman spectrometer (Renishawin) with a 532 nm laser was utilized to record the Raman spectra. The morphological images (FESEM and TEM) were obtained with the help of a MERLIN compact field emission scanning electron microscope (ZEISS, GEMINI), a transmission electron microscope (Philips, Tecnai 12), and a FEI, Tecnai G2 F30 S-Twin field emission high resolution transmission electron microscopy (HRTEM). The elemental mapping was performed by energy dispersive spectroscopy (EDS, Oxford X-Max). X-ray photoelectron spectroscopy (XPS) was employed to record the surface electronic states with the help of a Thermo Fisher Scientific X-ray photoelectron spectroscopy spectrometer (ESCALAB 250Xi) with Al-Kα radiation. The nitrogen adsorption–desorption isotherms were recorded by a BELSORP-MAX volumetric gas adsorption instrument (Japan) using the Brunauer–Emmett–Teller (BET) method. The analysis environment was liquid nitrogen atmosphere (77 K). Degassing under vacuum was carried out at 180 °C for 12 h prior to testing.
3. Results and discussion
3.1. XRD analysis
The X-ray diffraction pattern of commercial 3D graphene on Ni foam is shown in Fig. 2a. All the obtained peaks corroborated with the standard values. The crystal phase of graphene (002) is observed as a broad peak at 2θ in the range of 20–23°. The other peaks obtained represented the existence of nickel in the foam. In Fig. 2b, a broad peak and few small peaks are observed at 20–23, 26.95, and 45.01° for nickel-etched 3D graphene. There were no other peaks observed in this pattern, which confirms that nickel was completely etched in the foam. The peak at 26.95° is attributed to the presence of graphitic carbon (002) plane (JCPDS card no: 75-1621). The XRD pattern of pure hydroxyapatite is shown in Fig. 2c. The characteristic peaks located at 26.08, 32.12, 33.04, 34.32, 39.86, 46.94, 49.74, and 53.36° correspond to the (002), (211), (112), (202), (310), (222), (231), and (004) planes, indicating the presence of hexagonal phase crystalline HAp in accordance with the JCPDS card no. 09-0432.8 The sharp peaks in the pattern reveal the good crystallinity of HAp. Fig. 2d shows the XRD pattern of HAp trussed on nitrogen-doped 3D graphene (foam) skeletal structure. The higher intensity of the peak reflects the higher crystallinity of HAp. The observed peaks matched with standard values that correspond to the JCPDS card no. 09-0432 and the calculated average crystallite size was 12 nm. The calculated lattice parameters a and c were found to be 9.4708 and 6.8516, respectively. The cell volume was 532.23 and the lattice density was 3.13 g cm−3. These values are in good agreement with that of bulk HAp (JCPDS 09 0432). A broad peak at 21.12° and two small peaks at 25.84 and 43.96° are attributed to graphene. In addition, it is noteworthy that the addition of nitrogen (N) has almost no influence on the phase structure of HAp and graphene; the plausible reason for this is that the nitrogen concentration was too low to be detected by XRD. This is confirmed by the absence of nitrogen peaks in the XRD spectrum.
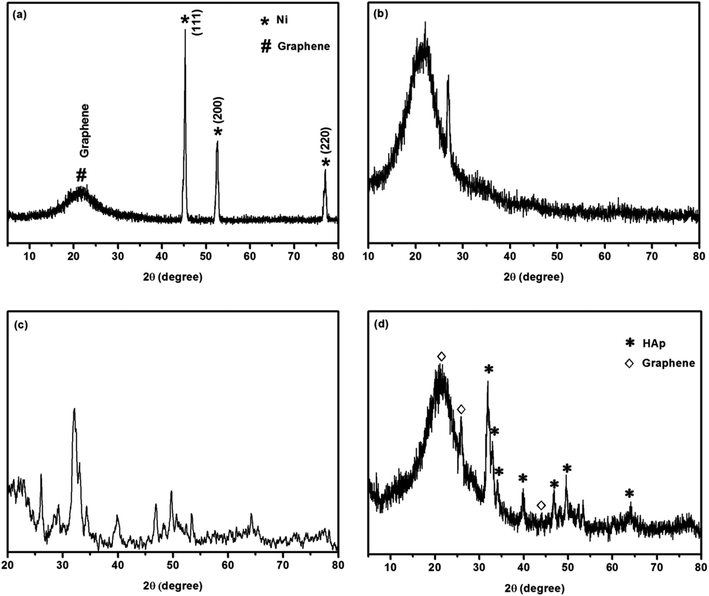 |
| | Fig. 2 XRD patterns of (a) 3D graphene on Ni foam, (b) Ni-etched 3D graphene foam, (c) pure hydroxyapatite, (d) hydroxyapatite on N-doped 3D graphene nanostructured ceramic framework. | |
3.2. Raman analysis
The Raman spectra of 3DG on Ni foam and HAp anchored N3DG nanostructured CF are shown in Fig. 3a and b, respectively. In Fig. 3a, three prominent peaks at 1352, 1580, and 2719 cm−1 and two minor peaks at 2447 and 3246 cm−1 are observed for the 3DG foam, which correspond to D, G, and 2D bands. The D band at 1352 cm−1 corresponds to vibrations of A1g symmetry of sp3 carbon atoms and its low intensity represents the small structural defects in 3D graphene on Ni foam. The G band at 1580 cm−1 reveals the in-plane vibration of E2g phonons of sp2 carbon atoms. The higher intensity of this peak strongly represents the foam fully made on graphene. A strong, high intensity peak observed at 2719 cm−1 is related to the second order 2D band, which is associated with the presence of more number of graphene layers on the Ni foam. Further, two second order bands are observed at 2447 cm−1 (D + D′′) and 3246 cm−1 (2D′).28 The Raman spectrum of HAp on N3DG foam is shown in Fig. 3b. The peaks at 431, 588, 962, and 1048 cm−1 are associated with the hexagonal HAp phase.6,26 The strongly intense peak at 962 cm−1 is ascribed to the characteristic symmetric stretching vibration of the phosphate group (PO43−). The peaks at 1343 and 1579 cm−1 are attributed to the existence of graphene and represent the K point phonons of A1g symmetry and zone centre phonons of E2g symmetry of the graphitic materials, respectively.29 The peak positions are slightly shifted to lower wave numbers and the intensity of the peaks are also reduced due to disorder/defects in the graphene network structure; this is due to nitrogen doping on the graphene network structure. The presence of HAp nanoparticles on the surface of the N3DG network also causes stress on N3DG. Hence, the peak positions are slightly shifted to lower wave numbers and the peak intensities are reduced. Moreover, the 2D band at 2719 cm−1 disappeared in the HAp-N3DG nanostructured CF, which is due to the loading of HAp nanoparticles on the surface of the N3DG network.30 Hence, the present work offers a strong evidence for the formation of HAp-N3DG nanostructured CF through the polymer-assisted solvothermal method.
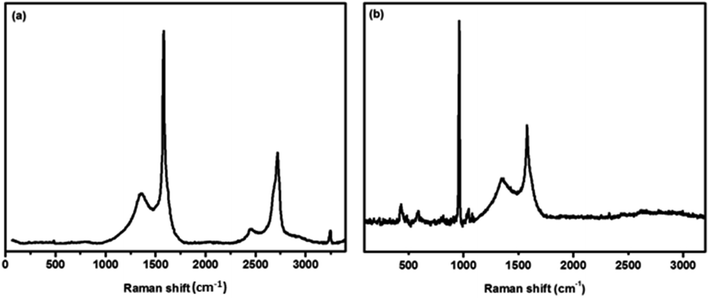 |
| | Fig. 3 Raman spectra of (a) commercial 3D graphene on Ni foam and (b) HAp anchored N3DG nanostructured CF. | |
3.3. Morphological and elemental analysis
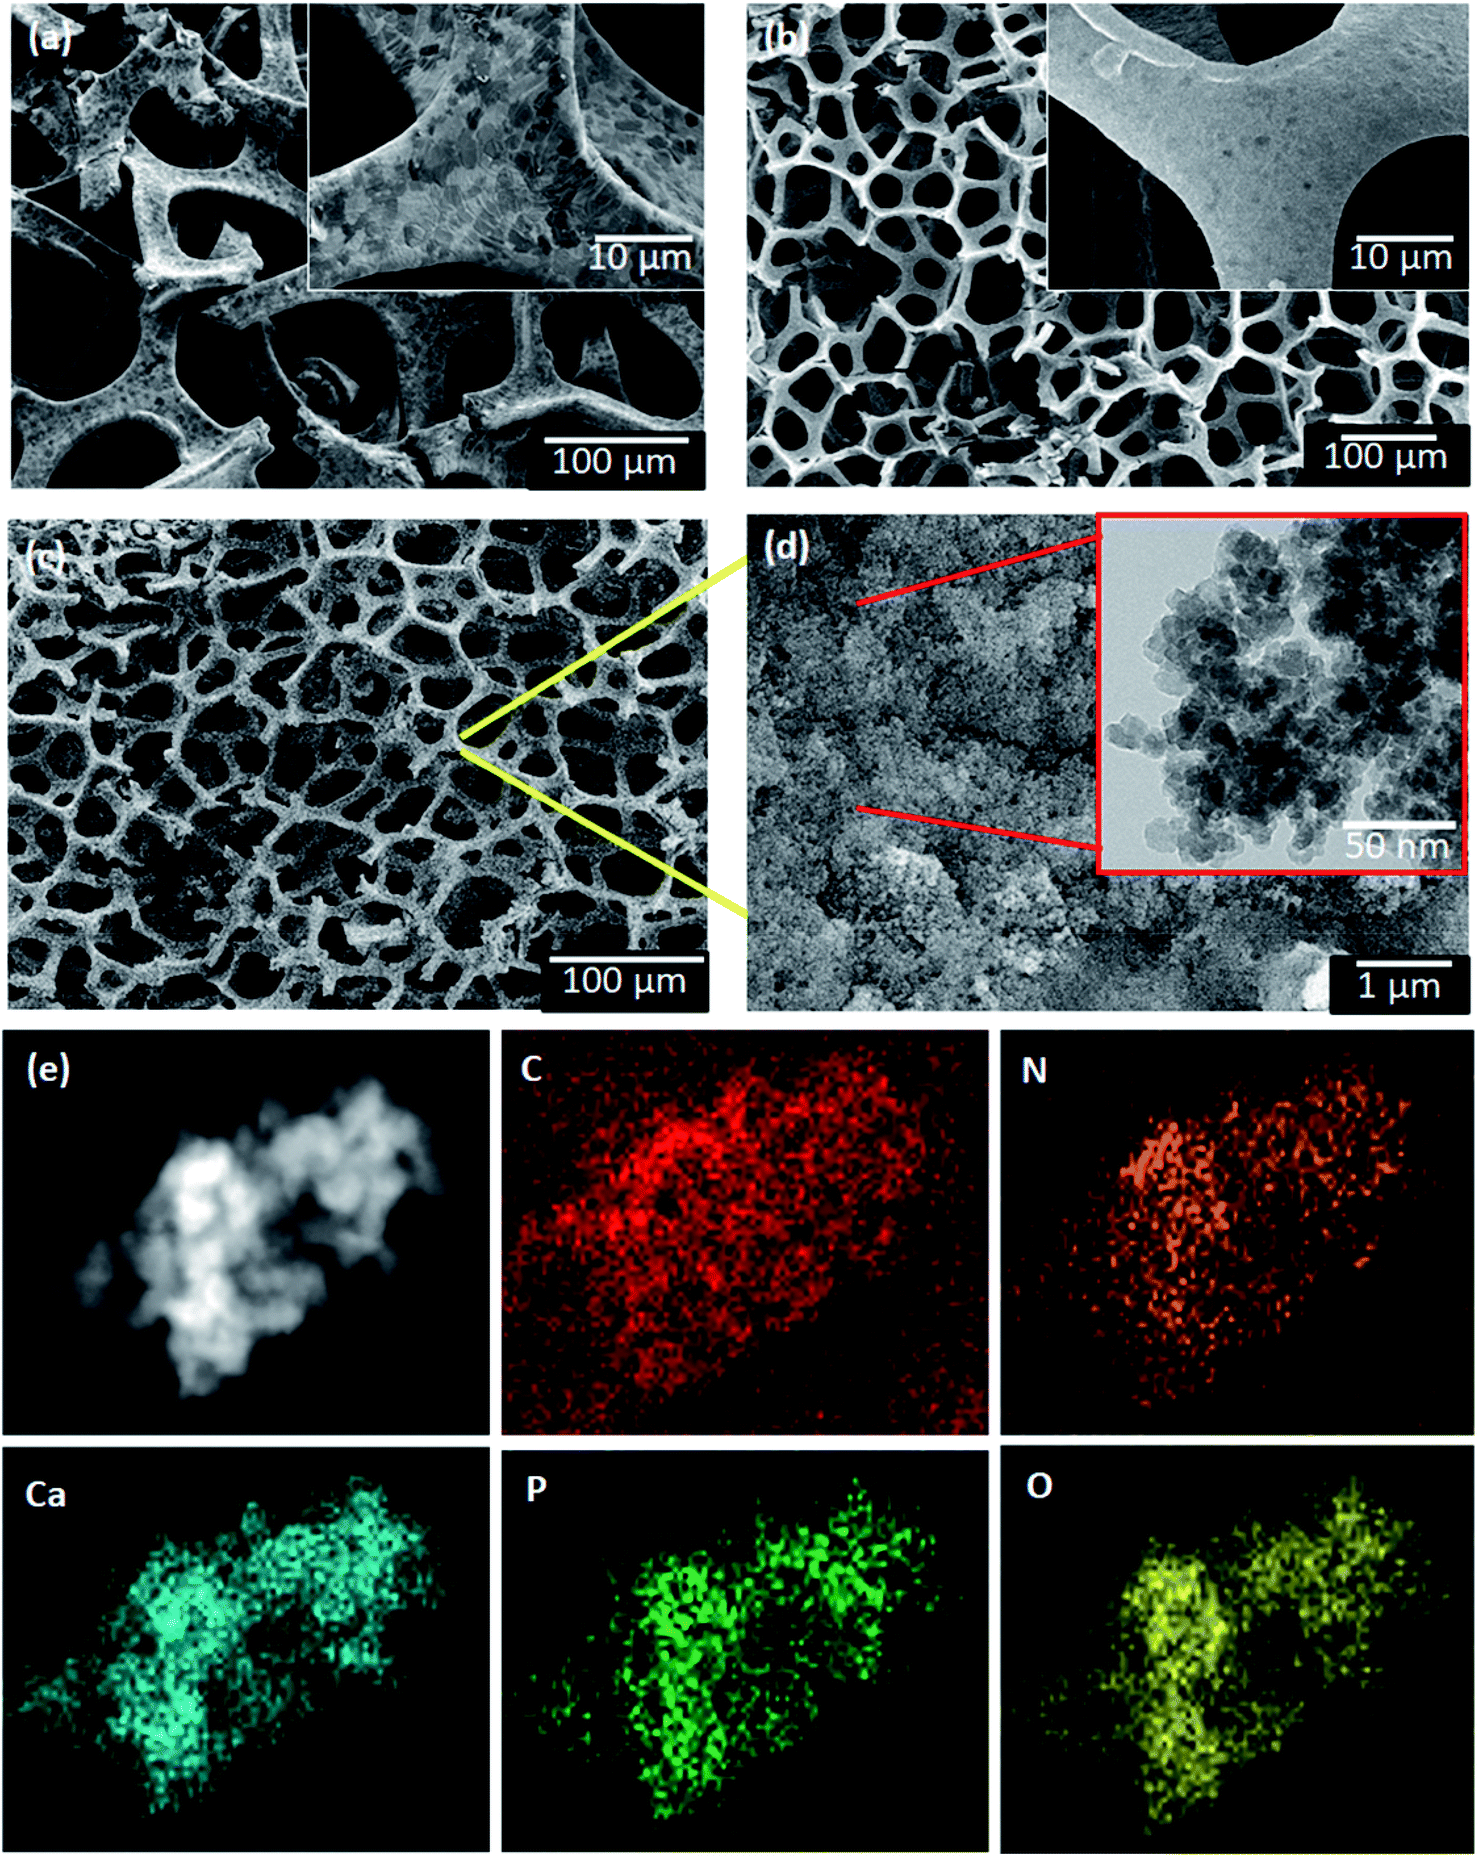
The morphological features of commercial 3DG on nickel foam, Ni-etched 3DG foam, and HAp anchored N3DG nanostructured ceramic framework were captured with the help of a field emission scanning electron microscope (FESEM) and a transmission electron microscope (TEM), as shown in Fig. 4a–f. The micrometer-range 3D graphene skeletal structure on nickel is shown in Fig. 4a. Several black spots are observed in the graphene skeletal structure. These black spots are due to nickel and serve as the foam to hold 3DG. In this image, the 3D graphene skeletal structure is clearly observed and there are no other morphological features. Fig. 4b shows a clear graphene skeletal structure without black spots, which reveals that nickel has been completely etched on the foam. HAp on N3DG is shown in Fig. 4c–e. The spherical shaped HAp nanoparticles are successfully trussed on the N3DG foam through van der Waals forces. Further, covalent reactions also act between N3DG and HAp. This result is in agreement with that reported by Chang et al.22 According to this report, nitrogen-doped carbon quantum dots are able to conjugate with HAp by covalent reaction between the surface amine groups of the nitrogen-doped carbon quantum dots and the hydroxyl groups of HAp. Hence, tHAp strongly binds on the surface of the N3DG frame work. The particles are uniformly distributed on the 3D graphene skeletal structure (Fig. 4c and d). The inset TEM image in Fig. 4d reveals the presence of nanometer-sized spherical HAp particles on N3DG. The average size of the particles is found to be below 50 nm. Urea was added for nitrogen doping on 3DG. It does not show any impact on the morphology. Further, PEG (polyethylene glycol) was added to attach HAp on the 3D graphene skeletal structure. The higher adhesive and brittle nature of HAp could cause the 3D network of graphene to break. To avoid this, PEG was added, which acted as a binder to attach HAp on the N3DG skeletal structure. The existing elements were confirmed through elemental mapping.
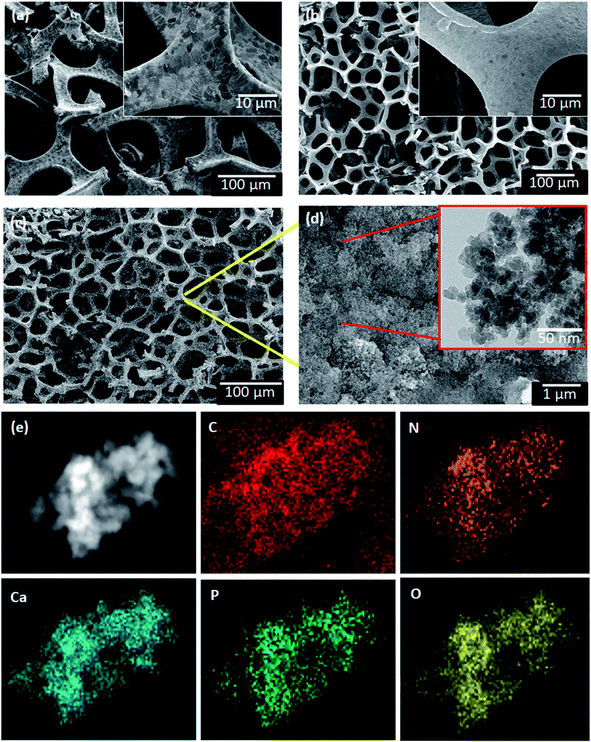 |
| | Fig. 4 FESEM images of (a) 3DG on Ni foam, (b) Ni etched 3DG foam, (c) HAp anchored N3DG ceramic framework, (d) TEM image of HAp-N3DG, and (e) elemental mapping of HAp-N3DG. | |
3.4. XPS analysis
In order to confirm the elemental composition, metal oxidation states, and nitrogen doping on the prepared material, XPS analysis was performed. Fig. 5a shows the survey spectrum of HAp on N3DG nanostructured ceramic framework, which reveals the presence of Ca, P, O 1s, N 1s, and C 1s. The XPS spectrum of N 1s shows three fitted peaks at 399.1, 399.9, and 400.9 eV, which are associated with pyridine, pyrrolic, and quaternary nitrogen bonding, respectively. The main C peak at 283 eV is ascribed to the C–C/C![[double bond, length as m-dash]](https://www.rsc.org/images/entities/char_e001.gif) C bonds.17 The other peaks at 284.4 eV and 288.7 eV correspond to C–N and CO bonding species, respectively; the Ca 2p3/2 and Ca 2p1/2 peaks are observed at 348.2 and 351.9 eV, respectively.17 The peaks at 133.4 and 134.1 eV, associated with P 2p, confirm the existence of phosphorus attached with oxygen (PO43−). The O 1s peaks are observed at 531.2 and 532.4 eV, which evince that the oxygen atoms present are attached with the phosphate group (PO43−). The XPS analysis hence confirms the presence of all the elements with their corresponding oxidation states.
C bonds.17 The other peaks at 284.4 eV and 288.7 eV correspond to C–N and CO bonding species, respectively; the Ca 2p3/2 and Ca 2p1/2 peaks are observed at 348.2 and 351.9 eV, respectively.17 The peaks at 133.4 and 134.1 eV, associated with P 2p, confirm the existence of phosphorus attached with oxygen (PO43−). The O 1s peaks are observed at 531.2 and 532.4 eV, which evince that the oxygen atoms present are attached with the phosphate group (PO43−). The XPS analysis hence confirms the presence of all the elements with their corresponding oxidation states.
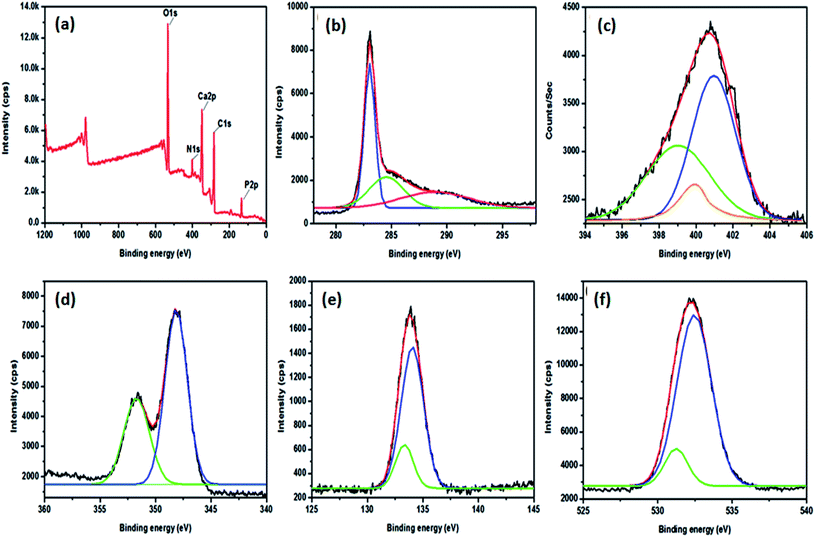 |
| | Fig. 5 XPS spectra of HAp-N3DG nanostructured CF (a) the survey spectrum, (b) carbon, (c) nitrogen, (d) calcium, (e) phosphorus, and (f) oxygen. | |
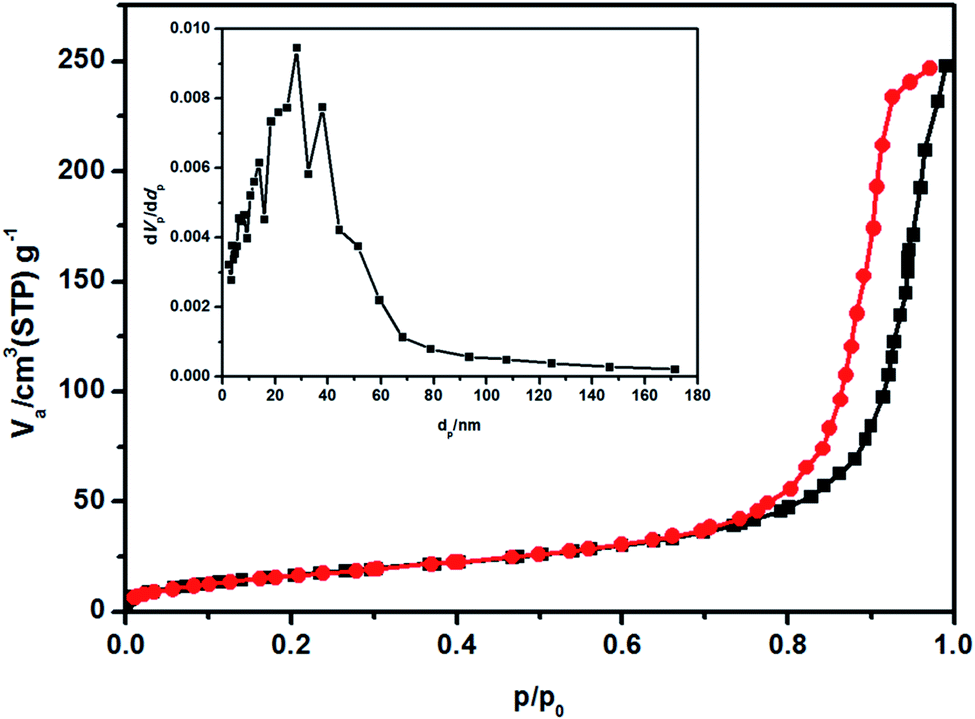
3.5. BET-BJH analysis
The specific surface area (SSA) and pore volume are vital parameters of electroactive materials employed in energy storage applications and adsorption studies of volatile organic compounds (VOCs). The porosity and specific surface area (SSA) of the prepared HAp-N3DG nanostructured CF were investigated with the help of BET-BJH nitrogen adsorption–desorption isotherm experiments. According to IUPAC classification, the obtained isotherm (Fig. 6) seems to be a type (IV)B adsorption–desorption isotherm and the hysteresis observed indicates that it is a H1 type loop with cylindrical pores. The SSA was calculated and was found to be 64.73 m2 g−1. The obtained mean pore diameter is 23.6 nm and this value shows that the prepared HAp-N3DG nanostructured CF has a mesoporous structure. In addition, the hysteresis loop reveals that multilayer adsorption and pore condensation has occurred in the sample.
 |
| | Fig. 6 Adsorption–desorption isotherm of HAp anchored N3DG nanostructured CF (inset: pore diameter). | |
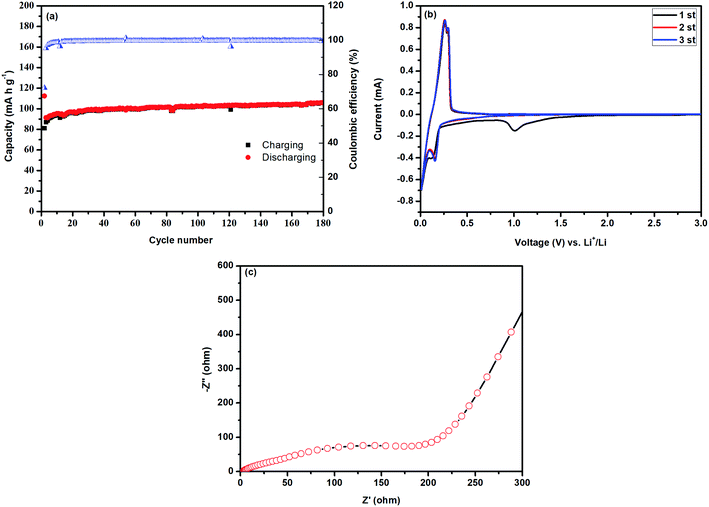
3.6. Electrochemical measurements
The prepared HAp anchored N3DG nanostructured ceramic framework was used directly as the working electrode. The electrochemical performance of the prepared HAp-N3DG was investigated by conducting cyclic voltammetry (CV), galvanostatic charge/discharge (GCD) studies, and electrochemical impedance spectroscopic (EIS) measurements. The first three consecutive CV curves of HAp anchored N3DG nanostructured CF electrode between 0.01 to 3.0 V at a scan speed of 0.01 mV s−1 at room temperature are shown in Fig. 7b. The CV curves seem to be non-rectangular with a non-symmetric shape, which indicates the non-pseudocapacitive nature with slow charge/discharge processes. The observed electrochemical reversibility is poor and is confirmed through the shape change of the CV curves during the second and third cycles rather than the first cycle at the same scan rate of 2 mV s−1. It means that the first cycle shows a different CV curve from the following cycles; in particular, for the discharge process, a strong peak at 1.01 V and a weak peak at 0.12 V are observed. The strong peak can be attributed to the electrically conductive feature of N3DG, which allows large access of the electrolyte to the surface of the electrode material and the formation of the intermediate phase of HAp-N3DG. Hence, a strong peak is observed at 1.01 V during the first cycle. However, during the second and third cycles, this peak was not observed. Due to the higher molecular weight and adhesive nature of Hap, the graphene network may have ruptured. Hence, electron transfer is forbidden in the electrode material. Therefore, the aforementioned peak was not observed during the second and third cycles. The weak peak at 0.12 V is attributed to lithium intercalation/deintercalation between Hap-N3DG. In addition, two peaks are observed at 0.26 and 0.29 V during the charging (anodic) process of the first cycle, which are associated with the decomposition of the SEI layer. Generally, larger SSA and pore volume can offer more active sites for the electrochemical reactions and can ensure efficient transportation between the electrolyte and electrode materials.31 In the present work, the prepared Hap anchored N3DG nanostructured ceramic framework has an SSA of 64.739 m2 g−1, a mean pore diameter 23.6 nm, and a total pore volume of 0.3834 cm3 g−1. The low surface area does not offer more transport pathways for better electrochemical reactions. A distinct peak is observed at nearly 0.15 V during the discharge (cathodic process) of the second and third cycles, which is attributed to the formation of a new solid-electrolyte interphase (SEI) film during the charge–discharge processes.28,31 Further, two weak peaks are observed at 0.26 and 0.29 V during the charging (anodic) processes of the second and third cycles, which are related to the decomposition of the SEI layer. The overlapping of the second and third CV curves implies good reversibility of the redox reaction. The proposed possible electrochemical reaction involved in the charge/discharge process is shown below (eqn (2)). However, understanding the actual electrochemical reactions happening between HAp anchored N3DG and electrolytes such as lithium ions is still difficult.| | |
Ca10(PO4)6(OH)2 + 10Li+ + 10e− ↔ Li10Ca5(PO4)6(OH)2 + 5Ca
| (2) |
or
| Ca10(PO4)6(OH)2 + 20Li+ + 20e− ↔ Li20(PO4)6(OH)2 + 10Ca |
 |
| | Fig. 7 Electrochemical performance of HAp anchored N3DG nanostructured CF (a) charge–discharge analysis, (b) cyclic voltammogram, and (c) electrochemical impedance spectrum. | |
The galvanostatic charge–discharge curves of HAp anchored N3DG nanostructured CF is shown in Fig. 7a. These curves indicate the lower charging–discharging capacitance of HAp-N3DG at 2 mV potential. The capacity shows a gradual increase after the second cycle to the 64th cycle (100.1 mA h g−1). After the 64th cycle, the capacity slowly increases and becomes 105.6 mA h g−1 at the 180th cycle. At the 180th cycle, the HAp anchored N3DG ceramic framework electrode still maintains a reversible capacity of 105.6 mA h g−1 with a capacity retention of 94.21%. Generally, the N-doped 3D graphene network provides more active sites for lithium (Li) ions and plays a significant role in accelerating the transportation of electrons and lithium ions in the electrode.31 Hence, this part of the prepared material (nitrogen-doped 3D graphene network) initiates the charge–discharge process; afterwards, the HAp nanoparticles try to participate in this process. The structural characteristics of Hap, particularly, the brittleness, higher molecular weight, and adhesive nature, help it to bind strongly on the surface of N3DG. These factors can suppress the transportation of electrons and Li ions in the HAp and electrolyte; hence, the charge–discharge process becomes slower.5,9 The specific capacitance of the prepared material was found to be 102.5 mA h g−1 at the 100th cycle with a coulombic efficiency of 99.77%.
AC impedance measurement was performed to understand the lithium-storage properties. The electrochemical impedance spectra (EIS) of Hap-N3DG nanostructured CF (Fig. 7c) was obtained with a fresh cell at 0.2 A g−1. The Nyquist plot consists of a semicircle in the higher frequency region, which reveals the reactions occurring on the electrode–electrolyte interface and reflects the charge transfer impedance and solid-electrolyte interphase (SEI) impedance. The large diameter of the semicircle reflects a large charge transfer resistance. Hence, the as-prepared HAp anchored N3DG nanostructured CF has a large charge transfer resistance, which reflects the lower diffusivity of the lithium ions with decreasing charge–discharge cycles.
3.7. Adsorption of volatile organic compounds (VOCs)
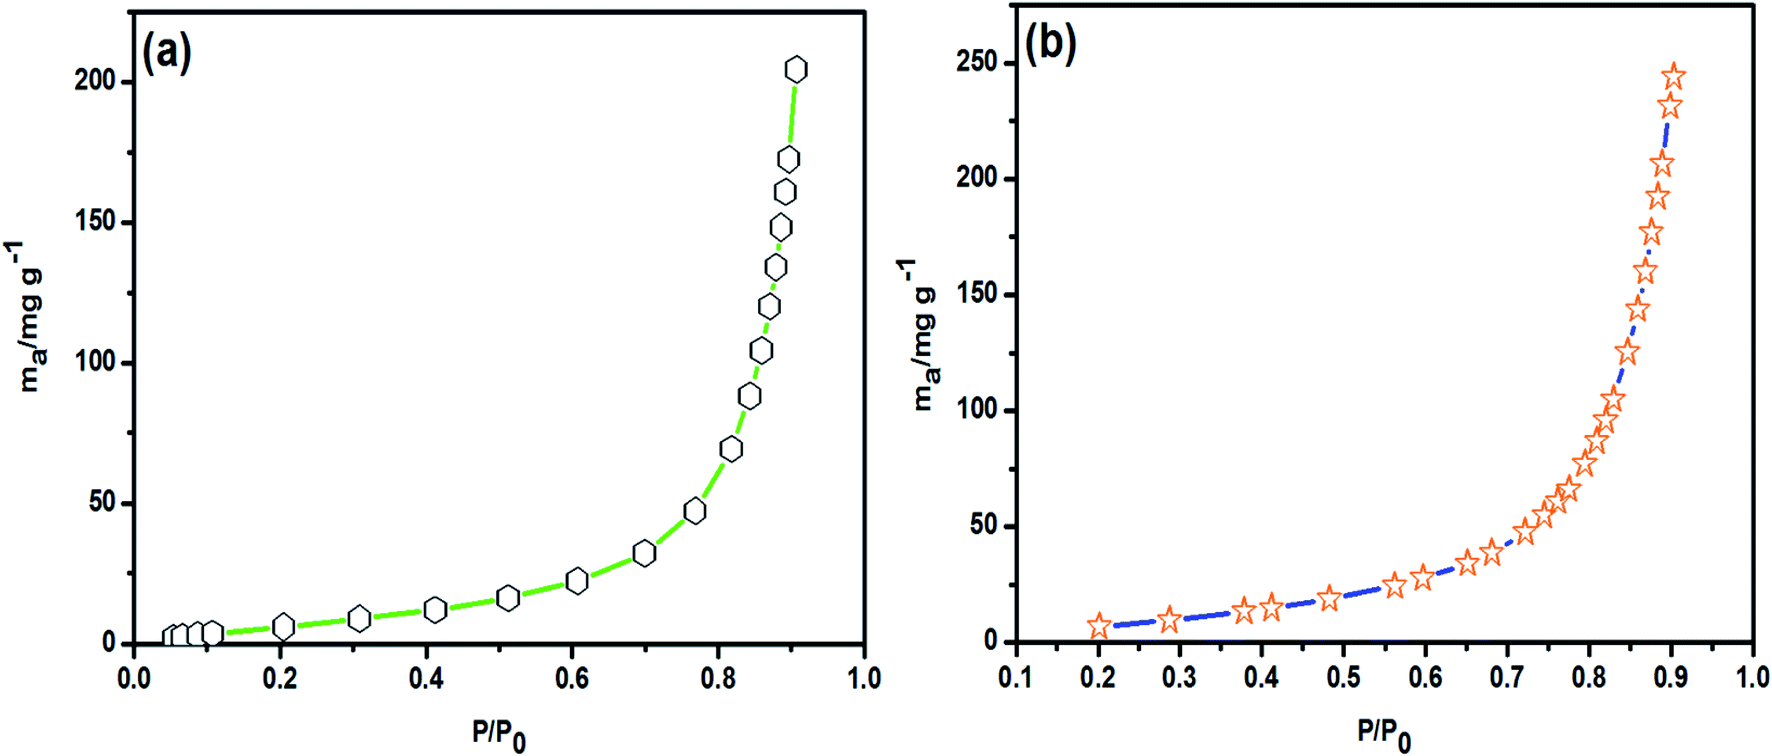
The VOC adsorption ability of HAp anchored nitrogen-doped 3D graphene (HAp-N3DG foam) skeletal network based nanostructured ceramic framework (CF) was investigated at 298 K with benzene and toluene as the model VOCs; the obtained results are shown in Fig. 8. The adsorption of benzene and toluene at lower pressure (P/P0) was less but gradually increased on increasing the pressure and reached a saturation level at higher pressure (P/P0 = 0.9). When the relative pressure (P/P0) reaches 0.9, the adsorption of benzene and toluene on HAp anchored N3DG nanostructured CF tends to be equilibrated, which indicates that the prepared material shows maximum adsorption performance at this stage. This is due to the large SSA, pore diameter, and pore volume of the material. It means that at higher relative pressure, the adsorbent material offers more adsorption sites and larger space (due to SSA) to accommodate benzene and toluene.
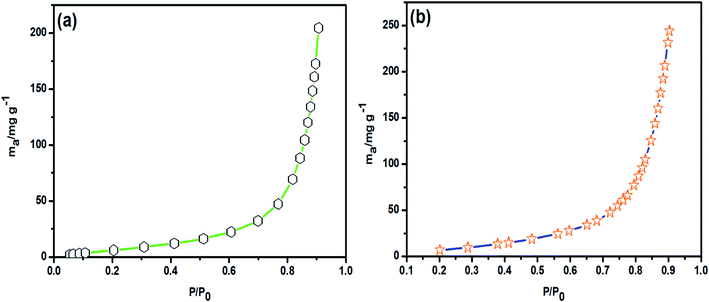 |
| | Fig. 8 Adsorption graphs of HAp-N3DG nanostructured CF for (a) benzene and (b) toluene adsorption. | |
The adsorption capacities of HAp anchored N3DG nanostructured CF for benzene and toluene are 2.623 mmol g−1 and 2.647 mmol g−1 (204.89 and 243.89 mg g−1), respectively, at 298 K and P/P0 = 0.9. The weights of the adsorbent material (HAp anchored N3DG nanostructured CF) for adsorbing benzene and toluene were 0.0879 g (87.9 mg) and 0.0693 g (69.3 mg), respectively. The observed results evince that the adsorption of toluene is higher than benzene, which is due to the SSA and mesoporous nature of HAp anchored N3DG nanostructured CF. In addition, the surface polarity of toluene is positive and that of HAp is negative (due to the presence of surface OH− & PO43− groups). Generally, opposite charges are attracted more strongly than other kinds of charges and forces. Hence, the adsorption of toluene is higher. In contrast, benzene has a partial negative (−ve) charge on its surface and a partial positive (+ve) charge in the middle of the ring. Therefore, the attraction between benzene and HAp anchored N3DG nanostructured CF is less than that between toluene and HAp anchored N3DG nanostructured CF. Hence, the adsorption of toluene is more than that of benzene. The pore volume-limiting effect also plays a considerable role in the adsorption of benzene and toluene. The larger molecules cannot be adsorbed freely at a lower pore volume. The kinetic diameter of toluene is 0.67 nm and that of benzene is 0.58 nm. Hence, the adsorption of toluene is slower (lower) than that of benzene during the initial adsorption process. Afterwards, increasing the relative pressure helps in the adsorption of more toluene molecules. The brief details of different kinds of adsorbents including graphene based adsorbent materials employed for the adsorption of benzene and toluene under different reaction conditions are shown in Table 1. From the observed results, we conclude that the newly developed HAp anchored on N3DG skeletal network (foam) based nanostructured ceramic framework can be used as an adsorbent material for the removal of VOCs.
Table 1 Adsorption of benzene and toluene by different kinds of adsorbents under different reaction conditions
| S. no. |
Type of material |
Method |
SSA (m2 g−1) |
Pore volume/pore diameter |
Adsorption capacity |
Reference |
| Benzene |
Toluene |
| 1. |
Activated carbon impregnated cellulose acetate electrospun mats |
Quartz crystal microbalance method (single nozzle system); Dubinin–Astakhov equation |
21.57 |
— |
352 (μg cm−2 g−1) |
— |
12 |
| 2. |
Granular activated carbon commercially purchased |
Laboratory-scale packed-bed adsorber method; break-through curve; deactivation model |
804.6 |
0.4734 (cm3 g−1) 23.54 Å (av. pore dia.) |
27.50 (mg g−1) |
59.20 (mg g−1) |
32 |
| 3. |
Activated carbon bed – Picactif NC60 commercially purchased |
Calorimetric method (differential scanning calorimetry coupled with a thermobalance) |
1240 |
Microporous 0.55 nm |
— |
424.40 (mg g−1) |
33 |
| 4. |
Granular commercial activated carbon |
Flow adsorption technique (isothermal adsorption device) |
951.5 |
0.5175 (mL g−1) 0.67 nm |
— |
364.96 (mg g−1) |
34 |
| 5. |
Commercial activated carbon |
Gravimetric adsorption method |
990 |
0.094 (cm3 g−1)2.7 nm |
161.42 (mg g−1) |
109.45 (mg g−1) |
35 |
| 6. |
Commercial activated carbon monolith |
Vapor-solid adsorption isotherm method (gravimetric adsorption equilibrium apparatus) |
603 |
— |
— |
366.72 (mg g−1) |
36 |
| 7. |
Graphene oxide & reduced graphene oxide sheets |
Cyclic adsorption/desorption |
236.4, 292.6 |
3.8–4.8 (nm), 4.6–6.2 (nm) |
276.4 (mg g−1) |
304.4 (mg g−1) |
37 |
| 8. |
Microporous graphitized biocarbon |
Adsorption isotherms at ultra-low pressure (micromeritics 3Flex); TPD experiment |
2085.2 |
0.792 (cm3 g−1) narrow super-micro pores (6.8–8.8 Å) |
5.8 (mmol g−1) |
5.2 (mmol g−1) |
38 |
| 9. |
Graphene nanosheets |
Batch adsorption study; Langmuir–Freundlich adsorption isotherm, nonlinear method |
392 |
Mesoporous |
126 (mg g−1) |
149 (mg g−1) |
39 |
| 10. |
Commercial activated carbon; sulfonated carbon; ordered mesoporous carbon (CMK8 & 3) |
Isosorp static gravimetric sorption analysis |
2336, 510, 1224 & 1078 |
Mesoporous |
14 (mmol g−1), very low |
— |
40 |
| 11. |
Mesoporous graphene (thermally reduced oxide graphene powder) |
Gas detector tube (GASTEC) |
542 |
Mesoporous |
— |
93% |
41 |
| 12. |
Paraffin/surfactant/water emulsion (PSW-5) |
Packed bed bubble column reactor |
— |
— |
— |
90.77%, 1650 (mg m−3) |
42 |
| 13. |
HAp anchored on nitrogen doped 3D graphene (foam) (nanostructured ceramic framework) |
Standard static volumetric method |
64.73 |
Mesoporous; 0.3834 (cm3 g−1) 23.6 nm |
204.89, (mg g−1) |
243.89, (mg g−1) |
Present work |
4. Conclusions
In summary, HAp anchored N3DG skeletal network (foam) based nanostructured ceramic framework (CF) has been prepared successfully through a simple polymer-assisted solvothermal method. The physicochemical properties, electrochemical performance, and adsorption capacity for VOCs were evaluated via various studies and analyses. The physicochemical analysis reveals that the HAp nanoparticles are embedded on the surface of the N3DG (foam) skeletal network. Further, the as-prepared nanostructured ceramic framework has a mesoporous structure, which was confirmed through adsorption–desorption experiments. The electrochemical chemical studies reveal that the prepared HAp anchored N3DG nanostructured ceramic framework has 105.9 mA h g−1 lithium storage capacity at 200 mA g−1. The physical characters such as strong adhesive nature, brittleness, and higher molecular weight of HAp are factors that suppress the electrochemical performance. Hence, the next level of work is required to be carried out to overcome these issues. At the same time, the prepared nanostructured ceramic framework acts as a good adsorbent for the removal of volatile organic compounds (VOCs) such as benzene and toluene. It shows the adsorption capacity of 204.89 and 243.89 mg g−1 for benzene and toluene, respectively, at 298 K and P/P0 = 0.9. Hence, the prepared HAp anchored N3DG (foam) skeletal network based nanostructured ceramic framework (CF) can be used as a new kind of adsorbent for the removal of VOCs. Further, the present study initiates a new approach for the development of materials with potential applications in energy devices and VOC adsorption studies.
Conflicts of interest
There are no conflicts to declare.
Acknowledgements
The authors acknowledge the Postdoctoral Research Foundation of Jiangsu University of Science and Technology, P. R. China.
References
- M. Manoj, R. Subbiah, P. Meena, D. Mangalaraj, N. Ponpandian, C. Viswanathan and K. Park, Adv. Sci., Eng. Med., 2016, 8, 216–221 CrossRef CAS.
- H. Li, D. Wu, J. Wu, L.-Y. Dong, Y.-J. Zhu and X. Hu, Adv. Mater., 2017, 29, 1–11 Search PubMed.
- G. Bharath and N. Ponpandian, RSC Adv., 2015, 5, 84685–84693 RSC.
- K. Thanigai Arul, M. Ramesh, C. Chennakesavan, V. Karthikeyan, E. Manikandan, A. Umar, M. Maaza and M. Henini, J. Alloys Compd., 2018, 730, 31–35 CrossRef.
- J. P. Gittings, C. R. Bowen, A. C. E. Dent, I. G. Turner, F. R. Baxter and J. B. Chaudhuri, Acta Biomater., 2009, 5, 743–754 CrossRef CAS PubMed.
- M. Manoj, D. Mangalaraj, N. Ponpandian and C. Viswanathan, RSC Adv., 2015, 5, 48705–48711 RSC.
- G. Bharath, R. Madhu, S.-M. Chen, V. Veeramani, A. Balamurugan, D. Mangalaraj, C. Viswanathan and N. Ponpandian, J. Mater. Chem. B, 2015, 3, 1360–1370 RSC.
- M. Manoj, R. Subbiah, D. Mangalaraj, N. Ponpandian, C. Viswanathan and K. Park, Nanobiomedicine, 2015, 2, 1–11 CrossRef PubMed.
- B. Singh, S. Kumar, B. Basu and R. Gupta, Mater. Lett., 2013, 95, 100–102 CrossRef CAS.
- M. Li, J. Lu, Z. Chen and K. Amine, Adv. Mater., 2018, 30, 1–24 Search PubMed.
- T. Kim, W. Song, D.-Y. Son, L. K. Ono and Y. Qi, J. Mater. Chem. A, 2019, 7, 2942–2964 RSC.
- K. Patil, S. Jeong, H. Lim, H.-S. Byun and S. Han, Environ. Eng. Res., 2019, 24, 600–607 CrossRef.
- Z. A. Kasemy, G. M. Kamel, G. M. A. Rasoul and A. A. Ismail, J. Environ. Public Health, 2019, 2019, 1–6 CrossRef PubMed.
- O. M. S. Ismail and R. S. A. Hameed, Adv. Appl. Sci. Res., 2013, 4, 264–268 CAS.
- F. Pariselli, M. G. Sacco, J. Ponti and D. Rembges, Exp. Toxicol. Pathol., 2009, 61, 381–386 CrossRef CAS PubMed.
- X. Zhang, B. Gao, A. E. Creamer, C. Cao and Y. Li, J. Hazard. Mater., 2017, 338, 102–123 CrossRef CAS PubMed.
- X. H. Xia, D. L. Chao, Y. Q. Zhang, Z. X. Shen and H. J. Fan, Nano Today, 2014, 9, 785–807 CrossRef CAS.
- V. Chandra, S. U. Yu, S. H. Kim, Y. S. Yoon, D. Y. Kim, A. H. Kwon, M. Meyyappan and K. S. Kim, Chem. Commun., 2012, 48, 735–737 RSC.
- G. Wei, C. Gong, K. Hu, Y. Wang and Y. Zhang, Nanomaterials, 2019, 9, 1435 CrossRef CAS PubMed.
- H. Huang, C. Lei, G. Luo, Z. Cheng, G. Li, S. Tang and Y. Du, J. Mater. Sci., 2016, 51, 6348–6356 CrossRef CAS.
- J. Luo, X. Zhang, J. O. Machuki, C. Dai, Y. Li, K. Guo and F. Gao, ACS Appl. Bio Mater., 2018, 2, 299–310 CrossRef.
- Q. Chang, K. K. Li, S. L. Hu, Y. G. Dong and J. L. Yang, Mater. Lett., 2016, 175, 44–47 CrossRef CAS.
- W. Xie, F. Song, R. Wang, S. Sun, M. Li, Z. Fan, B. Liu, Q. Zhang and J. Wang, Crystals, 2018, 8, 105–112 CrossRef.
- J. Wang, Z. Ouyang, Z. Ren, J. Li, P. Zhang, G. Wei and Z. Su, Carbon, 2015, 89, 20–30 CrossRef CAS.
- T. Kawai, C. Ohtsuki, M. Kamitakahara, M. Tanihara, T. Miyazaki, Y. Sakaguchi and S. Konagaya, Environ. Sci. Technol., 2006, 40, 4281–4285 CrossRef CAS PubMed.
- H. Nishikawa, T. Oka, N. Asai, H. Simomichi, T. Shirai and M. Fuji, Appl. Surf. Sci., 2012, 258, 5370–5374 CrossRef CAS.
- Y. Xin, H. Ikeuchi, J. Hong, H. Nishikawa and T. Shirai, J. Ceram. Soc. Jpn., 2019, 127, 263–266 CrossRef CAS.
- J.-B. Wu, M.-L. Lin, X. Cong, H.-N. Liu and P.-H. Tan, Chem. Soc. Rev., 2018, 47, 1822–1873 RSC.
- F. Song, W. Jie, T. Zhang, W. Li, Y. Jiang, L. Wan, W. Liu, X. Li and B. Liu, RSC Adv., 2016, 6, 92804–92812 RSC.
- M. Ramadas, G. Bharath, N. Ponpandian and A. M. Ballamurugan, Mater. Chem. Phys., 2017, 199, 179–184 CrossRef CAS.
- M. Huang, K. Mi, J. Zhang, H. Liu, T. Yu, A. Yuan, Q. Kong and S. Xiong, J. Mater. Chem. A, 2017, 5, 266–274 RSC.
- K.-J. Oh, D.-W. Park, S.-S. Kim and S.-W. Park, Korean J. Chem. Eng., 2010, 27, 632–638 CrossRef CAS.
- F. Delage, P. Pre and P. L. Cloirec, Environ. Sci. Technol., 2000, 34, 4816–4821 CrossRef CAS.
- L. L. Qing, S. J. Fei, Y. X. Long, H. G. Jie, L. Zheng and T. Ling, J. Cent. South Univ., 2012, 19, 3530–3539 CrossRef.
- C.-M. Wang, K.-S. Chang and T.-W. Chung, J. Chem. Eng. Data, 2004, 49, 527–531 CrossRef CAS.
- F. D. Yu, L. A. Luo and G. Grevillot, J. Chem. Eng. Data, 2002, 47, 467–473 CrossRef CAS.
- L. Yu, L. Wang, W. Xu, L. Chen, M. Fu, J. Wu and D. Ye, J. Environ. Sci., 2018, 67, 171–178 CrossRef PubMed.
- M. Zhu, Z.-F. Tong, Z. Zhao, Y. Jiang and Z. zhao, Ind. Eng. Chem. Res., 2016, 55, 3765–3774 CrossRef CAS.
- M. T. Raad, H. Behnejad and M. E. Jamal, Surf. Interface Anal., 2016, 48, 117–125 CrossRef CAS.
- B. Rubahamya, K. Suresh Kumar Reddy, A. Prabhu, A. A. Shoaibi and C. Srinivasakannan, Environ. Prog. Sustainable Energy, 2018, 38, 93–99 CrossRef.
- S. T. Lim, J. H. Kim, C. Y. Lee, S. Koo, D.-W. Jerng, S. Wongwises and H. S. Ahn, Sci. Rep., 2019, 9, 10922 CrossRef PubMed.
- P. Fang, Z.-J. Tang, X.-B. Chen, Z.-X. Tang, D.-S. Chen, J.-H. Huang, W.-H. Zeng and C.-P. Cen, J. Chem., 2016, 2016, 9385027 Search PubMed.
|
| This journal is © The Royal Society of Chemistry 2020 |
Click here to see how this site uses Cookies. View our privacy policy here. 
 Open Access Article
 This Open Access Article is licensed under a Creative Commons Attribution-Non Commercial 3.0 Unported Licence
 a,
Jinbo Songa,
Wenjian Zhu
a,
Jinbo Songa,
Wenjian Zhu