 Open Access Article
Excited-state absorption for zinc phthalocyanine from linear-response time-dependent density functional theory
Chunrui Wanga,
Junfeng Shaoa,
Fei Chena and
Xiaowei Sheng *b
*b
aState Key Laboratory of Laser Interaction with Matter, Changchun Institute of Optics, Fine Mechanics and Physics, Chinese Academy of Sciences, Changchun, 130033, China
bAnhui Province Key Laboratory of Optoelectric Materials Science and Technology, Anhui Laboratory of Molecule-Based Materials, The Key Laboratory of Functional Molecular Solids, Ministry of Education, Anhui Normal University, Wuhu 241000, Anhui, China. E-mail: xwsheng@mail.ahnu.edu.cn
First published on 27th July 2020
Abstract
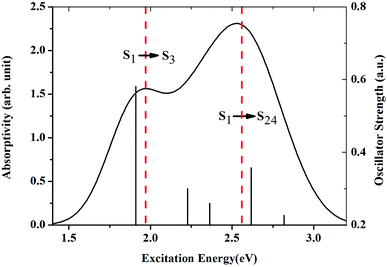
The mechanism for zinc phthalocyanine (ZnPc) showing optical-limiting character is related to the first singlet excited-state absorption (ESA). Two distinct band peaks in this ESA spectrum (1.97 eV and 2.56 eV) were observed in experiments. However, the origin of the absorption is not well understood. In the present work, we perform accurate quantum mechanical calculations and analysis of the absorption of ZnPc in the first singlet excited state. It is found that the transitions of S1 → S3 and S1 → S24 are the origin of the first and second band peaks, respectively. Charge transfer character is observed between the edges and central parts of ZnPc for those two transitions, but occurs in opposite directions. It is gratifying to note that the absorption can be modified smoothly through the substitution of nitrogen atoms in ZnPc with methyne or benzene rings. The aggregation phenomenon is also investigated with ZnPc dimers. The present calculations show that the absorptions of two ZnPc molecules with cofacially stacked and slightly shifted cofacially stacked configurations both result in an obvious blueshift compared with the zinc phthalocyanine monomer. The present observations may be utilized in tuning the optical-limiting character of ZnPc.
I. Introduction
With the rapid development of intense light sources, more and more researchers have realized that designing materials for protecting light-sensitive materials is urgent.1 Optical-limiting materials show a strong attenuation of light transmission at high input intensities but have a very high transmittance for light at low input intensities.2–5 These materials can be used to protect light-sensitive materials from damage by high intensity light sources. Reversed saturation absorption (RSA) is one of the most important non-linear optical properties for materials showing optical-limiting character. The necessary condition for materials showing reversed saturation absorption properties is that the excited states have higher absorption compared with the ground state.6 Therefore, investigations of the absorption spectra of the molecules in the ground (GSA) and excited states (ESA) are very important for the development of advanced optical limiters.Organic compounds are potential candidates for optical-limiting materials, since those compounds generally show large and delocalized π-electron networks.7–12 Metallophthalocyanines as typical organic compounds have received lots of attention in this field.6,13–19 Zinc phthalocyanine (ZnPc) as a metallophthalocyanine has attracted the greatest interest.20–22 The absorption spectra of ZnPc in the ground state and excited states have been well studied in experiments. One of the most recent experimental measurements of the GSA and ESA was conducted by Savolainen et al.13 They recorded the spectrally resolved pump–probe data of zinc phthalocyanine on time scales ranging from femtoseconds to nanoseconds. Two distinct bands peaking at 1.85 eV and 3.59 eV were observed in the GSA. In addition, it was found that the main bands of the first singlet excited state absorption are centered at 1.97 eV and 2.56 eV.
Theoretically, the absorption spectrum of ZnPc in the ground state has also been investigated extensively. Ricciardi et al. afforded an accurate description of the electronic spectrum of ZnPc in the ground state.23 Theisen et al. studied the absorption spectra for seven derivatives of ZnPc in the ground state.24 Yanagisawa et al. and Ueno et al. investigated the effect of molecularly stacked aggregation on the ground state absorption spectra.25,26 However, theoretical investigation of the ESA for ZnPc has been less explored. This is mainly attributed to the fact that the developed quantum chemical methods to study ESA are limited and immature. As far as we know, the first and only theoretical prediction of the ESA for ZnPc was reported by Fischer et al.6 They performed real-time time-dependent density functional theory (RT-TDDFT) calculations for ZnPc in the first singlet excited state.6 The predicted band peaks overestimated the transition energies by 0.27 eV and 0.28 eV, respectively, compared with the experimental measurement. Although the spectral band of the ESA for ZnPc has been qualitatively predicted with the RT-TDDFT method, accurate quantum mechanical calculations and analysis of the absorption are still required to fully characterize the ESA.
Most recently, we found that the oscillator strengths for the transition between two excited states can be well described with the excited state wavefunctions approximated by a linear combination of singly excited configurations built from the Kohn–Sham orbitals. The computational cost of this method scales as N4, which is much cheaper compared with the QR-TDDFT method.27 This method was applied to ZnPc and it was shown that the predicted band peaks of ZnPc in the first singlet excited state are in excellent agreement with the experimental measurements.27 According to this observation, we afford an accurate quantum mechanical analysis for the absorption of ZnPc in the first singlet excited state. The manuscript is organized as follows: the methods used to estimate the ESA are described in the next section; the results are reported and discussed in the Results and discussions section; then, the paper closes with the Conclusions section.
II. Methods and computational details
The ESA of ZnPc, modified ZnPc and ZnPc dimers were simulated by using our recently proposed method. This method is based on the assumption that the excited state wavefunction can be well approximated by a linear combination of singly excited configurations built from the Kohn–Sham orbitals. The linear expansion coefficients are obtained by projecting the linear response orbitals on the Kohn–Sham orbitals. The transition energies are obtained from linear-response time-dependent density functional theory (LR-TDDFT). For validation and a more elaborate explanation of this method we refer to ref. 27.The structure of the ground state ZnPc geometry was optimized with the BHandHLYP functional with the 6-31G(d,p) basis set. The basis set and the functional used here have been calibrated in ref. 27. The spectra are described using the calculated oscillator strengths and the excitation energies broadened with the Gaussian function (FWHM = 0.4 eV). The ESA simulations were done in DMSO solvent with the polarizable continuum model (PCM), which is consistent with the experimental measurements.13 Geometry optimization was done by using the Gaussian 09 package.28 A modified GAMESS(US) package was used to preform the LR-TDDFT and ESA simulations.29 The natural transition orbital analysis and calculations of the electron density difference between the two singlet excited states were done using the wavefunction analysis program Multiwfn.30
III. Results and discussions
A. First singlet excited state absorption of ZnPc
The geometry of ZnPc is shown in Fig. 1. The calculated first singlet excited state absorption spectrum (black solid line) is shown in Fig. 2, together with the experimental results (red dashed lines).13 The present theoretical predicted peak positions of the ESA spectrum in Fig. 2 are 1.97 eV and 2.53 eV. Our calculations underestimate the transition energies by only 0.03 eV for the second peak, compared with the experimental measurement. We also note that Fischer et al. reported RT-TDDFT results for the present system.6 The predicted two band peaks based on the RT-TDDFT calculations overestimated the transition energies by 0.27 eV and 0.28 eV, respectively, compared with the experimental measurement. More detailed discussions of the ESA calculated from RT-TDDFT can be found in ref. 31.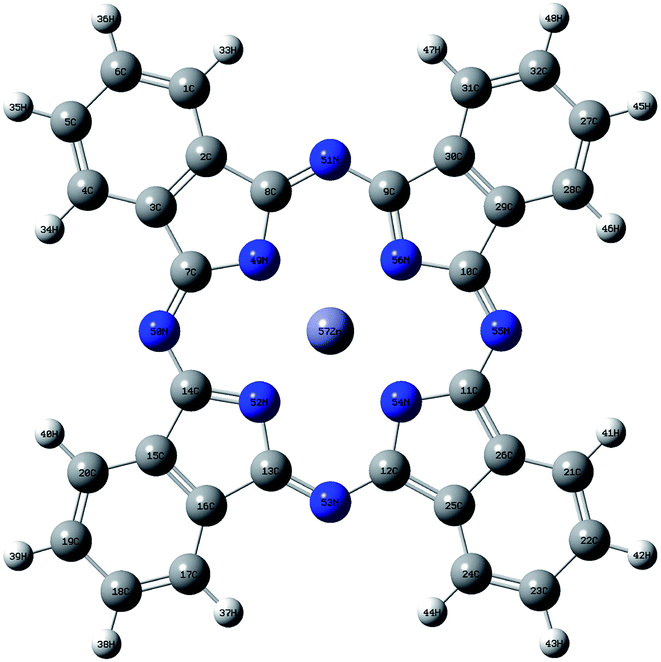 | ||
| Fig. 1 Geometry of ZnPc optimized at BHandHLYP/6-31G(d,p) level in the ground state. White, grey and blue spheres represent hydrogen, carbon and nitrogen atoms, respectively. | ||
Table 1 lists the first five strong transitions of the theoretical prediction of ESA. It is clearly seen that S1 → S3 is the main contribution to the first band peak. S1 → S10, S1 → S13, S1 → S24 and S1 → S27 all make considerable contributions to the second band peak. However, S1 → S24 is the most important transition for the second peak in the ESA. Accordingly, S1, S3 and S24 are the excited states which are very important for the ESA. The orbital transitions for these key excited states in the ESA are also checked. It is found that S1 essentially corresponds to the transition from the highest occupied to the lowest unoccupied molecular orbital (HOMO → LUMO). HOMO → LUMO+2 is the main transition for the excited state S3. In the case of S24 the orbital transitions are complicated. Four transitions have to be included to describe this excited state (HOMO−5 → LUMO+1, HOMO−6 → LUMO, HOMO−6 → LUMO+1, HOMO−5 → LUMO).
| Transition | Excitation energy (eV) | Oscillator strength |
|---|---|---|
| S1 → S3 | 1.9104 | 0.5806 |
| S1 → S10 | 2.2271 | 0.2998 |
| S1 → S13 | 2.3620 | 0.2594 |
| S1 → S24 | 2.6179 | 0.3569 |
| S1 → S27 | 2.8180 | 0.2263 |
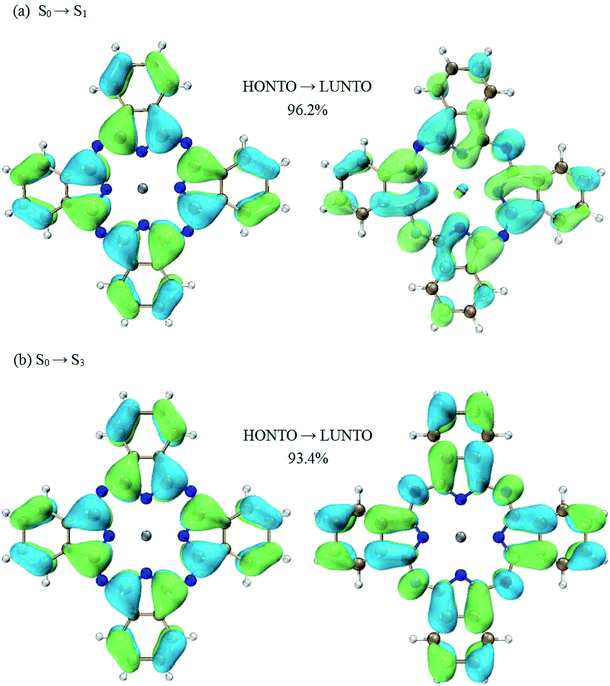
Much insight can be gained from analyzing the charge transfer characters of the transitions between excited states. Firstly, let’s focus on the transition of S1 → S3, which is the dominant contribution to the first peak in terms of oscillator strength. According to the NTO analysis, the excited state of S1 can be well characterized by a single electronic transition from the highest occupied natural transition orbital (HONTO) to the lowest unoccupied natural transition orbital (LUNTO) (96.2% HONTO → LUNTO). Similar results can also be observed for the excited state of S3. The weighting of the HONTO → LUNTO transition for S3 is 93.4%. These NTOs are shown in Fig. 3. It is shown that the transitions of S0 → S1 and S0 → S3 both present charge transfer character. For the S0 → S1 transition, the charges move to the center part of ZnPc from the four benzene rings at the edges (Fig. 3(a)). For the S0 → S3 transition, the charge transfer occurs in the opposite direction compared with the S0 → S1 transition (Fig. 3(b)).
According to the above analysis for the transitions of S0 → S1 and S0 → S3, it is not hard to draw the conclusion that the S1 → S3 transition has charge transfer character. To be specific, the charge transfer occurs from the center to the edges of ZnPc. This is also consistent with the calculations of electron density differences between the excited states of S3 and S1, as shown in Fig. 5(a).
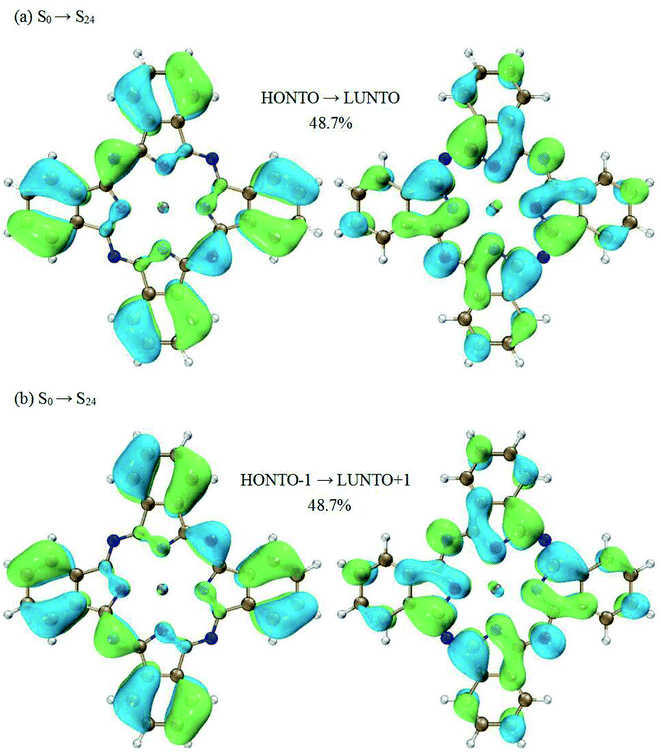
Now we switch to the transition of S1 → S24. This transition is the dominant contribution to the second peak. However, the excited state S24 cannot be characterized by a single electronic transition. Two electronic transitions have to be included based on the NTO analysis (HONTO → LUNTO and HONTO−1 → LUNTO+1). Fig. 4 displays the related NTOs. It is clearly shown that the S0 → S24 transition has charge transfer character. The charge transfer occurs from the edges of ZnPc to the center part. Similar charge transfer character has been observed above for the transition of S0 → S1. Therefore, it is not possible to judge the charge transfer character for the S1 → S24 transition based on the NTO analysis for the transitions of S0 → S24 and S0 → S1. In order to clearly illustrate the charge transfer character of S1 → S24, the electron density differences of ZnPc between the excited states of S24 and S1 were also calculated. Fig. 5(b) displays the results and it can be seen that the charge transfer character also exists. However, the charge transfer occurs from the edges to the center part of ZnPc, which is in the opposite direction compared with the transition S1 → S3. The charge transfer directions for the S1 → S3 and S1 → S24 transitions are shown in Fig. 5 by red arrows.
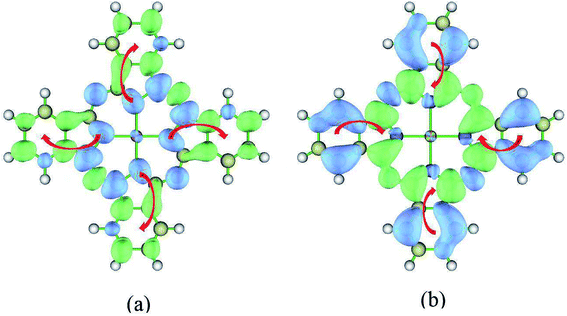 | ||
| Fig. 5 Electron density difference of ZnPc for S1 → S3 and S1 → S24 transitions. Blue and green regions show a decrease and increase of electron density, respectively. The wavefunction analysis program Multiwfn30 was used for this analysis. The isosurface values are fixed to 0.0005 Å−3. (a) S1 → S3, Δρ = ρ3(r) − ρ1(r); (b) S1 → S24, Δρ = ρ24(r) − ρ1(r). | ||
B. First singlet excited state absorption of modified ZnPc
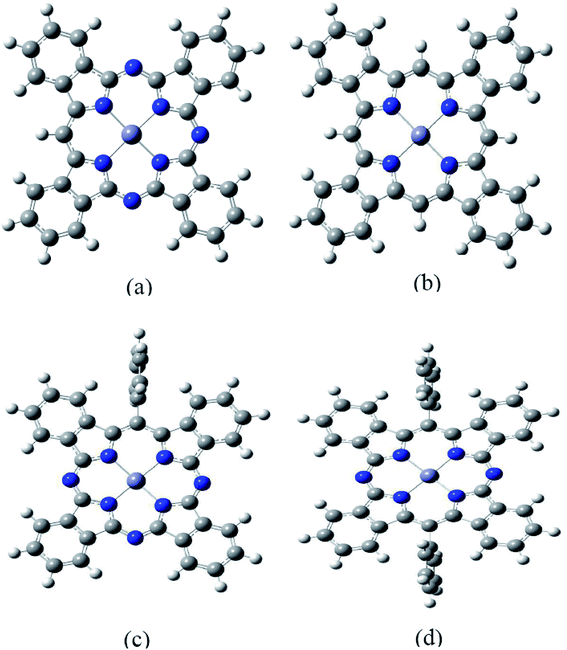
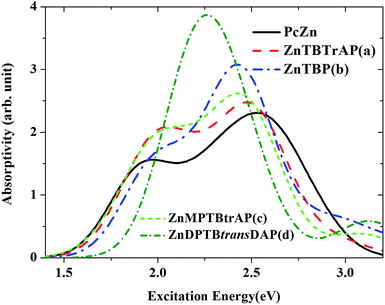
It is well known that the optical properties of phthalocyanine-based materials can be tuned through chemical modifications.24,32 Here we investigated four types of chemical modification for ZnPc (zinc tetrabenzotriazaporphyrin, ZnTBTrAP; zinc tetrabenzoporphyrin, ZnTBP; zinc monophenyltetrabenzotriazaporphyrin, ZnMPTBTrAP; zinc diphenyltetrabenzotransdiazaporphyrin, ZnDPTBtransDAP). These molecules were reported by Theisen et al.24 A diagram of the modified ZnPc molecules is shown in Fig. 6. These chemical modifications are simply replacing N atoms in ZnPc with C–H or C–C6H5 units. ZnTBTrAP and ZnMPTBTrAP are obtained by replacing one nitrogen atom in ZnPc with C–H and C–C6H5, respectively. ZnTBP is obtained by replacing four nitrogen atoms in ZnPc with C–H units. ZnDPTBtransDAP is obtained by replacing two nitrogen atoms in ZnPc with C–C6H5 units.The calculated absorption spectra for ZnTBTrAP, ZnTBP, ZnMPTBTrAP and ZnDPTBtransDAP in the first singlet excited state, together with the ESA of ZnPc (black solid line), are shown in Fig. 7. For molecules ZnTBTrAP and ZnMPTBTrAP, only one nitrogen atom in ZnPc is replaced by C–H and C–C6H5, respectively. The positions of the two absorption band peaks of ZnTBTrAP and ZnMPTBTrAP are closer compared with those of ZnPc. These two band peaks merge into one band peak for ZnTBP and ZnDPTBtransDAP. It is also noted that the absorptions of these modified ZnPc molecules for the transition energies between 2.0 eV and 2.5 eV are enhanced compared with that of ZnPc. Consequently, the absorption spectrum of ZnPc can be modified smoothly by replacing nitrogen atoms in ZnPc with C–H or C–C6H5. These observations may be utilized in the field of searching for enhanced optical limiting materials.32 It should also be mentioned that the observed charge transfer characters of the transitions between the excited states for these modified ZnPc molecules are similar to those of ZnPc. Charge transfer also occurs between the edges and central parts of modified ZnPc. This is expected, as the structure of ZnPc is not totally destroyed with the present modifications.
C. First singlet excited state absorption of ZnPc dimers
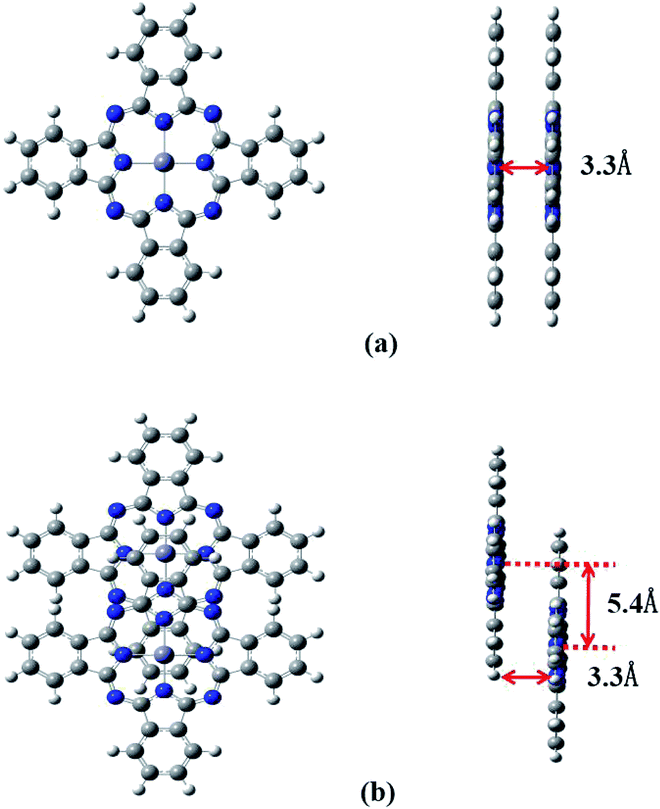
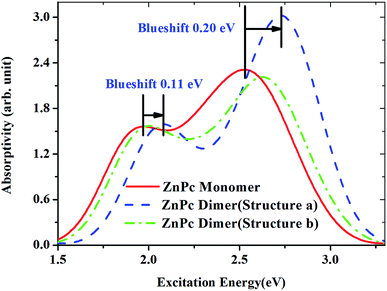
It is well known that phthalocyanines in solution systems and doped in solid substrates possess aggregated states, such as dimers, which seriously affect the optical-limiting effect.33 Here we investigated two configurations of ZnPc dimers. In one, the two ZnPc molecules are cofacially stacked. In the other configuration the two ZnPc molecules are cofacially stacked but with a slight shift. The distance between the two ZnPc molecules is fixed to 3.3 Å. Two ZnPc molecules are slipped 5.4 Å along the molecular axes in the second configuration. These configurations were reported by Yanagisawa et al.25 Fig. 8 presents diagrams of these configurations. Top view (left side) and side view (right side) are both shown for these two configurations. In order to investigate the effect of molecular stacking on the absorption spectra, the ZnPc dimer structures are not optimized but the monomer geometry is optimized.Fig. 9 shows the calculated absorption spectra for the ZnPc dimers with two different configurations in the first singlet excited state. For comparison, the absorption spectrum of the ZnPc monomer in the first singlet excited state is also included in Fig. 9 (red solid line). It is found that the band peaks of the ZnPc dimers are blueshifted compared with those of the ZnPc monomer. In addition, the blueshift depends on the geometrical overlap between the two ZnPc molecules. The ZnPc dimer with a complete overlapped configuration results in a larger blueshift compared with the configuration with partial overlap between the two monomers. Similar results were also observed by Yanagisawa et al. for ZnPc in the ground state.25 It was shown that the absorption spectra of ZnPc dimers with configurations (a) and (b) in the ground state both result in blueshift. In addition, the blueshift of the absorption spectrum for the ZnPc dimer with configuration (a) in the ground state is also larger compared with that for configuration (b). This was attributed to the fact that configurations (a) and (b) are typical H-aggregates. Dipolar coupling between the two ZnPc molecules results in the blueshift of the absorption band.34 The present paper shows that this is also true for the first singlet excited state absorption. According to Kasha’s transition dipole–dipole interaction model, it means that the excitations for the first singlet excited state absorption bands may also come from the monomer transition dipoles being arranged side-by-side.35
IV. Conclusions
In the present paper, the absorption spectra of ZnPc, modified ZnPc and ZnPc dimers in the first singlet excited state were simulated. The predicted absorption band peaks for ZnPc are in excellent agreement with experimental measurements. It is shown that the S1 → S3 and S1 → S24 transitions, respectively, are the dominant contributions to the experimentally observed two band peaks. The excited states S1 and S3 can be well characterized by a single electronic transition from the highest occupied natural transition orbital (HONTO) to the lowest unoccupied natural transition orbital. In contrast, the dominant transitions for the higher excited state S24 are HONTO → LUNTO and HONTO−1 → LUNTO+1. The NTO analysis, together with the calculations of electron density difference between the two excitations, reveals that the transitions (S1 → S3 and S1 → S24) both show charge transfer character but with different charge transfer directions. It is also shown that the absorption of ZnPc in the first singlet excited state can be tuned through chemical modification of the nitrogen atoms in ZnPc. The calculated absorption spectra of ZnPc dimers indicate that the aggregation of ZnPc may result in a blueshift of the absorption. These observations are useful for tuning the optical-limiting window of ZnPc.Conflicts of interest
There are no conflicts to declare.Acknowledgements
This work has been supported by the Jilin Province Science Fund for Excellent Young Scholar (No. 20180520189JH), Fund of the State Key Laboratory of Laser Interaction with Matter, China (SKLLIM1906), Key Research Program of Frontier Sciences, CAS (QYZDB-SSW-SLH014), Youth Innovation Promotion Association, CAS (2019220), The Key Laboratory of Functional Molecular Solids, Ministry of Education (FMS201933), Anhui Laboratory of Molecule-Based Materials (No. fzj19010) and Anhui Provincial Natural Science Foundation (No. 2008085MA25).References
- M. Malinauskas, A. Zukauskas, S. Hasegawa, Y. Hayasaki, V. Mizeikis, R. Buividas and S. Juodkazis, Light: Sci. Appl., 2016, 5, e16133 CrossRef CAS PubMed.
- S. Perumbilavil, A. López-Ortega, G. K. Tiwari, J. Nogués, T. Endo and R. Philip, Small, 2018, 14, 1701001 CrossRef PubMed.
- S. Chen, W. H. Fang, L. Zhang and J. Zhang, Angew. Chem., Int. Ed., 2018, 57, 11252 CrossRef CAS PubMed.
- G. Zhao, Y. Feng, S. Guang, H. Xu, N. Li and X. Liu, RSC Adv., 2017, 7, 53785 RSC.
- H. Xu, S. Q. Zhao, Y. Ren, W. Xu, D. B. Zhu, J. Z. Jiang and J. F. Cai, RSC Adv., 2016, 6, 21067 RSC.
- S. A. Fischer, C. J. Cramer and N. Govind, J. Phys. Chem. Lett., 2016, 7, 1387 CrossRef CAS PubMed.
- R. B. Roseli, P. C. Tapping and T. W. Kee, J. Phys. Chem. Lett., 2017, 8, 2806 CrossRef CAS PubMed.
- Y. Bai, J. H. Olivier, H. Yoo, N. F. Polizzi, J. Park, J. Rawson and M. J. Therien, J. Am. Chem. Soc., 2017, 139, 16946 CrossRef CAS PubMed.
- E. F. Oliveira, J. Shi, F. C. Lavarda, L. Luer, B. Milian-Medina and J. Gierschner, J. Chem. Phys., 2017, 147, 034903 CrossRef PubMed.
- S. Ling, S. Schumacher, I. Galbraith and M. J. Paterson, J. Phys. Chem. C, 2013, 117, 6889 CrossRef CAS.
- B. Q. Liu, L. Wang, D. Y. Gao, J. H. Zou, H. L. Ning, J. B. Peng and Y. Cao, Light: Sci. Appl., 2016, 5, e16137 CrossRef CAS PubMed.
- Z. Li, H. Li, B. J. Gifford, W. D. N. Peiris, S. Kilina and W. Sun, RSC Adv., 2016, 6, 41214 RSC.
- J. Savolainen, D. van der Linden, N. Dijkhuizen and J. L. Herek, J. Photochem. Photobiol., A, 2008, 196, 99 CrossRef CAS.
- D. R. Tackley, G. Dent and W. E. Smith, Phys. Chem. Chem. Phys., 2001, 3, 1419 RSC.
- N. Marom, O. Hod, G. E. Scuseria and L. Kronik, J. Chem. Phys., 2008, 128, 164107 CrossRef PubMed.
- M. S. Liao and S. Scheiner, J. Chem. Phys., 2001, 114, 9780 CrossRef CAS.
- P. N. Day, Z. Wang and R. Pachter, J. Mol. Struct.: THEOCHEM, 1998, 455, 33 CrossRef CAS.
- J. Ahlund, K. Nilson, J. Schiessling, L. Kjeldgaard, S. Berner, N. Martensson, C. Puglia, B. Brena, M. Nyberg and Y. Luo, J. Chem. Phys., 2006, 125, 034709 CrossRef PubMed.
- S. Ahmadi, M. N. Shariati, S. Yu and M. Gothelid, J. Chem. Phys., 2012, 137, 084705 CrossRef PubMed.
- T. C. VanCott, J. L. Rose, G. C. Misener, B. E. Williamson, A. E. Schrimpf, M. E. Boyle and P. N. Schatz, J. Phys. Chem., 1989, 93, 2999 CrossRef CAS.
- D. A. Fernández, J. Awruch and L. E. Dicelio, Photochem. Photobiol., 1996, 63, 784 CrossRef.
- D. S. Lawrence and D. G. Whitten, Photochem. Photobiol., 1996, 64, 923 CrossRef CAS PubMed.
- G. Ricciardi, A. Rosa and E. J. Baerends, J. Phys. Chem. A, 2001, 105, 5242 CrossRef CAS.
- R. F. Theisen, L. Huang, T. Fleetham, J. B. Adams and J. Li, J. Chem. Phys., 2015, 142, 094310 CrossRef PubMed.
- S. Yanagisawa, T. Yasuda, K. Inagaki, Y. Morikawa, K. Manseki and S. Yanagida, J. Phys. Chem. A, 2013, 117, 11246 CrossRef CAS PubMed.
- L. T. Ueno, A. E. H. Machado and F. B. C. Machado, J. Mol. Struct.: THEOCHEM, 2009, 899, 71 CrossRef CAS.
- X. Sheng, H. Zhu, K. Yin, J. Chao, J. Wang, C. Wang, J. Shao and F. Chen, J. Phys. Chem. C, 2020, 124, 4693 CrossRef CAS.
- M. J. Frisch, G. W. Trucks, H. B. Schlegel, G. E. Scuseria, M. A. Robb, J. R. Cheeseman, G. Scalmani, V. Barone, B. Mennucci, G. A. Petersson, H. Nakatsuji, M. Caricato, X. Li, H. P. Hratchian, A. F. Izmaylov, J. Bloino, G. Zheng, J. L. Sonnenberg, M. Hada, M. Ehara, K. Toyota, R. Fukuda, J. Hasegawa, M. Ishida, T. Nakajima, Y. Honda, O. Kitao, H. Nakai, T. Vreven, J. A. Montgomery Jr, J. E. Peralta, F. Ogliaro, M. Bearpark, J. J. Heyd, E. Brothers, K. N. Kudin, V. N. Staroverov, R. Kobayashi, J. Normand, K. Raghavachari, A. Rendell, J. C. Burant, S. S. Iyengar, J. Tomasi, M. Cossi, N. Rega, J. M. Millam, M. Klene, J. E. Knox, J. B. Cross, V. Bakken, C. Adamo, J. Jaramillo, R. Gomperts, R. E. Stratmann, O. Yazyev, A. J. Austin, R. Cammi, C. Pomelli, J. W. Ochterski, R. L. Martin, K. Morokuma, V. G. Zakrzewski, G. A. Voth, P. Salvador, J. J. Dannenberg, S. Dapprich, A. D. Daniels, O. Farkas, J. B. Foresman, J. V. Ortiz, J. Cioslowski, and D. J. Fox, Gaussian 09, Revision D.01, Gaussian, Inc., Wallingford, CT, 2009 Search PubMed.
- M. W. Schmidt, K. K. Baldridge, J. A. Boatz, S. T. Elbert, M. S. Gordon, J. H. Jensen, S. Kosekt, N. Matsunaga, K. A. Nguyen, S. J. Su, T. L. Windus, M. Dupuis and J. A. Montgomery, J. Comput. Chem., 1993, 14, 1347 CrossRef CAS.
- T. Lu and F. Chen, J. Comput. Chem., 2012, 33, 580 CrossRef CAS PubMed.
- D. N. Bowman, J. C. Asher, S. A. Fischer, C. J. Cramer and N. Govind, Phys. Chem. Chem. Phys., 2017, 19, 27452 RSC.
- N. Nwaji, J. Mack and T. Nyokong, New J. Chem., 2017, 41, 14351 RSC.
- J. Chen, Y. Xu, M. Cao, Y. Wang, T. Liang, H. Li, S. Wang and G. Yang, J. Mater. Chem. C, 2018, 6, 9767 RSC.
- N. C. Maiti, S. Mazumdar and N. Periasamy, J. Phys. Chem. B, 1998, 102, 1528 CrossRef CAS.
- M. Kasha, Radiat. Res., 1963, 20, 55 CrossRef CAS PubMed.
| This journal is © The Royal Society of Chemistry 2020 |

