 Open Access Article
Study on the interfacial properties of polymers around a nanoparticle
Chao-Yang Li *a,
Jian-Hua Huang
 b,
Hong Li
 c and
Meng-Bo Luo
 d
d
aDepartment of Physics, Hangzhou Normal University, Hangzhou 311121, China. E-mail: cyli@hznu.edu.cn
bDepartment of Chemistry, Zhejiang Sci-Tech University, Hangzhou 310018, China
cDepartment of Physics, Wenzhou University, Wenzhou 325035, China
dDepartment of Physics, Zhejiang University, Hangzhou 310027, China
First published on 28th July 2020
Abstract
The interfacial properties of polymer chains on spherical nanoparticles are investigated using off-lattice Monte Carlo simulations. Results show that the number of adsorbed monomers increases whereas the number of adsorbed polymers decreases with increasing the polymer–nanoparticle interaction strength. The interfacial layer thickness is independent of the nanoparticle size and chain length. The interfacial monomers exhibit layering behaviors with three distinct layers. The mobility of monomers in the innermost layer is strongly dependent on the polymer–nanoparticle interaction strength. The interfacial monomers always keep moving, and no glassy layer is present around the nanoparticle. Finally, our results show that the motion of nanoparticle can weaken the adsorption of polymers but does not change the conformational property of adsorbed polymers.
1. Introduction
Nanoparticles (NPs) in polymer nanocomposites (PNCs) lead to the appearance of new interfaces. PNCs have many novel physical properties in comparison to the bulk phase because of the coupling between polymers and NPs.1–5 For instance, the existence of nano-sized ZnO in natural rubber can increase the tensile strength and tensile modulus.6,7 The addition of organic NPs in polymer melts produces an increase in the viscosity and therefore shifts the glass transition temperature.8–10 The addition of silver NPs in polystyrene (PS)/poly(2-vinyl pyridine) (P2VP) can change the electrical behaviors and optical properties.11 Moreover, NPs, like dendrimers, can play essential roles in the delivery of DNA or drugs in biological systems.12–14 In medicine, there is growing attention on the topic to develop new and more efficient tools for NP-mediated drug delivery,15–17 a practice that is already in use for cancer treatment.18,19 The application of NPs in PNCs has driven an increased interest in experiments, theories, and computer simulations. Therefore, a detailed understanding of the equilibrium and dynamical properties of polymers near surfaces or interfaces of NP is essential for chemical and biological processes.The influence of NPs on properties of polymers is interesting from the experimental and simulation investigations.20–24 However, there is still a lack of consistent conclusion on this specific issue. Small Angle Neutron Scattering (SANS) experiments on poly(dimethylsiloxane) (PDMS) containing trimethylsilyl-treated polysilicate NPs showed a decrease in the dimension of PDMS for σn ≈ RG0 and an expansion of PDMS for σn < RG0, where σn is the diameter of NPs and RG0 is the radius of gyration of the polymer in dilute solution.20 Similarly, SANS experiment observed a 10–20% increase in the radius of gyration RG of deuterated polystyrene (d-PS) when σn < RG0,21 and it was confirmed by small angle X-ray scattering (SAXS) experiments.3 SAXS found that NPs have no measurable effect on RG of d-PS when σn > RG0.3 These results imply that the polymer chain swelling is directly related to the ratio RG0/σn. However, RG0/σn is not the only or crucial parameter for the change of polymer size. Recent molecular dynamics (MD) simulation studies showed that, for σn < RG0 case, the polymers swell if σn is larger than the monomer size while they contract if σn is smaller than the monomer size.17 Monte Carlo (MC) simulation studies pointed out that, even for σn < RG0 case, polymer chains can expand, shrink, or be unaffected by NPs.22,23 Polymer dimensions are highly dependent on the polymer–NP interaction strength and NP–NP distance.22,23
It is also essential to understand the dynamic behaviors of the interfacial polymer, including the adsorption/desorption process, the thermal motion, and the diffusion process. Mohammadreza et al. found that MCM-41 NPs in the reversible addition-fragmentation chain transfer polymerization (RAFT) can reduce the diffusivity of polymer chains and consequently slow down the propagation reactions.25 Using dynamic MC simulations, Hao et al. found that the diffusivity of polymers is controlled by NPs.26 Vacatello found that the attraction of NPs can slow the diffusion of polymers.27,28 And the diffusivity of polymers can be significantly reduced or even to zero if the attraction between polymer and NP is sufficiently strong.29–31 Moreover, the polymer dynamics is related to the concentration and distribution of NPs. The normal diffusion of polymers in dilute solution can be changed to the sub-diffusion in the media with stationary NPs.32 Although the diffusivity is slowed down by the attracting NPs, it was further pointed out that the polymer shows a normal diffusion in the system with orderly distributed NPs but a sub-diffusion in the system with randomly distributed NPs.22,23
It is generally believed that the change in size and dynamics of polymers are induced by the NP's excluded volume effect and polymer–NP interaction. And the interfacial properties of polymers are important factors to understand the behavior of polymers in PNCs. In this paper, we utilize dynamic MC simulation to unravel the interfacial properties of polymers. The adsorption of polymers, the distribution of monomers, and the mobility of interfacial monomers are investigated. We find that the interfacial region of NP can be separated into three layers based on the distribution of monomers. The mean square displacement of monomers (MSD), the fraction of initial monomers f(t), and the mean probability of monomer movement PMM in different interfacial layers are calculated to describe the dynamic properties of monomers. Our results can provide guidance for understanding the core–shell model and the large gradient of segmental mobility from the experiments.33,34
2. Model and simulation method
The simulation system is a cube of size L × L × L in the x, y, z directions. Periodical Boundary Conditions (PBC) are considered in all three directions. Np polymers of chain length n are placed in the system. The number density of monomers, ρ0 = 0.85, corresponding to a dense melt according to the work of Allegra.35 We adopt the chain length n = 64 and Np = 106 for the system size L = 20. L is much larger than twice the chain radius of gyration RG0, which can prevent polymers from interacting with themselves through PBC. The NP is modeled as a sphere of diameter σn and mobility μ. The NP is fixed in the center of the cube if μ = 0. A lot of novel properties have been observed when RG0 ≈ σn.36–38 Here σn = 5 is considered, corresponding to the high molecular weight system (RG0/σn = 1.13) according to the experimental research.33Each polymer is modeled as a linear polymer chain by using a typical bead-spring model developed by Kremer and Grest.39 All the monomers in the polymer are identical. The mass and diameter of monomer are m and σ, respectively. The interaction between non-bonded monomers is defined as a Lennard–Jones (LJ) potential of the form
 | (1) |
 We consider ε = 0.2 between two non-bonded monomers. The polymer behaves as a self-avoiding walk (SAW) polymer chain at this weak ε = 0.2.21,22 For the chemically bonded monomers, finitely extensive nonlinear elastic (FENE) interaction is adopted by the form
 | (2) |
The interaction between polymer and NP is modeled by another expanded LJ potential of the form
 | (3) |

We adopted the off-lattice dynamic MC algorithm and the metropolis algorithm to simulate the random motion of polymer. Dynamic MC algorithm follows the evolution of one element of the statistical ensemble and simulates the time evolution of the system without dealing with the master equation directly.41 Thus, dynamical MC algorithm is suited to describe dynamic properties such as monomer mobility. At the beginning of the simulation, Np polymers of length n are grown monomer by monomer according to the self-avoiding regulation in an amplified simulation system of size La × La × La (La = 24σ) because the polymers can be produced efficiently in an extensive system. Then, we randomly select one monomer and move it a small distance with dx, dy, and dz in x, y, and z directions. All dx, dy, and dz are random values within (−Δ, Δ). Here a small value Δ = 0.1σ is used. The attempted move will be accepted with a probability P = min[1, exp(−ΔE/kBT)], where ΔE is the energy shift due to the move. The time unit used in this paper is the MC step (MCS), which is arbitrarily defined and can be rescaled to the real-time unit by experiment or MD simulation. In one MCS every monomer tries to move 100 steps on average. The NP in our simulation can move according to the same role as for monomers. The mobility μ of NP is defined as the ratio of NP's movement steps to monomer's. We reduce the simulation system size L gradually from the initial La = 24σ to the desired L = 20σ with a small length step ΔL = 0.05σ for every 105 MCS. For every intermediate L, the coordinates of monomers and NP are multiplied by a factor (L − ΔL)/L accordingly. The small reduction step and long equilibrium time enable our system to reach equilibrium at every L. We find that the simulation results do not change if we further increase the equilibrium time or reduce the reduction step. When the system size reaches L = 20σ, the size of the system remains unchanged. The conformational and dynamic properties reported in this paper are obtained from the high density ρ = 0.85 at L = 20σ.
In the paper, the main variables are the polymer–NP interaction strength εpn, the polymer–NP distance, and the NP mobility μ. Our simulation results are averaged over 1000 independent runs. The statistical errors of our simulation results are found to be so small and can be negligible.
3. Results and discussions
The NP of σn = 5σ is much heavier than monomer if both NP and monomer have the same mass density, which results in a low mobility of NP. For simplification, we mainly simulate the adsorption, distribution, and mobility of interfacial monomers for stationary NP with μ = 0. At last, we study the effects of NP's mobility on the polymers.3.1. Adsorption of polymers
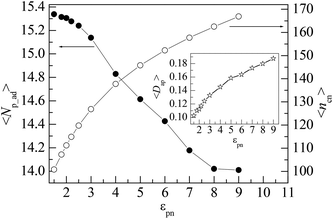
Polymer chains can be adsorbed on NP due to the attraction of NP or desorbed from NP because of the thermal motion of monomers. At the critical adsorption point (CAP), the fluctuation of polymer–NP contacts is the largest. The CAP is estimated to be εpn* = 1.5 for the polymer adsorbed on spherical NP.42 We define a polymer–NP contact if the center-to-center distance between NP and monomer is less than σ + σn/2 = 3.5σ as in this region the attraction is strong. At εpn > εpn*, the adsorbed and desorbed polymers can be distinguished from the contact number ncp. We define an adsorbed polymer as ncp > 0 and a desorbed polymer as ncp = 0. At εpn < εpn*, ncp > 0 only means an accidental contact event between polymer and NP because of the random thermal motion of polymers. Thus, we only consider the adsorption case at εpn > εpn* in this paper. Besides ncp for each polymer, we also monitor the following two variables to describe the adsorption of polymers. One is the number of adsorbed polymers Np_ad. The other is the number of total adsorbed monomers ncn that counts the number of monomers adsorbed on the NP. Here ncn is the sum of ncp of adsorbed polymers. The adsorption degree is defined as Dap = ncn/(nNp_ad), i.e., the fraction of the adsorbed monomers in all the adsorbed polymer chains.Fig. 1 presents the dependences of the mean number of adsorbed polymers 〈Np_ad〉 and the mean number of total adsorbed monomers 〈ncn〉 on the polymer–NP interaction strength εpn. Here 〈 〉 represents an ensemble average over all contact states. We can find that 〈Np_ad〉 decreases whereas 〈ncn〉 increases with the increase in εpn, which results in an increase in the mean adsorption degree 〈Dap〉 with εpn as shown in the inset of Fig. 1. The variations of 〈Np_ad〉 and 〈ncn〉 with εpn indicate that the incremental adsorbed monomers mainly come from the already adsorbed polymers and at the same time some of the adsorbed polymers are pushed away because of the excluded volume of the newly adsorbed monomers. The adsorption of the polymer will reduce the conformational entropy. Therefore, the simultaneous adsorption of too many chains is bad for free energy.
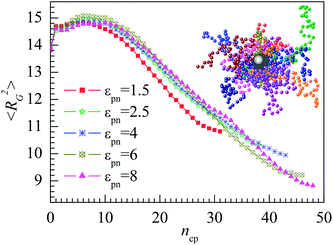
The attractive NP may change the polymer conformation which is usually characterized by the mean square radius of gyration 〈RG2〉. We calculate 〈RG2〉 of all adsorbed polymers. Fig. 2 presents the dependence of 〈RG2〉 on the number of polymer–NP contacts ncp for several εpns. 〈RG2〉 increase slightly at first and then decrease quickly with the increase in ncp. When a few monomers are adsorbed on the NP, the adsorbed polymers are stretched, resulting in the initial small increase in 〈RG2〉. The adsorption usually takes place at the end monomers of polymer because such a configuration has larger configuration entropy S than that adsorbed at the middle monomers. A snapshot of adsorbed polymers at εpn = 3 is presented in the inset of Fig. 2. When more and more monomers are adsorbed on the NP, the size of polymers will become smaller and smaller. These observations are in general agreement with our previous simulation results.43
3.2. Distribution of monomers
The adsorption of polymers on the NP not only changes the conformation of adsorbed polymers but also changes the number density of monomers around the NP. The number density of monomers ρ is defined as
 | (4) |
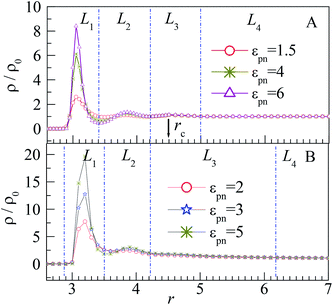
The distribution of monomers can be explained by the attraction of NP and the interaction among monomers. The peak in the L1 layer is mainly attributed to the attraction of NP as the NP–monomer distance is very short in this region. Thus, the influence of NP on the L1 layer is the most important, and the peak of the L1 layer increases significantly with εpn. Although the adsorbed monomers will pull the polymer near the NP because of the FENE interaction, the excluded volume effect of polymers pushes them away, which results in the peaks in the L2 and L3 layers. The two peaks are however microscopic because of large volumes of the L2 and L3 layers relative to that of the L1 layer. Also, the two peaks are independent of εpn because of the weak attraction of NP at the relative long NP–monomer distance. The monomers near the NP are adsorbed compactly on the NP, whereas those far away from the NP are loosely distributed, as shown in the inset of Fig. 2. For the monomers in the L4 layer, the NP–monomer distance is larger than the cut-off distance rc, and the influence of NP on monomers can be neglected. Also, at the junction of L1 and L2 layers, ρ/ρ0 exhibits a valley due to the repulsion of monomers in the L1 layer. As the number of monomers in the L1 layer increases with εpn, the valley becomes deeper.
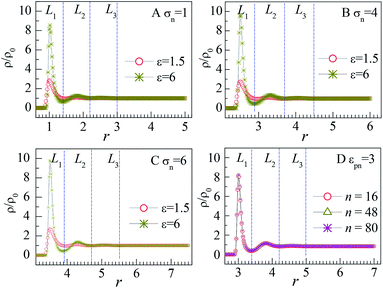
The influence of NP size and chain length on the distribution of monomers is also studied. For chain length n = 64, we calculated the distribution of interfacial monomers for different NP sizes. Fig. 4A–C present the dependence of the relative number density of monomers ρ/ρ0 on r for σn = 1, 4, and 6, respectively. For NP size σn = 5, we calculated the distribution of interfacial monomers for different chain lengths. Fig. 4D presents the dependence of ρ/ρ0 on r for n = 8, 48, and 80, respectively. We can see that the interfacial area also can be divided into three layers and the layer width is about 0.8σ. That is to say, the distribution of monomers around NP is independent of the diameter of NP and the chain length of the polymer, which is different from the experiment results. Dielectric spectroscopy found that the interfacial layer thickness increases with the diameter of NP.33,34 We conjecture that the different results between simulation and experiment are induced by the difference in concentration of monomers. So we further study the distribution of monomers for ρ0 = 0.28, corresponding to a semi-dilute solution.35 Fig. 3B shows the dependence of ρ/ρ0 on the radial distance r from the NP center. We can also see three interfacial layers where ρ/ρ0 is uneven. Compared with the interfacial layers at ρ0 = 0.85, the three interfacial layers have different thickness. Interestingly, the L3 layer has a very wide range with ρ/ρ0 > 1, resulting in a larger size interfacial region. That is to say, the concentration of polymer plays an important role on the interfacial layer thickness, which is consistent with the experimental findings.33 The difference in interfacial layer thickness can be explained from the competition between the chain crowding and the NP size. The chain crowding imposes stronger steric hindrances at the NP surfaces and reduces the interfacial layer thickness, whereas the larger NP has the larger volume-to-surface ratio and can increase the interfacial layer thickness. At ρ0 = 0.85, the chain crowding dominates and the effect of NP size can be neglected. Therefore, we only present our simulation results for σn = 5σ and n = 64 in this paper.
3.3. Mobility of interfacial monomers
To gain insight into the mobility of interfacial monomers, we calculate the mean square displacement (MSD) of monomers, which is defined as| 〈Δr2〉 = 〈[r→(t) − r→(0)]2〉, | (5) |
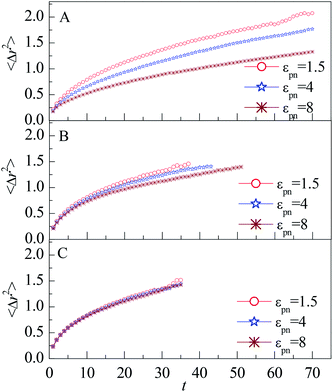 | ||
| Fig. 5 Mean square displacement of monomers vs. the residence time t for monomers in (A) L1, (B) L2, and (C) L3 layers, respectively. NP mobility μ = 0. | ||
The decrease of MSD with increasing εpn for monomers in the L1 and L2 layers indicate that the attraction of NP retards the diffusion of monomers. The number density of monomers ρ in the L1 layer increases quickly with εpn, as shown in Fig. 3A. The dynamics of monomers is slowed down by the crowded environment as well as by the strong attractive effect of NP. The attraction of NP can reduce the dynamics of monomers along the radial direction. Thus the mobility in the L1 layer decreases with an increase in εpn. The monomers in the L2 layer may connect with that in the L1 layer through FENE interaction. Thus the mobility of monomers in the L2 layer is partly slowed down. But the influence of NP on the monomers dies away for small εpn or large NP–monomer distance dnm.
It is well known that the monomers in the glass state are immobilized. In comparison with the glass state, the monomers in the interfacial regions can still move even at large εpn. To investigate the move of monomers in interfacial layers, we count the number of monomers, nim, which are initially in the layer at time t = 0. Fig. 6 presents the evolution of the fraction of initial monomers
 | (6) |
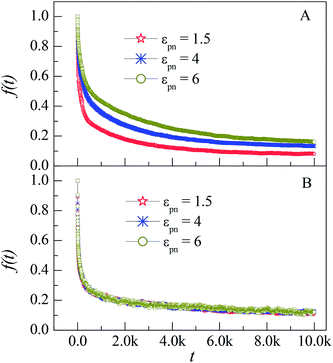 | ||
| Fig. 6 Dependence of the fraction of initial monomers f(t) on the simulation time t for monomers in the L1 (A) and L3 (B) layers at different εpns. NP mobility μ = 0. | ||
In our previous works, we have simulated the diffusion of a linear polymer in the sparse environment with periodically distributed NPs.22 We found that one polymer can be firmly adsorbed on one or two NPs and stop diffusion if the attraction is strong enough. Compared with the monomers in the sparse environment, polymers in the dense environment can always keep in motion. The reason is that only several monomers of a polymer can be adsorbed on the NP because of the crowded environment, as shown in the inset of Fig. 2. The irregular thermal motion of desorption monomers can help the adsorbed monomers to depart from the NP. So there is no glassy state or glassy layer around the NP in the dense environment.
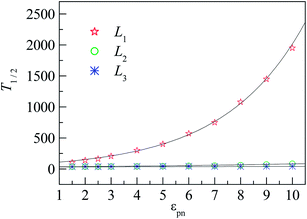
To quantify the effect of polymer–NP interaction on the mobility of monomers, we calculate the half-life period T1/2 of f(t) for the three interfacial layers. T1/2 means the time duration during which f(t) decreases from 1 to 0.5. Fig. 7 presents the dependence of T1/2 on the polymer–NP interaction strength εpn. We can see that T1/2 increases exponentially with εpn as T1/2 ∼ exp(αεpn). Here α = 0.32, 0.093, and 0.025 for monomers in the L1, L2, and L3 layers, respectively. We know that there is a potential barrier between two neighboring layers. The monomer motion from one layer to another must overcome the potential barrier. The potential barrier height increases with the increase in εpn and the decrease in monomer–NP distance. Thus, the mobility of monomers is sensitive to the attraction of NP in the L1 layer, and the value of α in the L1 layer is the largest. In brief, the monomers in the interfacial region exhibit a gradient mobility along the radical direction of NP.
During the dynamical MC simulation, the attempted movements of monomers are accepted according to the Metropolis algorithm. The acceptance probability can also reflect the mobility of monomers. We define the mean probability of monomer movement PMM as
 | (7) |
Here nm is the number of monomers in one layer, nmm is the number of monomers accepted to move in the same layer, and 〈 〉 represent an ensemble average over all MC steps, respectively. Fig. 8 shows the evolutions of PMM in different layers. In the L1 layer, PMM is strongly dependent on the polymer–NP interaction strength εpn. With the increase in εpn, the attraction of NP becomes more potent, and the attempted movement of monomer needs more energy, resulting in an obvious decrease in PMM. However, PMM roughly remains constant in the L2 and L3 layers. Moreover, PMM ≈ 0.64 in the L3 layer is roughly the same as that in bulk solution. The results further prove that there is a gradient of monomer mobility in the vicinity of NP.
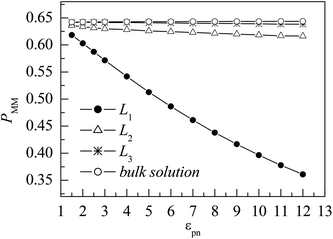 | ||
| Fig. 8 Dependence of the mean probability of monomer movement PMM on the polymer–NP interaction strength εpn for monomers in the three interfacial layers and the bulk solution. NP mobility μ = 0. | ||
3.4. Effects of NP mobility
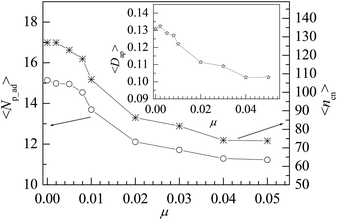
The mobile NP can accelerate the delivery of energy among monomers, which would influence the properties of interfacial polymers and monomers. As NP is heavier than that of monomer, we set μ < 1 in the simulation. We consider several values of NP mobility μ and calculate the interfacial properties for εpn = 3. Fig. 9 presents the dependence of the adsorption properties of polymers on the NP mobility μ. 〈Np_ad〉 and 〈ncn〉 decrease slowly with an increase in μ, indicating that the adsorption of polymers is weakened by NP mobility. The decrease in 〈Dap〉 with μ, as shown in the inset of Fig. 9, further proves this point.However, the NP of σn = 5σ is 125 times as heavy as the monomer if both NP and monomer have the same mass density. The approximate NP mobility is about μ = 0.008 based on the conservation of momentum. From Fig. 9, we can see that there is no remarkable difference in adsorption properties between the polymers at μ = 0.008 and μ = 0. Also, we study the distribution of interfacial monomers for different NP mobility μ at εpn = 3. The results show that the relative number density of monomers ρ/ρ0 has the same behaviors as that at μ = 0 shown in Fig. 3A. The conformational properties of adsorbed polymers are also calculated for different NP mobility μ at εpn = 3. Fig. 10 presents the dependence of 〈RG2〉 on μ. 〈RG2〉 keeps nearly a constant, indicating that the tiny change of 〈Dap〉 caused by the NP mobility has no apparent effect on the conformation of adsorbed polymers and the distribution of interfacial monomers. The dependence of the mobility of interfacial monomers on the NP mobility μ will be investigated in the future.
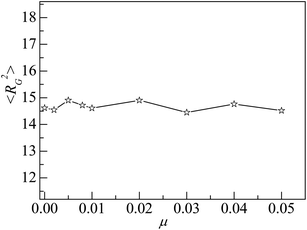 | ||
| Fig. 10 Mean square radius of gyration 〈RG2〉 of adsorbed polymers vs. the NP mobility μ. Here εpn = 3. | ||
4. Conclusions
In this work, the conformational and dynamic properties of polymers around the NP are studied using dynamic MC simulations. The polymer–NP interaction εpn is taken into account as the main factor. Simulations are carried out at high εpn above the critical adsorption point εpn* = 1.5. The adsorption and the conformation of polymers are dependent on the polymer–NP interaction strength εpn. With an increase in εpn, the mean number of adsorbed polymers 〈Np_ad〉 decreases, whereas the mean number of total adsorbed monomers 〈ncn〉 and the mean adsorption degree 〈Dap〉 of adsorbed polymers increase. The results indicate that the increased adsorbed monomers can push away some initially adsorbed polymers. The mean square radius of gyration 〈RG2〉 of adsorbed polymers decreases with increasing εpn, indicating that the NP can shrink the conformational size of adsorbed polymers.By analyzing the number density of monomers ρ along the radial direction of NP, we find that the interfacial region can be divided into three layers marked as L1, L2, and L3, respectively. The interfacial layer thickness is independent of the NP size and the chain length because of the chain crowding. By analyzing the mean square displacement (MSD), the fraction of initial monomers f(t), and the mean probability of monomer movement PMM, we find that the mobility of monomers increases with the decrease in εpn. Also, we find that the monomers in interfacial layers always keep moving, and there is no glassy layer around the NP. Finally, we have checked the influence of the mobility of NP on the interfacial properties of polymer chains. Results show that the motion of NP can weaken the adsorption of polymers but does not change the conformational property of adsorbed polymers.
Conflicts of interest
The authors declare that they have no conflicts of interest.Acknowledgements
This work was supported by the National Natural Science Foundation of China under Grant No. 11674277 and 11974305. Computer simulations were carried out in the High Performance Computing Center of Hangzhou Normal University, College of Science and High Performance Computing Center of Lishui University.References
- E. M. Zirdehi, T. Voigtmann and F. Varnik, J. Phys.: Condens. Matter, 2020, 32, 275104 CrossRef PubMed.
- N. Suzuki, M. B. Zakaria, Y. D. Chiang, K. C. W. Wu and Y. Yamauchi, Phys. Chem. Chem. Phys., 2012, 14, 7427–7432 RSC.
- M. K. Crawford, R. J. Smalley, G. Cohen, B. Hogan, B. Wood, S. K. Kumar, Y. B. Melnichenko, L. He, W. Guise and B. Hammouda, Phys. Rev. Lett., 2013, 110, 196001 CrossRef CAS PubMed.
- J. P. Jose and S. Thomas, Phys. Chem. Chem. Phys., 2014, 16, 20190–20201 RSC.
- N. Begam, D. A. Nimmi, S. Chandran, M. Ibrahim, V. Padmanabhan, M. Sprung and J. K. Basu, Soft Matter, 2018, 14, 8853–8859 RSC.
- Q. He, Y. J. Zhou, G. F. Wang, B. Zheng, M. Qi, X. J. Li and L. H. Kong, Appl. Nanosci., 2018, 8, 2009–2020 CrossRef CAS.
- P. Pornprasit, W. Pechurai, N. Chiangraeng, C. Randorn, N. Chandet, P. Mungkornasawakul and P. Nimmanpipug, Chiang Mai J. Sci., 2018, 45, 2195–2200 CAS.
- F. W. Starr, T. B. Schroder and S. C. Glotzer, Phys. Rev. E, 2001, 64, 021802 CrossRef CAS PubMed.
- F. Varnik and T. Franosch, J. Phys.: Condens. Matter, 2016, 28, 133001 CrossRef PubMed.
- A. Papon, H. Montes, M. Hanafi, F. Lequeux, L. Guy and K. Saalwachter, Phys. Rev. Lett., 2012, 108, 065702 CrossRef PubMed.
- P. P. Pandey, Soft Nanosci. Lett., 2015, 5, 3–11 CrossRef CAS.
- W. D. Tian and Y. Q. Ma, Chem. Soc. Rev., 2014, 42, 705–727 RSC.
- L. S. Mbathan and M. Singh, J. Nanosci. Nanotechnol., 2019, 19, 1959–1970 CrossRef PubMed.
- J. Y. Zhu, G. Wang, C. S. Alves, H. Tomas, Z. J. Long, M. W. Shen, J. Rodrigues and X. Y. Shi, Langmuir, 2018, 34, 12428–12435 CrossRef CAS PubMed.
- K. S. Soppimath, T. M. Aminabhavi, A. R. Kulkarni and W. E. Rudzinski, J. Controlled Release, 2001, 70, 1–20 CrossRef CAS PubMed.
- S. K. Lai, D. E. O'Hanlon, S. Harrold, S. T. Man, Y. Y. Wang, R. Cone and J. Hanes, Proc. Natl. Acad. Sci. U. S. A., 2007, 104, 1482–1487 CrossRef CAS PubMed.
- V. Sorichetti, V. Hugouvieux and W. Kob, Macromolecules, 2018, 51, 5375–5391 CrossRef CAS.
- I. Brigger, C. Dubernet and P. Couvreur, Adv. Drug Delivery Rev., 2008, 54, 631–651 CrossRef.
- K. Cho, X. U. Wang, S. Nie and D. M. Shin, Clin. Cancer Res., 2008, 14, 1310–1316 CrossRef CAS.
- A. I. Nakatani, W. Chen, R. G. Schmidt, G. V. Gordon and C. C. Han, Polymer, 2001, 42, 3713–3722 CrossRef CAS.
- A. Tuteja, P. M. Duxbury and M. E. Mackay, Phys. Rev. Lett., 2008, 100, 077801 CrossRef PubMed.
- C. Y. Li, C. J. Qian, Q. H. Yang and M. B. Luo, J. Chem. Phys., 2014, 140, 104902 CrossRef PubMed.
- C. Y. Li, M. B. Luo, J. H. Huang and H. Li, Phys. Chem. Chem. Phys., 2015, 17, 31877–31886 RSC.
- A. P. Holt, J. R. Sangoro and A. P. Sokolov, Macromolecules, 2015, 47, 1837–1843 CrossRef.
- S. Mohammadreza, P. Mehdi, S. K. Mehdi and A. Abbas, Iran. Polym. J., 2013, 22, 155–163 CrossRef.
- T. F. Hao, Z. P. Zhou, Y. Wang, Y. Liu, D. Zhang, Y. J. Nie, Y. Wei and S. J. Li, Monatsh. Chem., 2017, 148, 1285–1293 CrossRef CAS.
- M. Vacatello, Macromolecules, 2001, 34, 1946–1952 CrossRef CAS.
- M. Vacatello, Macromolecules, 2002, 35, 8191–8193 CrossRef CAS.
- J. H. Huang, Z. F. Mao and C. J. Qian, Polymer, 2006, 47, 2928–2932 CrossRef CAS.
- X. W. Huang, Y. Peng, J. H. Huang and M. B. Luo, Phys. Chem. Chem. Phys., 2017, 19, 29975–29983 RSC.
- Y. Peng, H. Zhang, X. W. Huang, J. H. Huang and M. B. Luo, Phys. Chem. Chem. Phys., 2018, 20, 26333–26343 RSC.
- W. P. Cao, L. Z. Sun, C. Wang and M. B. Luo, J. Chem. Phys., 2011, 135, 174901 CrossRef PubMed.
- A. P. Holt, V. Bocharova, S. Cheng, A. M. Kisliuk, B. T. White, T. Saito, D. Uhrig, J. P. Mahalik, R. Kumar, A. E. Imel, T. Etampawala, H. Martin, N. Sikes, B. G. Sumpter, M. D. Dadmun and A. P. Sokolov, ACS Nano, 2016, 10, 6843–6852 CrossRef CAS PubMed.
- S. Gong, Q. Chen, J. F. Moll, S. K. Kumar and R. H. Colby, ACS Macro Lett., 2014, 3, 773–777 CrossRef CAS.
- G. Allegra, G. Raos and M. Vacatello, Prog. Polym. Sci., 2008, 33, 683–731 CrossRef CAS.
- Q. Zhang and L. Archer, Macromolecules, 2004, 37, 1928–1936 CrossRef CAS.
- Q. Zhang and L. Archer, Langmuir, 2002, 18, 10435–10442 CrossRef CAS.
- Z. Zhu, T. Thompson, S. Q. Wang, E. D. von Meerwall and A. Halasa, Macromolecules, 2005, 38, 8816–8824 CrossRef CAS.
- K. Kremer and G. S. Grest, J. Chem. Phys., 1990, 92, 5057–5086 CrossRef CAS.
- D. Gersappe, Phys. Rev. Lett., 2002, 89, 058301 CrossRef PubMed.
- V. Guerra and D. Marinov, Plasma Sources Sci. Technol., 2016, 25, 045001 CrossRef.
- C. Y. Li, W. P. Cao, M. B. Luo and H. Li, Colloid Polym. Sci., 2016, 294, 1001–1009 CrossRef CAS.
- C. Y. Li, M. B. Luo, H. Li and W. P. Cao, Colloid Polym. Sci., 2017, 295, 2251–2260 CAS.
| This journal is © The Royal Society of Chemistry 2020 |

