
 Open Access Article
 This Open Access Article is licensed under a Creative Commons Attribution-Non Commercial 3.0 Unported Licence
Development of a novel Maillard reaction-based time–temperature indicator for monitoring the fluorescent AGE content in reheated foods
Bei Hua,
Lin Liab,
Yi Hua,
Di Zhaoa,
Yuting Lib,
Mingquan Yangc,
Aijuan Jiac,
Sui Chenc,
Bing Li*a and
Xia Zhang *a
*a
aSchool of Food Science and Engineering, Guangdong Province Key Laboratory for Green Processing of Natural Products and Product Safety, South China University of Technology, Guangzhou 510640, China. E-mail: bli@scut.edu.cn; cexzhang@scut.edu.cn; Tel: +86-20-8711-3252
bSchool of Chemical Engineering and Energy Technology, Dongguan University of Technology, College Road 1, Dongguan, 523808, China
cGuangdong MeiWeiXian Flavoring Foods Ltd. Co., Zhongshan, 528437, China
First published on 11th March 2020
Abstract
Dietary advanced glycation end products (AGEs) are formed via the Maillard reaction in foods, especially in reheated foods, and can cause chronic diseases. In this study, a series of Maillard reaction-based time–temperature indicators (TTIs: TTI-1, TTI-2, and TTI-3) were developed with lysine and xylose for monitoring the dynamic formation of fluorescent AGEs in reheated foods. The discoloration kinetics of Maillard reaction-based TTIs and the dynamics of fluorescent AGE formation were explored. Formulas were derived to illustrate the relationship of the color change in the TTIs with time and temperature. The activation energies (Ea values) for generating the TTIs were 96.17, 87.98, and 83.55 kJ mol−1, respectively. TTI-1 was the optimal indicator for instant soy milk powder because it showed the lowest activation energy difference in this study. The results show that this series of Maillard reaction-based TTIs can be used to monitor the AGE contents in various reheated foods.
1 Introduction
Advanced glycation end products (AGEs), known as glycotoxins, can direct processes that cause chronic diseases and related complications. The AGEs present in ingested food (dietary AGEs) contribute significantly to AGE levels in serum and organs after absorption in the small intestine.1 Several animal and clinical studies have reported that absorbed dietary AGEs may be hazardous because of their ability to combine with their receptors (RAGEs) in vivo.2–4 Dietary AGEs, which can accumulate in vivo, are associated with the generation and development of chronic diseases such as diabetes, cardiovascular disease and collagen disease.2,5–8 It is more necessary for customers suffering diabetes and kidney dysfunction to reduce the dietary AGE intake.The formation of AGEs in food is mainly attributed to the Maillard reaction; thus, factors such as temperature,9 time,10 ingredients,11,12 pH,13,14 and water activity,15 which influence the Maillard reaction, can affect the formation of AGEs. Choosing the right kinds of food and changing processing conditions are effective methods to reduce the ingestion of dietary AGEs.16
At present, the most common methods for detecting AGEs in food products are gas or liquid chromatography and enzyme-linked immunosorbent assay (ELISA).17 Some databases are available to help consumers select commercially available foods that have lower AGE contents.18,19 However, these database cannot offer comprehensive information about AGEs in common foods, and the AGE levels in consumed foods are still unpredictable and indistinct. In particular, foods may be reprocessed by customers, such as by reheating or stewing, which would induce the formation of AGEs. Heat is a common means to reprocess purchased foods, such as soymilk and canned mixed congee. In this case, consumers (especially those with diabetes and kidney dysfunction) require a more convenient, visual and effective way to monitor AGEs in foods reheated at home.
Time–temperature indicators (TTIs) are simple, inexpensive devices that can be attached to a package surface for the real-time monitoring of the quality of foods or drugs.20,21 TTIs show measurable and time–temperature dependent changes and can provide the temperature change history or indirectly indicate the actual quality of a product.21 Generally, when visible response of a TTI (such as a color change or mechanical deformation) matches food quality parameters in the same temperature environment, the food quality can be predicted by the TTI changes.22 TTIs greatly enhance consumer confidence in the quality of purchased foods due to their convenient, effective and observable characteristics.23 Based on their different mechanisms, TTIs are generally categorized as diffusion-based,24 chemical (polyreaction, photochromic reaction, redox reaction, etc.),21 enzymatic,25,26 biological (microbial),27 electronic28 and so on.
Recently, Maillard reaction-based TTIs have been widely applied in monitoring food quality due to their good performance in warning of temperature increases in chilled foods and the growth of microbes in food and food materials.29–31 In addition, Lee, Harada, Kawamura, & Koseki32 used D-ribose (7.0 mol kg−1) and L-lysine (3.0 mol kg−1) to develop a Maillard reaction-based TTI to ensure microbiological safety during cooking processes. These studies have demonstrated the feasibility of the Maillard reaction in establishing TTIs. Bosch, Alegría, Farré, & Clemente33 reported that fluorescent AGEs and color formation are markers of the advanced and final stages of the Maillard reaction. Both the brown compounds detected by the Maillard TTI and fluorescent AGEs are products of the Maillard reaction, suggesting the possibility of a Maillard reaction-based TTI for monitoring fluorescent AGEs in food. However, to the best of our knowledge, Maillard reaction-based TTIs of fluorescent AGEs in foods are currently scarce.
Therefore, in this study, a series of Maillard reaction-based TTIs (TTI-1, TTI-2, TTI-3) for monitoring AGEs were established using reducing sugars and amino acids. The kinetics of the TTI color change and fluorescent AGE formation in several kinds of food were explored. TTIs were investigated using instant soy milk as a model system to determine their practicality. This study may offer customers an easier option for determining the levels of AGEs in food during heat treatments (reheating, stewing, etc.). In addition, this work helps broaden the applicability of Maillard reaction-based TTIs and provides a theoretical basis for subsequent commercial applications.
2 Materials and methods
2.1 Materials
L-Lysine, L-arginine, glycine, L-alanine, D-(+)-glucose, D-fructose and D-(+)-galactose were purchased from Aladdin Bio-Chem Technology Co., Ltd. (Shanghai, China). Disodium phosphate dodecahydrate and sodium phosphate dibasic dihydrate were purchased from Sinopharm Chemical Reagent Co., Ltd. (Beijing, China). Instant soy milk powder was purchased from a supermarket in Canton (Guangzhou, China).2.2 Establishment of the model Maillard reaction-based TTI
Four amino acids (glycine, alanine, serine, and lysine) and three common reducing sugars (glucose, xylose, and galactose) were selected to construct the model TTIs. Solutions of amino acid and reducing sugar (both at 0.25 M) were combined and then mixed in a water bath (HH-4, Changzhou Aohua Instrument Co., Ltd., China) at 80 °C for 60 min. The absorbance of the solution at a wavelength of 420 nm,34,35 which reflects the major colored products of the Maillard reaction, was measured with a multimode reader (Infinite M200 Pro, Tecan, Switzerland) at 10 min intervals.To determine the optimal concentration of materials for the model TTI, different concentrations of amino acids and reducing sugars were investigated. Then, quantitative amounts of the amino acid and reducing sugar were dissolved in a series of 0.2 M PBS with pH values of 6.0, 6.5, 7.0, 7.5 and 8.0 (FiveEasy, Mettler Toledo, America) to determine the optimal pH of the reaction solution. All the mixed solutions were placed in a water bath at 80 °C for 30 min, and the UV absorbance was measured at 6 min intervals.
2.3 Determination of dynamic parameters of the model TTI
The model TTI was placed ina water bath at 70, 80, 90, 95 and 100 °C separately. The UV absorbance was monitored at a short intervals and recorded until the absorbance value went up to 1.2. Triplicate measurements were performed.The relation between the response variable and apparent reaction rate constant (response value growth rate) of the model TTI can be expressed as follow:20
| F(X) = kdT | (1) |
The color changes in Maillard reaction process can be characterized by UV absorbance. In this experiment, the TTI response variable X is the absorbance (A) of the model TTI. With the linear regression of the A value to t, the constants, k values at different reaction temperatures can be calculated as the slopes of straight lines numerically.
The temperature dependence chemical reaction should be described by the Arrhenius formula, so does the Maillard reaction of TTI.36 The activation energy of the model TTI can be gotten with the following formula:
k = k0![[thin space (1/6-em)]](https://www.rsc.org/images/entities/char_2009.gif) exp(−Ea·TTI/RT) exp(−Ea·TTI/RT)
| (2) |
The eqn (2) can be transformed into the following one:
|
lnk = lnk0 − Ea·TTI/RT
| (3) |
k value to against 1/T, Ea·TTI and k0 can be calculated. Ea·TTI is equal to the slope of straight line numerically.
2.4 Case study: application of TTI in instant soy milk powder
Instant soy milk powder, which was identified as having a high AGEs content,37 was selected as the model system for this work. The fluorescent AGEs in instant soy milk powder were detected according to a modified version of the method described by Ferrer et al.9 Pronase (1 mL, 35 U mL−1) was added to 2 mL of instant soy milk powder solution (protein content: 0.02–0.05 g mL−1) and heated at 30 °C for 90 min to terminate enzymolysis. Then, the samples were maintained at 70, 80, 90, 95 and 100 °C in a water bath, respectively, for 15 min prior to analysis. All fluorometric experiments were conducted using a multimode reader (Infinite M200 Pro, Tecan, Switzerland) at 3 min intervals. The excitation wavelength (λex) and the emission wavelength (λem) of fluorescent AGEs were 370 nm and 440 nm, respectively.38,39 The excitation and emission slit widths were set to 9.0 nm and 20.0 nm, respectively. The scan times were 25.| Q(A) = kfoodt | (4) |
In this study, Q(A) can be apparently characterized by the fluorescence intensity of AGEs. With the linear regression of scatter plot of fluorescence intensity of total fluorescence AGEs, the constant kfood at different reaction temperature can be calculated. Then, according to Arrhenius formula, Ea of fluorescent AGEs in instant soy milk powder can also be calculated.
2.5 Statistical analysis
The averages, standard deviations, reaction constant k and Ea were calculated for each sample with Microsoft Excel. Regression analysis and curve fitting of scatter diagram were carried out with Origin V8.0. Data were analyzed using SPSS 22.0 software, one-way analyses of variance with Duncan's multiple range tests were performed to test if statistically significant differences existed for absorbance in reaction system of different amino acids and reducing sugars release data at p < 0.05.3 Results and discussion
3.1 Determination of the model TTI
The Maillard reaction is an intricate interaction between carbonyl compounds (mainly reducing sugars) and amino compounds (amino acids, peptides and proteins), ultimately resulting in melanoidins.41 Melanoidins are a class of brown substances that can absorb 420 nm ultraviolet light.42,43 The absorbances of melanoidins (at 420 nm) derived from amino acids (glycine, alanine, serine, and lysine) and reducing sugars (glucose, xylose, and galactose) are presented in Table 1. The UV absorbance of Groups 1, 2, 3, 4, 5 and 6 increased gradually with incubation time (p < 0.05), and Group 1 (Xly + Lys) showed the strongest absorbance (Table 1). Kwak & Lim12 also found that among the 60 Maillard reaction products from combinations of 12 amino acids and 5 reducing sugars, the xylose-glycated sample showed the highest UV absorbance. In the Maillard reaction, pentoses were more active than hexose and lysine, which also includes ε-amidogen, resulting in more strongly colored products.44–46 The UV absorptions of Groups 7, 8, 9, 10, 11 and 12 (without xylose or lysine) were close to zero. In addition, the color changes in Group 1 could be recognized by the naked eye. Therefore, lysine and xylose were selected as the materials for the model TTI in this study.| Group | Solution | 0 min | 10 min | 20 min | 30 min | 40 min | 50 min | 60 min |
|---|---|---|---|---|---|---|---|---|
| a Gly, Ser, Ala and Lys stand for glycine, serine, alanine and lysine separately; Xyl, Glu and Gal stand for xylose, glucose and galactose separately; the alphabet (a–f) expressed significant difference (p < 0.05). | ||||||||
| 1 | Lys + Xyl | 0.010 ± 0.001ab | 0.124 ± 0.014a | 0.394 ± 0.124a | 0.737 ± 0.016a | 1.314 ± 0.038a | 1.906 ± 0.085a | 2.257 ± 0.150a |
| 2 | Gly + Xyl | 0.000 ± 0.002c | 0.024 ± 0.009c | 0.082 ± 0.014c | 0.174 ± 0.002c | 0.418 ± 0.015b | 0.648 ± 0.004b | 1.121 ± 0.003b |
| 3 | Lys + Gal | 0.015 ± 0.001a | 0.056 ± 0.013b | 0.237 ± 0.094b | 0.358 ± 0.008b | 0.441 ± 0.193b | 0.563 ± 0.110b | 0.616 ± 0.024c |
| 4 | Lys + Glu | 0.001 ± 0.001bc | 0.019 ± 0.019cd | 0.026 ± 0.001cd | 0.099 ± 0.018d | 0.175 ± 0.016c | 0.219 ± 0.040c | 0.415 ± 0.058cd |
| 5 | Ala + Xyl | 0.000 ± 0.019a | 0.000 ± 0.004e | 0.019 ± 0.002cd | 0.048 ± 0.003e | 0.171 ± 0.003b | 0.207 ± 0.063c | 0.307 ± 0.008de |
| 6 | Ser + Xyl | 0.003 ± 0.002bc | 0.006 ± 0.005de | 0.011 ± 0.003cd | 0.042 ± 0.005e | 0.128 ± 0.018c | 0.162 ± 0.000cd | 0.230 ± 0.006de |
| 7 | Gly + Gal | 0.006 ± 0.001ab | 0.006 ± 0.001cde | 0.009 ± 0.002cd | 0.008 ± 0.004f | 0.022 ± 0.004c | 0.023 ± 0.001de | 0.030 ± 0.001e |
| 8 | Ala + Glu | 0.004 ± 0.000bc | 0.003 ± 0.000e | 0.003 ± 0.000d | 0.004 ± 0.000f | 0.009 ± 0.009c | 0.004 ± 0.001e | 0.030 ± 0.015e |
| 9 | Ala + Gal | 0.008 ± 0.002ab | 0.010 ± 0.002cde | 0.012 ± 0.002cd | 0.009 ± 0.000f | 0.013 ± 0.001c | 0.013 ± 0.000de | 0.021 ± 0.001e |
| 10 | Ser + Gal | 0.006 ± 0.000ab | 0.010 ± 0.001cde | 0.032 ± 0.003cd | 0.011 ± 0.003f | 0.010 ± 0.001c | 0.018 ± 0.004de | 0.018 ± 0.002e |
| 11 | Ser + Glu | 0.002 ± 0.000bc | 0.001 ± 0.001e | 0.002 ± 0.001d | 0.002 ± 0.001f | 0.061 ± 0.008c | 0.003 ± 0.001e | 0.005 ± 0.001e |
| 12 | Gly + Glu | 0.000 ± 0.007abc | 0.002 ± 0.007e | 0.005 ± 0.003d | 0.004 ± 0.001f | 0.001 ± 0.003c | 0.000 ± 0.000e | 0.002 ± 0.001e |
To determine the optimal concentrations of xylose and lysine for the model TTI, the effects of the xylose and lysine concentrations on the absorbance changes of the colored products (melanoidin) were assessed, and the results are shown in Fig. 1. As the concentrations of xylose and lysine were increased and the reaction time was prolonged, the overall absorbances rose (Fig. 1a and b). When the concentration of lysine was higher than 0.3 M, the absorbance changed substantially with time. However, the reaction rate plateaued after 24 min in a solution with 0.5 M lysine (Fig. 1a). The color change in the mixture should be easily recognized by the naked eye, and this requires that the final absorbance values be greater than 1. Obviously, xylose concentrations of 0.3, 0.4 and 0.5 M were more suitable for establishing the TTI model (Fig. 1b). Thus, the optimal concentration of lysine was 0.4 M, and suitable concentrations of xylose were 0.3, 0.4 and 0.5 M.
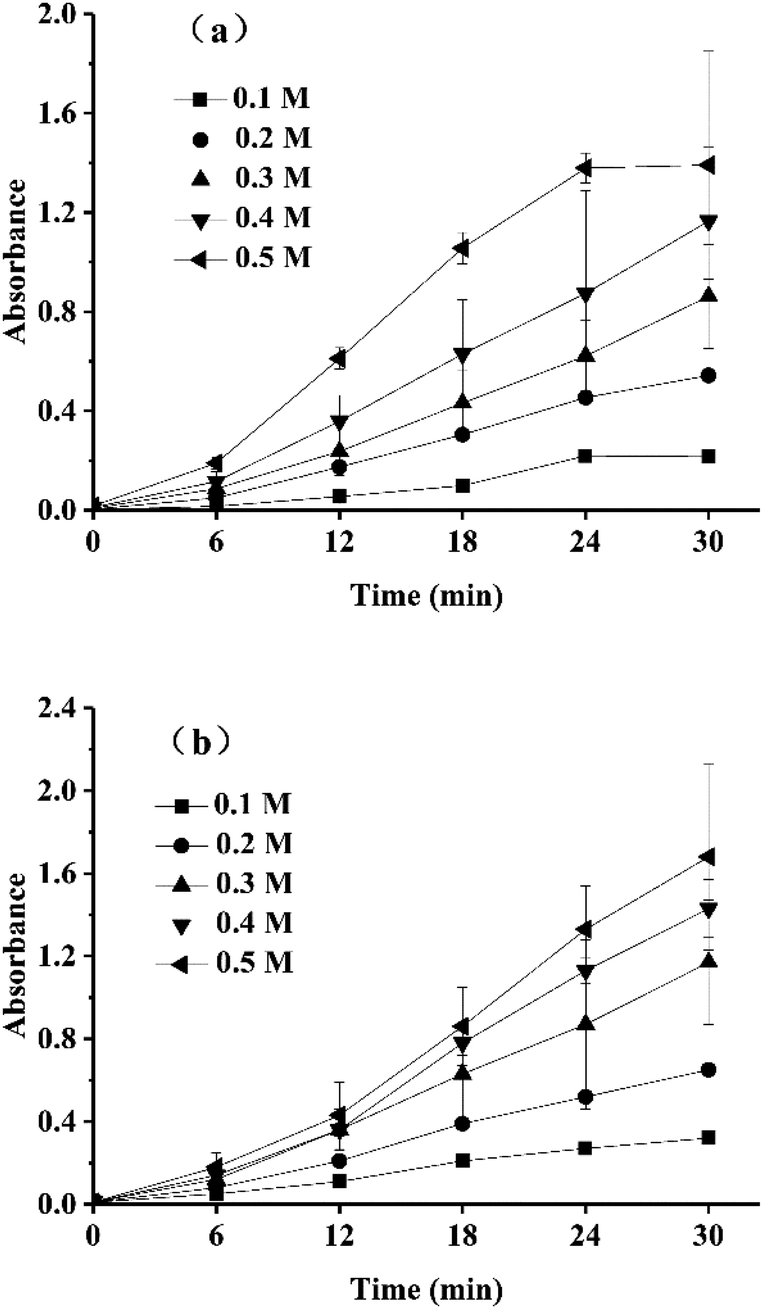 | ||
| Fig. 1 Change in absorbance (at 420 nm) in reaction system with 0.3 M xylose and different concentrations of lysine (a); change in absorbance (at 420 nm) in reaction system with 0.4 M lysine and different concentrations of xylose (b). | ||
Fig. 2 shows the changes in the formation of colored Maillard products at different pH values. There were no significant differences in the absorbances of the mixed solutions at different pH values (6–8). This is contrary to the findings that the nonenzymatic browning process of the Maillard reaction is facilitated by alkaline pH values47 and inhibited by acidic conditions because the free amidogen of the amino acids would be blocked and the carbonyl-amine condensation products would be easily hydrolyzed.48–50 This deviation might be due to the relatively low reaction temperature because higher temperatures afford Maillard reaction products with higher absorbances.47 As shown in Fig. 2, the final absorbance values at all pH levels ranged from 0.9 to 1.4, and these changes were thus all visible to the naked eye. Considering that the model TTI would be used for food, a pH of 7.0 was selected for safety reasons. The terminal absorbance value of the reaction was 1.2.
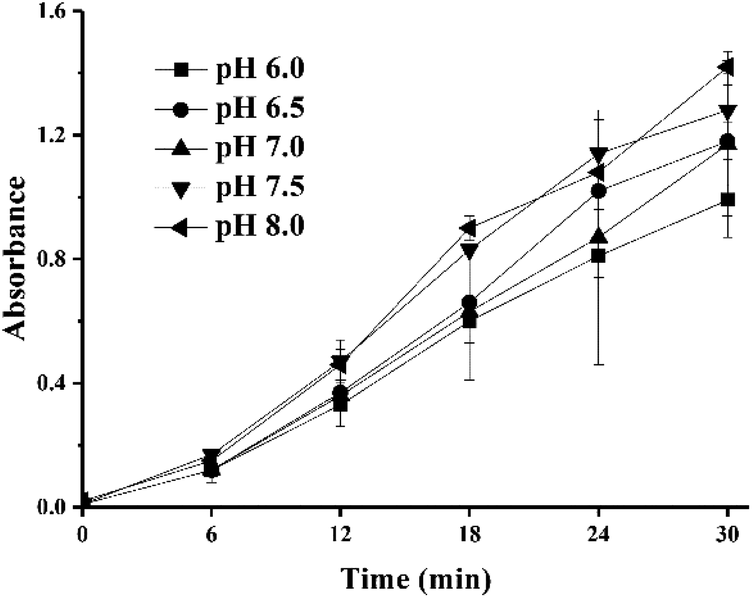 | ||
| Fig. 2 Effect of pH on the progress of UV absorbance at 420 nm in sample with 0.4 M lysine and 0.4 M of xylose. | ||
To summarize the above experiments, the materials and parameters of the model TTI were determined as follows: 0.4 M lysine and 0.3, 0.4 or 0.5 M xylose and PBS at pH 7.0. When the absorbance at a wavelength of 420 nm increased to 1.2, the reaction was complete. Table 2 shows a series of TTIs with different concentrations of lysine and xylose.
| TTI model | Lysine | Xylose | pH value of PBS |
|---|---|---|---|
| TTI-1 | 0.4 M | 0.3 M | 7.0 |
| TTI-2 | 0.4 M | 0.4 M | 7.0 |
| TTI-3 | 0.4 M | 0.5 M | 7.0 |
The change in color change in most TTIs can provide information on the cumulative time and temperature history,51 and the color changes of the TTIs should be easily recognized by the naked eye.31 Fig. 3 shows the changes in color of TTI-1 at 80 °C within 15 min. During the Maillard reaction, the color gradually changed from light yellow to dark brown, which could be easily recognized by the naked eye. In the Maillard reaction, higher molecular weight colored substances would be produced through the cross-linking of lower molecular weight chromophores and amidogens of amino acids or proteins.52 Therefore, the colored Maillard products would accumulate, resulting in a darker color as the reaction proceeds. TTI-2 and TTI-3 also showed similar color changes; these results are not shown.
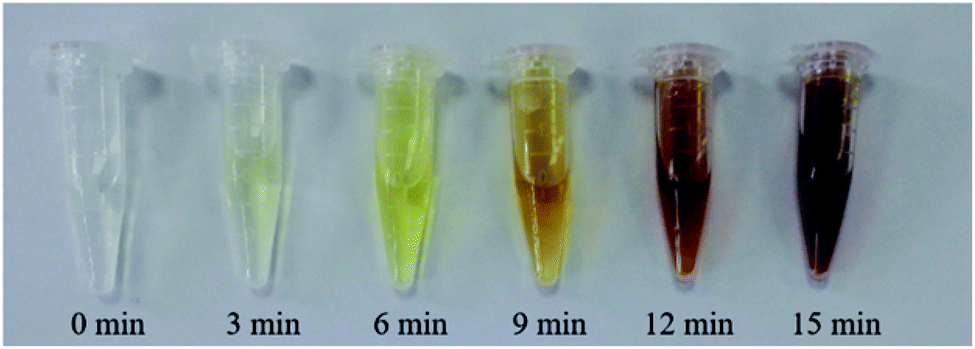 | ||
| Fig. 3 Color changes of TTI-1 during 15 min of incubation at 80 °C. | ||
3.2 Kinetics analysis of the TTI
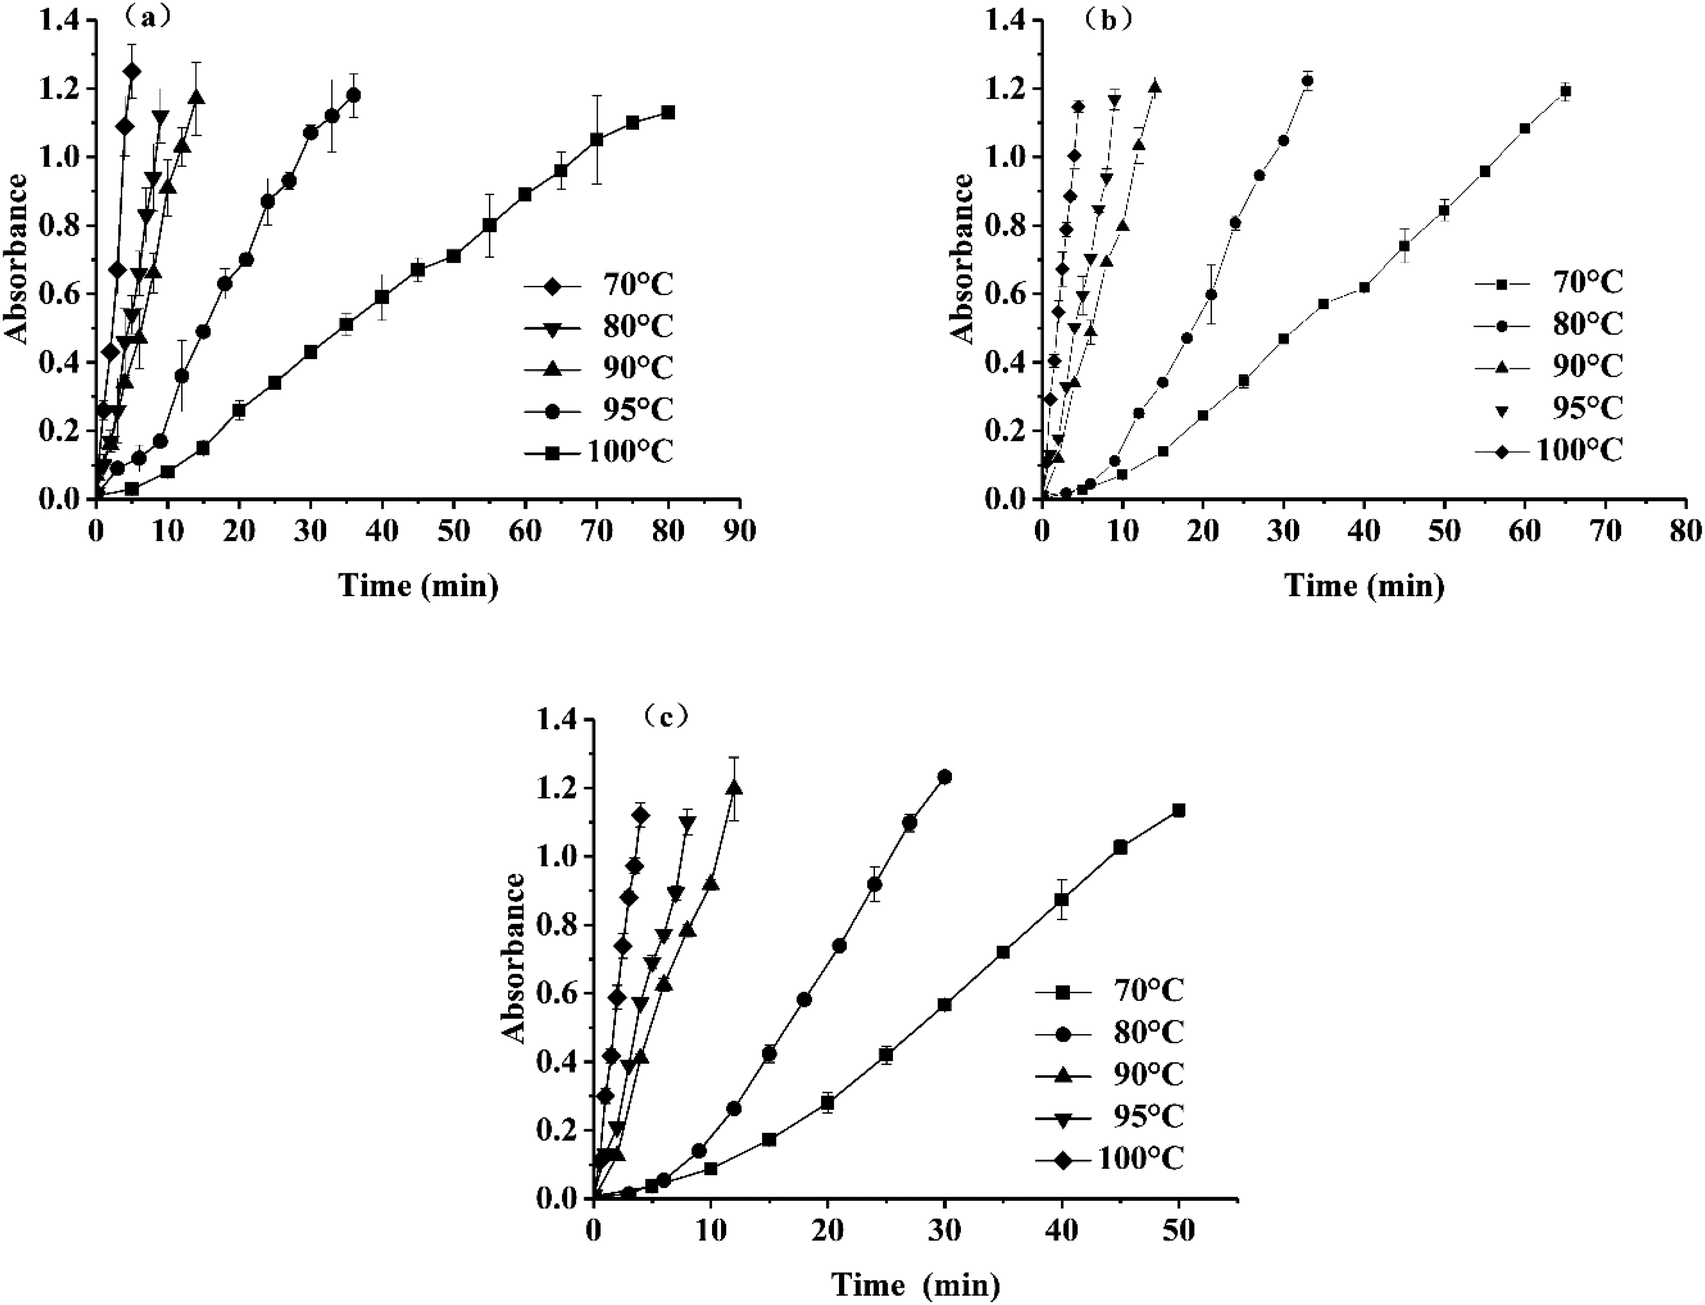 | ||
| Fig. 4 Change of absorbance of TTIs at different temperature, (a) for TTI-1, (b) for TTI-2, (c) for TTI-3. | ||
| TTIs | T (°C) | Equations | k (min−1) | R2 | 1/T × 1000 (K−1) | lnk |
|---|---|---|---|---|---|---|
| TTI-1 | 70 | y = 0.0152x − 0.0370 | 0.0152 | 0.9956 | 2.92 | −4.19 |
| 80 | y = 0.0356x − 0.4490 | 0.0356 | 0.9858 | 2.83 | −3.34 | |
| 90 | y = 0.0829x + 0.0203 | 0.0829 | 0.9908 | 2.75 | −2.49 | |
| 95 | y = 0.1235x + 0.0165 | 0.1235 | 0.9873 | 2.72 | −2.10 | |
| 100 | y = 0.2535x − 0.0134 | 0.2535 | 0.9844 | 2.68 | −1.37 | |
| TTI-2 | 70 | y = 0.0190x − 0.0960 | 0.0190 | 0.9881 | 2.92 | −3.96 |
| 80 | y = 0.0392x − 0.1585 | 0.0392 | 0.9658 | 2.83 | −3.24 | |
| 90 | y = 0.0866x − 0.0233 | 0.0866 | 0.9960 | 2.75 | −2.45 | |
| 95 | y = 0.1250x − 0.0218 | 0.1250 | 0.9908 | 2.72 | −2.08 | |
| 100 | y = 0.2516x − 0.0198 | 0.2516 | 0.9969 | 2.68 | −1.38 | |
| TTI-3 | 70 | y = 0.0242x − 0.1221 | 0.0242 | 0.9744 | 2.92 | −3.72 |
| 80 | y = 0.0442x − 0.1659 | 0.0442 | 0.9645 | 2.83 | −3.12 | |
| 90 | y = 0.0991x − 0.0148 | 0.0991 | 0.9906 | 2.75 | −2.31 | |
| 95 | y = 0.1346x − 0.0083 | 0.1346 | 0.9918 | 2.72 | −2.01 | |
| 100 | y = 0.2839x + 0.0031 | 0.2839 | 0.9966 | 2.68 | −1.26 |
For the various conditions, the fitting curves were approximately linear with correlation coefficients from 0.9844–0.9966, which indicated that the established linear regression equation was valid. Linear regression analysis confirmed a high linear relationship between the changes in the TTI absorbance and time. As derived from eqn (3), the dynamic parameters and the correlation coefficients under different temperatures are shown in Table 3.
k versus 1/T is shown in Fig. 5, and the activation energy (Ea) and pre-exponential factor (k0) can be obtained from the slope and intercept of the linear equation.
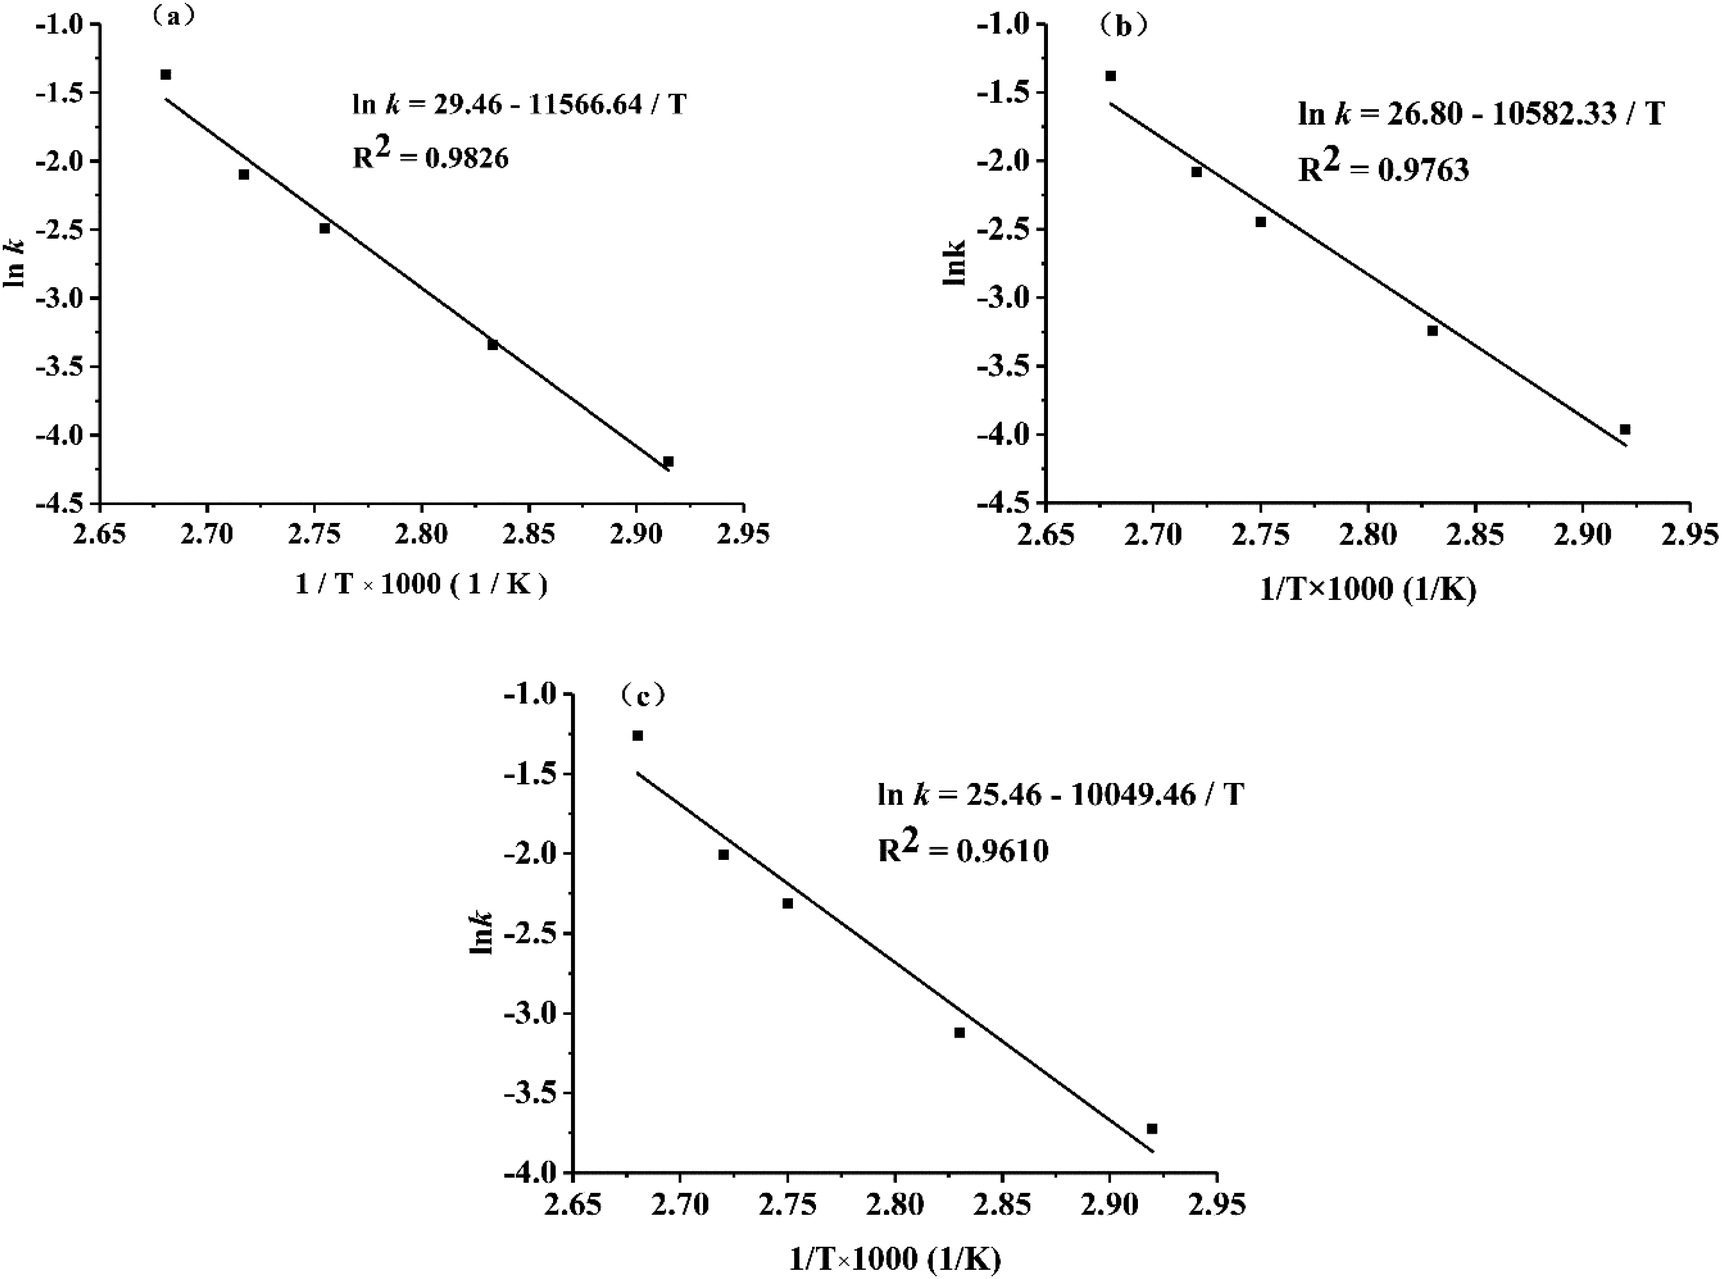 | ||
| Fig. 5 Arrhenius plot of lnk versus 1/T for TTI-1 (a), TTI-2 (b) and TTI-3 (c). | ||
Fig. 5 shows the Arrhenius plot of lnk vs. 1/T, and a high coefficient correlation for linearity (R2 = 0.9610–0.9826) was obtained in each TTI. Based on the fitting equation in Fig. 5 and eqn (4), the Ea of TTI-1 is 96.17 kJ mol−1, and the k0 value is 23 × 1012 min−1. Taoukis et al.20,53,54 suggested that the activation energy difference between the food being monitored and the TTI should be less than 25 kJ mol−1 to ensure the relevance of the TTI response. Therefore, TTI-1 can be applied in food systems in which the activation energy of AGE formation ranges from 71.17 kJ mol−1 (96.17–25 kJ mol−1) to 121.17 kJ mol−1 (96.17 + 25 kJ mol−1). Similarly, the Ea of TTI-2 is 87.98 kJ mol−1 and k0 = 4.36 × 10¹¹ min−1; the Ea of TTI-3 was 83.55 kJ mol−1 and k0 = 1.14 × 10¹¹ min−1. Thus, TTI-2 and TTI-3 are suitable for food systems with activation energy ranges of 62.98–112.98 kJ mol−1 and 58.55–108.55 kJ mol−1, respectively.
3.3 Fluorescent AGEs formation in instant soy milk and color change in the TTI
The color change in the TTI was compared with the formation of fluorescent AGEs in instant soy milk stored at different temperatures. The contents of fluorescent AGEs in instant soy milk at different temperatures are shown in Fig. 6. With increasing temperature, the fluorescence intensity increased gradually, and the fluorescence intensity changed faster at higher temperatures because the Maillard reaction is a typical endothermic reaction.41 The changes in AGEs levels in food (Fig. 6) were in accordance with the increased UV absorbance of the TTIs (Fig. 4). Thus, the formation of AGEs could be stimulated by elevated temperatures and increases over time.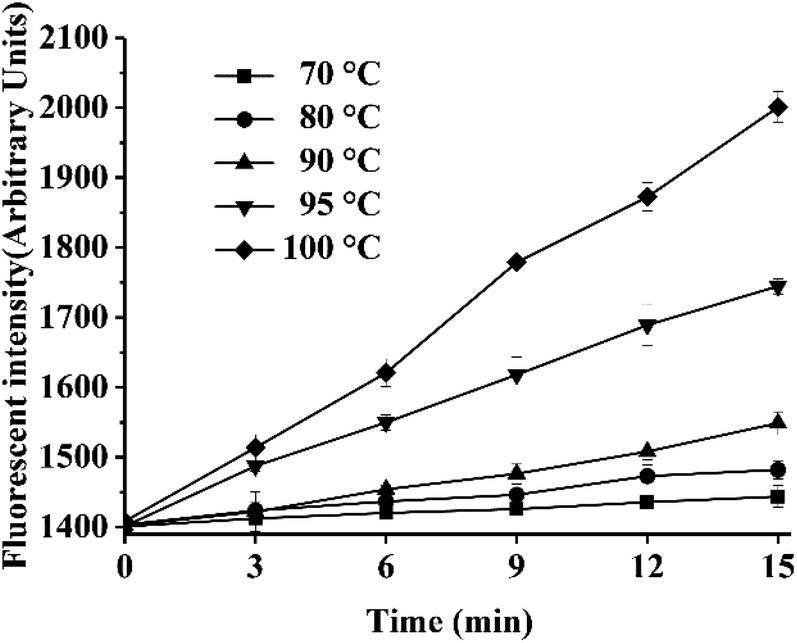 | ||
| Fig. 6 Content of total fluorescent AGEs in instant soy milk when heated at different temperatures. | ||
Subsequently, the activation energy of fluorescent AGEs formation in soy milk was calculated in the same way as the activation energy of the TTIs. The relationship between the fluorescence intensity of the soy milk powder and time at different temperatures is shown in Table 4. Similarly, as the rate of reaction increased with temperature, the rate constant, k, of the chemical reaction monotonically increased, and the chemical reaction kinetics of the formation of fluorescent AGEs and the colored Maillard reaction products were consistent. Under the various tested conditions, the fitting curves were approximately linear with very high correlation coefficients (R2 > 0.98), which indicated that the effect of the regression was remarkable and valid. On the basis of eqn (4) and the dynamic parameters (k values) shown in Table 4, the Arrhenius plot of the fluorescent AGEs in instant soy milk powder is shown in Fig. 7, and the activation energy (Ea) of the fluorescent AGEs and the pre-exponential factor (k0) were calculated as 93.78 kJ mol−1 and 4.32 × 10¹⁴ min−1, respectively. The activation energy deviations between fluorescent AGE formation in heated soy milk and TTI-1, TTI-2 and TTI-3 are 2.39, 5.80 and 10.23 kJ mol−1, respectively. These discrepancies are all less than 25 kJ mol−1, indicating that all these TTIs could be used to predict the levels of fluorescent AGEs in instant soy milk during heating. TTI-1 was selected as the optimum system for indicating the levels of fluorescent AGEs in instant soy milk as it showed the smallest difference in activation energy.
| Equations | T (°C) | k (min−1) | R2 | 1/T × 1000 (K−1) | lnk |
|---|---|---|---|---|---|
| y = 2.68x + 1403.94 | 70 | 2.68 | 0.9829 | 2.92 | 0.99 |
| y = 5.32x + 1403.94 | 80 | 5.32 | 0.9900 | 2.83 | 1.67 |
| y = 9.39x + 1397.91 | 90 | 9.39 | 0.9827 | 2.75 | 2.24 |
| y = 22.72x + 1410.06 | 95 | 22.72 | 0.9946 | 2.72 | 3.12 |
| y = 40.64x + 1407.57 | 100 | 40.64 | 0.9966 | 2.68 | 3.70 |
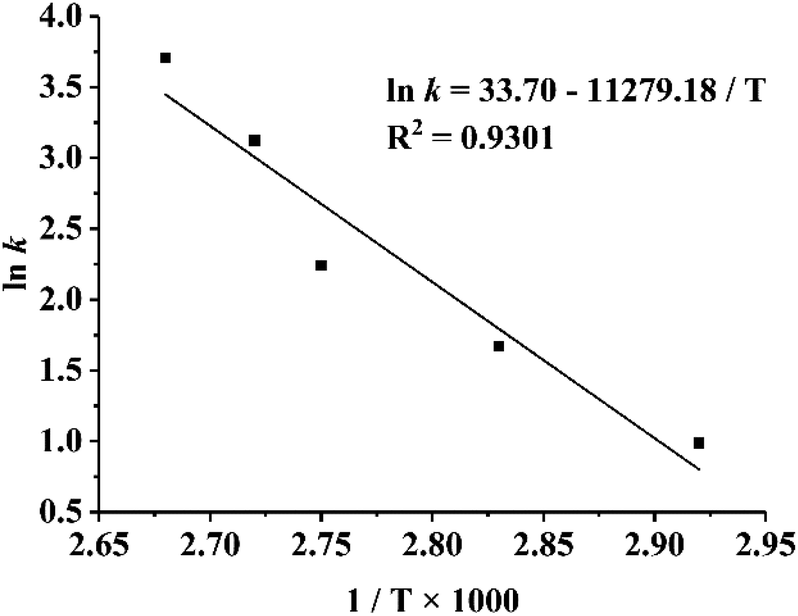 | ||
| Fig. 7 Arrhenius plot of lnk vs. 1/T for fluorescent AGEs. | ||
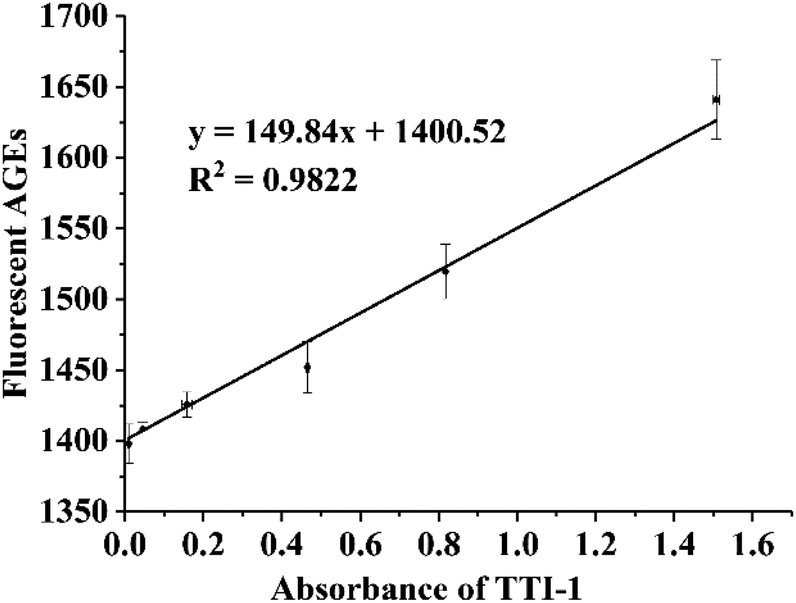
The fitting curve of the fluorescence intensity of the AGEs and the UV absorbance of TTI-1 is shown in Fig. 8. The high correlation coefficient (R2 = 0.9822) demonstrates that TTI-1 should accurately indicate the level of fluorescent AGEs in instant soy milk during heating.
 | ||
| Fig. 8 Scatter plot and fitting curve of TTI-1 vs. total fluorescent AGEs in instant soy milk powder. | ||
According to the color change dependence on time and temperature, a colorimetric card was developed based on the fitting equation to express the total fluorescent AGE level in instant soy milk powder. As shown in Fig. 9, customers can estimate the AGE level in soybean milk by using this colorimetric card.
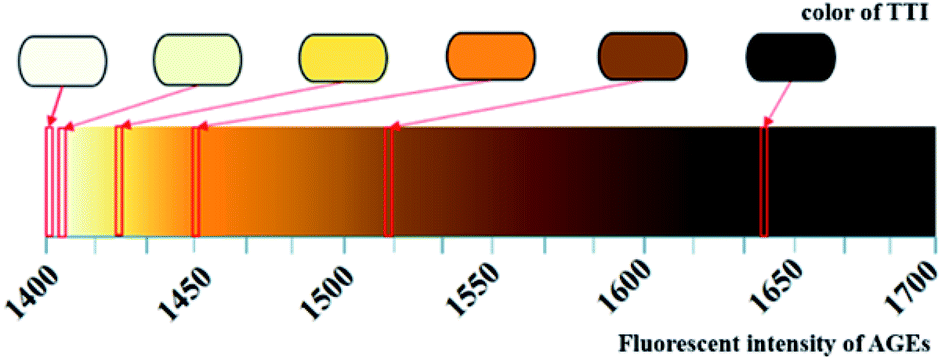 | ||
| Fig. 9 Colorimetric card of TTI-1 in instant soy milk powder. | ||
In addition, a series of TTIs suitable for different kinds of foods have been developed, so this Maillard reaction-type TTI can be applied to various foods. Referring to the method of Ferrer, et al.9 with some modification, the activation energy values of fluorescent AGE formation in soy sauce, milk powder, canned mixed congee and soybean paste were also determined, and they were 75.55 kJ mol−1, 106.12 kJ mol−1, 62.95 kJ mol−1 and 81.04 kJ mol−1, respectively. According to the Ea differences between the TTIs and the fluorescent AGEs (which should be less than 25 kJ mol−1), TTI-3 could be used to indicate the levels of fluorescent AGEs in soy sauce, canned mixed congee and soybean paste, and TTI-1 could be used for milk powder.
3.4 The 3D packaging container model with TTI
The model TTI and the color changes in TTI-1 during 15 min of incubation at 80 °C are shown in Fig. 10. The materials were sealed in a plastic bag. The selected plastic bag should be resistant to high temperatures (100 °C), seal tightly and allow good heat transfer.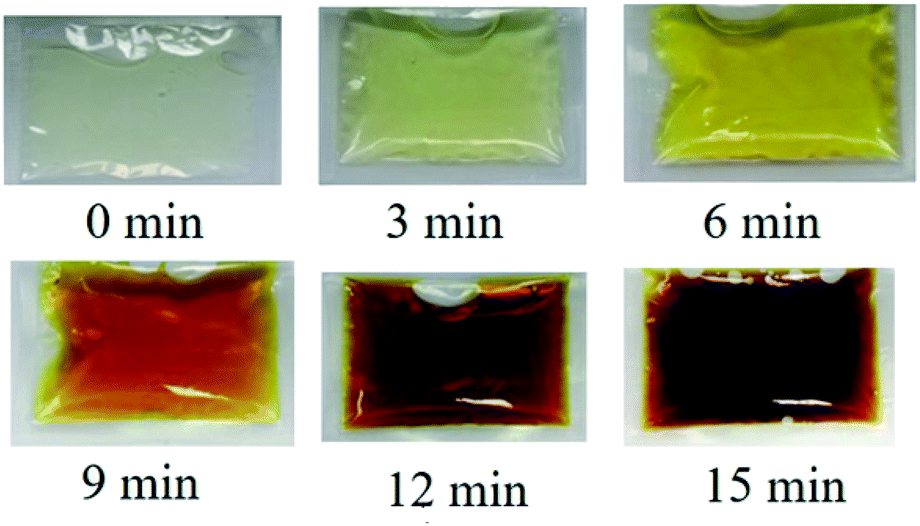 | ||
| Fig. 10 The model of TTI and color changes of TTI-1 during 15 min of incubation at 80 °C. | ||
The instant soy milk powder was packaged in a cup (Fig. 11). The inside of the cup is a waterproof layer with good heat transfer, which can ensure that the TTI and the soy milk are not in direct contact with each other but are at the same temperature. The outside of the cup is a thermal insulating layer to prevent consumers from being burned. The TTI was embedded in hollowed-out part of the outer layer. When the soy milk powder was brewed with hot water, AGEs were continuously generated in the soy milk in the cup, and the embedded TTI changed color. The consumers observed the TTI color and then compared the final color to the colorimetric card to determine the content of AGEs in the soy milk.
 | ||
| Fig. 11 Package design of instant soy milk powder. | ||
Similarly, this system is compatible with other packaging shapes, such as cuboid and hemispherical packages, that would suit different foods that need to be reheated.
4 Conclusions
A prototype Maillard reaction-based TTI composed of xylose and lysine was developed in this study. The materials, response variables and Arrhenius behavior of the TTIs were evaluated. According to the Ea difference with various concentrations of lysine/xylose, a series of Maillard reaction-based TTIs were established for use with various foods, as the Ea difference between the TTI and the food should be less than 25 kJ mol−1. The results showed that the levels of AGEs in reheated foods could be characterized by the model TTI. Instant soy milk powder was used as a model system to demonstrate the practicality of using TTIs to indicate the level of fluorescent AGEs in foods, and this system provides a research basis for the practical application of the developed Maillard reaction-based TTIs for various reheated foods.Further research is needed to determine suitable forms for the TTIs for different kinds of foods on the basis of the food processing and consumption methods. Increasing the indication accuracy and broadening the applied range would facilitate the commercialization of this Maillard reaction-based TTI.
Author contributions
Data curation: Bei Hu, Yuting Li and Bing Li; formal analysis: Bei Hu, Lin Li, Mingquan Yang, Aijuan Jia, Sui Chen and Xia Zhang; methodology: Bei Hu, Yi Hu and Yuting Li; writing—original draft: Bei Hu; writing—review & editing: Lin Li, Di Zhao, Bing Li and Xia Zhang.Conflicts of interest
There are no conflicts to declare.Acknowledgements
This work is supported by the National Key R&D Program of China (No. 2017YFC1600401), the National Natural Science Foundation of China (No. 31671961 & 31701727), Key Projects of Guangdong Natural Science Foundation (No. 2017A030311021), Key Projects of Guangzhou S&T Program (No. 201904020005), the Fundamental Research Funds for the Central Universities, SCUT (No. 2019ZD41), the CIUC of Zhongshan (No. 2016C1013) and Research star-up funds of DGUT (GC300502-36).References
- M. Li, M. Zeng, Z. He, Z. Zheng, F. Qin, G. Tao, S. Zhang and J. Chen, J. Agric. Food Chem., 2015, 63, 1658–1663 CrossRef CAS PubMed.
- M. W. Poulsen, R. V. Hedegaard, J. M. Andersen, C. B. De, S. Bügel, J. Nielsen, L. H. Skibsted and L. O. Dragsted, Food Chem. Toxicol., 2013, 60, 10–37 CrossRef CAS PubMed.
- N. Grossin, F. Auger, C. Niquet Leridon, N. Durieux, D. Montaigne, A. M. Schmidt, S. Susen, P. Jacolot, J. B. Beuscart, F. J. Tessier and E. Boulanger, Mol. Nutr. Food Res., 2015, 59, 927–938 CrossRef CAS PubMed.
- D. Zhao, L. Li, T. T. Le, L. B. Larsen, G. Su, Y. Liang and B. Li, J. Agric. Food Chem., 2017, 65, 5778–5788 CrossRef CAS PubMed.
- K. J. Bar, S. Franke, B. Wenda, S. Muller, R. Kientsch-Engel, G. Stein and H. Sauer, Neurobiol. Aging, 2003, 24, 333–338 CrossRef CAS PubMed.
- A. Gautieri, F. S. Passini, U. Silván, M. Guizar-Sicairos, G. Carimati, P. Volpi, M. Moretti, A. Redaelli, M. Berli and J. G. Snedeker, Matrix Biol., 2017, 59, 95–108 CrossRef CAS PubMed.
- H. Vlassara and J. Uribarri, Curr. Diabetes Rep., 2014, 14, 453 CrossRef PubMed.
- H. Vlassara, J. Uribarri, W. Cai, S. Goodman, R. Pyzik, J. Post, F. Grosjean, M. Woodward and G. E. Striker, Clin. J. Am. Soc. Nephrol., 2012, 7, 934–942 CrossRef CAS PubMed.
- E. Ferrer, A. Alegria, R. Farre, G. Clemente and C. Calvo, J. Agric. Food Chem., 2005, 53, 4911–4917 CrossRef CAS PubMed.
- T. Henle, Amino Acids, 2005, 29, 313–322 CrossRef CAS PubMed.
- D. Laroque, C. Inisan, C. Berger, É. Vouland, L. Dufossé and F. Guérard, Food Chem., 2008, 111, 1032–1042 CrossRef CAS.
- E. J. Kwak and S. I. Lim, Amino Acids, 2004, 27, 85–90 CrossRef CAS PubMed.
- S. I. F. S. Martins, W. M. F. Jongen and M. A. J. S. van Boekel, Trends Food Sci. Technol., 2000, 11, 364–373 CrossRef CAS.
- E. H. Ajandouz, V. Desseaux, S. Tazi and A. Puigserver, Food Chem., 2008, 107, 1244–1252 CrossRef CAS.
- L. Jiménez-Castaño, M. Villamiel, P. J. Martín-álvarez, A. Olano and R. López-Fandiño, Food Hydrocolloids, 2005, 19, 831–837 CrossRef.
- P. Chao, C. Hsu and M. Yin, Food Chem., 2009, 113, 262–266 CrossRef CAS.
- G. Chen and J. S. Smith, Food Chem., 2015, 168, 190–195 CrossRef CAS PubMed.
- J. L. J. M. Scheijen, E. Clevers, E. Lian, P. C. Dagnelie, F. Brouns, C. D. A. Stehouwer and C. G. Schalkwijk, Food Chem., 2015, 190, 1145–1150 CrossRef.
- H. Glj, J. V. Woodside, J. M. Ames and G. J. Cuskelly, Food Chem., 2012, 131, 170–174 CrossRef.
- P. S. Taoukis and T. P. Labuza, J. Food Sci., 1989, 54, 783–788 CrossRef.
- S. Wang, X. Liu, M. Yang, Y. Zhang, K. Xiang and R. Tang, Packag. Technol. Sci., 2015, 28, 839–867 CrossRef CAS.
- M. J. Kim, H. W. Shin and S. J. Lee, Food Control, 2016, 70, 167–173 CrossRef CAS.
- K. S. Pennanen, C. Focas, V. Kumpusalo Sanna, K. Keskitalo Vuokko, I. Matullat, M. Ellouze, S. Pentik Inen, M. Smolander, V. Korhonen and M. Ollila, Packag. Technol. Sci., 2015, 28, 303–323 CrossRef.
- J. U. Kim, K. Ghafoor, J. Ahn, S. Shin, S. H. Lee, H. M. Shahbaz, H. H. Shin, S. Kim and J. Park, LWT–Food Sci. Technol., 2016, 67, 143–150 CrossRef CAS.
- A. P. Brizio and C. Prentice, J. Food Sci., 2015, 80, M1271–M1276 CrossRef CAS PubMed.
- D. Wu, S. Hou, J. Chen, Y. Sun, X. Ye, D. Liu, R. Meng and Y. Wang, LWT–Food Sci. Technol., 2015, 60, 1100–1104 CrossRef CAS.
- L. Young-Soon, S. Homma and K. Eun-Jung, Food Sci. Technol. Res., 2013, 19, 319–322 CrossRef.
- A. W. Edwards, K. Blackler, R. D. Gill, E. V. D. Goot and J. Holm, Elements, 2015, 11, 323–329 CrossRef.
- T. Yamamoto and K. Isshiki, Jpn. J. Food Chem. Saf., 2012, 19, 84–87 CAS.
- H. Fujikawa, T. Yoshikawa, S. Hasegawa, T. Hayashi, T. Aoyama, T. Ogata, H. Cho, T. Oshima, Y. Rino and S. Morita, Ann. Surg. Oncol., 2014, 21, 3002–3007 CrossRef CAS PubMed.
- H. Rokugawa and H. Fujikawa, Food Control, 2015, 57, 355–361 CrossRef CAS.
- J. H. Lee, R. Harada, S. Kawamura and S. Koseki, Food Bioprocess Technol., 2018, 11, 185–193 CrossRef CAS.
- L. Bosch, A. Alegría, R. Farré and G. Clemente, Food Chem., 2007, 105, 1135–1143 CrossRef CAS.
- D. Zhao, L. Li, D. Xu, B. Sheng, D. Qin, J. Chen, B. Li and X. Zhang, Food Hydrocolloids, 2018, 80, 122–129 CrossRef CAS.
- M. G. Huang, X. M. Zhang, K. Eric, S. Abbas, K. Hayat, P. Liu, S. Q. Xia and C. S. Jia, J. Pept. Sci., 2012, 18, 342–349 CrossRef CAS PubMed.
- B. Fu and T. P. Labuza, Food Control, 1993, 4, 125–133 CrossRef.
- H. W. Bian, Y. T. Li, B. Li, Q. Y. Fu and L. Li, Mod. Food Sci. Technol., 2014, 30, 223–228 CAS.
- K. Yamaguchi, Y. Nomi, T. Homma, M. Kasai and Y. Otsuka, Food Sci. Technol. Res., 2012, 18, 67–76 CrossRef CAS.
- P. J. Beisswenger, S. Howell, T. Mackenzie, H. Corstjens, N. Muizzuddin and M. S. Matsui, Diabetes Technol. Ther., 2012, 14, 285–292 CrossRef CAS PubMed.
- B. Fu and T. P. Labuza, J. Food Distrib. Res., 1992, 23, 9–18 Search PubMed.
- L. C. Maillard, C. R. Acad. Sci., 1912, 154, 66–68 CAS.
- J. A. Ruriánhenares and F. J. Morales, J. Agric. Food Chem., 2008, 56, 2357–2362 CrossRef PubMed.
- F. J. Morales, V. Somoza and V. Fogliano, Amino Acids, 2012, 42, 1097–1109 CrossRef CAS PubMed.
- A. N. Wijewickreme, D. D. Kitts and T. D. Durance, J. Agric. Food Chem., 1998, 45, 4577–4583 CrossRef.
- M. J. Friedman, Agric. Food Chem., 1996, 44, 631–653 CrossRef CAS.
- M. Qian, W. Bai, W. Zhao, X. Liu and X. Zeng, Food Sci., 2016, 37, 31–35 Search PubMed.
- H. L. Wu, Z. Q. Wang, C. Han, Z. N. Peng and Y. Q. Chen, Mod. Food Sci. Technol., 2010, 26, 441–444 CAS.
- E. H. Ajandouz, L. S. Tchiakpe, F. D. Ore, A. Benajiba and A. Puigserver, J. Food Sci., 2001, 66, 926–931 CrossRef CAS.
- E. H. Ajandouz and A. Puigserver, J. Agric. Food Chem., 1999, 47, 1786–1793 CrossRef CAS PubMed.
- H. E. Nursten, The Maillard Reaction: Chemistry, Biochemistry and Implications, 2005 Search PubMed.
- X. Wan and M. Knoll, J. Food Eng., 2016, 168, 79–83 CrossRef.
- T. Hofmann, J. Agric. Food Chem., 1998, 46, 3891–3895 CrossRef CAS.
- P. S. Taoukis, in Food Process Modelling, 2001, pp. 402–431 Search PubMed.
- P. S. Taoukis and T. P. Labuza, Novel Food Packaging Techniques, 2003, pp. 103–126 Search PubMed.
| This journal is © The Royal Society of Chemistry 2020 |