DOI:
10.1039/D0RA00785D
(Paper)
RSC Adv., 2020,
10, 11121-11131
Preparation and properties of CF–Fe3O4–BN composite electromagnetic wave-absorbing materials
Received
25th January 2020
, Accepted 3rd March 2020
First published on 17th March 2020
Abstract
A three-layered electromagnetic (EM) wave-absorbing material was prepared by depositing a Fe3O4 and boron nitride (BN) coating onto the surface of a carbon fiber (CF) by in situ hybridization. The structure, chemical composition, morphology, high-temperature resistance, EM characteristics and EM wave absorption of the composite materials were analyzed. The composite materials contained CFs, and Fe3O4 was distributed along the axial direction of the fiber, whereas BN was found in the outermost coating layer. The proposed preparation method improved the oxidation resistance and EM wave absorption of CF. When the solubility of the metal salt was 20 g/100 ml, the decomposition temperature of the prepared CF/Fe3O4(3)/BN increased by more than 200 °C compared with that of CF/Fe3O4(3). The EM wave loss of less than −5 dB ranged within 8.8–18 GHz, and the effective EM wave-absorbing bandwidth (R < −10 dB) was 4.2 GHz (11.2–15.4 GHz). The prepared CF-based composite material had a lightweight structure, wide absorption band, and strong oxidation resistance. All these findings can serve as a reference for the study of other EM wave-absorbing materials.
1 Introduction
Electromagnetic (EM) waves within the gigahertz range are increasingly applied in wireless communication tools for civilian use, local area networks, personal digital assistants, and other communication equipment. The increased use of EM wave equipment has caused serious electromagnetic interference and electromagnetic compatibility problems in the environment.1–3 In addition, the concealment of moving targets and constructions in the military under radar detection is also very important. Developing a new material with strong environmental adaptability to the EM wave absorption, whether for solving electromagnetic pollution or improving the camouflage performance of the target, is highly necessary. This material can be used to reduce EM energy through simple composite technology using its dielectric or magnetic loss. In addition, an EM wave-absorbing material can be used to minimize EM reflection on metal surfaces (e.g., aircraft, ships, tanks, anechoic chambers, and electronic equipment walls).4,5
Carbonaceous materials, in particular carbonaceous fibrous materials, are effective candidate materials to obtain lightweight and efficient EM wave-absorbing materials. Carbonaceous materials can be obtained by simple processing of polyacrylonitrile fibers, viscose fibers, pitch fibers, and similar products.6–9 Carbon fiber (CF) materials are lightweight and easy to mold, and they exhibit a certain degree of flexibility. As CFs, activated CFs and carbon nanotubes have been applied in EM wave absorption.10–13 The main loss of carbonaceous materials is dielectric loss, and these materials have poor EM wave absorption.14,15 Studies have shown that combining carbonaceous materials with materials possessing magnetic loss can further improve the EM wave absorption of composite materials. Wan et al. loaded FeCo onto the surface of a CF by electroplating to improve the EM wave absorption of the material.16 Huang et al. combined a cobalt zinc ferrite magnetic material with flakey graphite to prepare an absorber with excellent EM wave absorption properties.17 Ning et al. combined carbon nanotubes with magnetic particles to prepare EM wave-absorbing materials.18 Although the application temperature of carbon magnetic composite materials reaches 400 °C, the durability and oxidation resistance at high temperatures should be improved.19,20 Studies have shown that BN has good high-temperature and oxidation resistance.21 Coating BN onto the surface of CF and graphene results in considerably improved high-temperature resistance. In addition, BN is also widely used in EM wave absorption. Combining carbon magnetic materials and BN may achieve unexpected results.22,23
In our previous study, the combination of carbonaceous fibrous structure and magnetic substances was confirmed to effectively improve the EM wave absorption capacity of composite materials.11,13,24 This article aims to expand the use of a carbonaceous fiber as a new type of absorbing material and further improve the comprehensiveness of composite materials. Considering the characteristics of CF, Fe3O4 magnetic material, and BN, a CF–Fe3O4–BN (CF/Fe3O4/BN) composite material was prepared by simple in situ hybridization. The structure, oxidation resistance, magnetic properties, and microwave absorption properties of the prepared composites were also studied. The results show that Fe3+ ion concentration led to different forms of Fe3O4 particles on the carbonaceous fibers and plays an important role together with BN. In addition, the enhanced microwave absorption properties of the composite materials can be attributed to the compensation properties of the carbonaceous fibers, Fe3O4, and BN and the three-dimensional network structure. Therefore, CF/Fe3O4/BN composites have a great potential in the development of lightweight and high-efficiency EM wave-absorbing materials.
2 Experimental section
2.1. Sample preparation
By in situ hybridization at high temperature, Fe3O4 and BN are loaded on the carbon fiber; the process route is shown in Fig. 1. In detail, 4 g glucose was dissolved into 100 ml distilled water followed by the addition of 30 g FeCl3 to form a homogeneous solution. A polyacrylonitrile (PAN)-based pre-oxidative felt was added to the solution, whereby a rolling surplus rate of 500% was achieved. After drying, the PAN-based pre-oxidative fibers, which contained metal salts, were heat-treated at 650 °C for 60 min in N2 gas, the surface of the CF was covered with a layer of Fe3O4, and CF/Fe3O4(3) was obtained. Finally, the as-obtained CF/Fe3O4(3) was added to the solution that contained 1 mol of H3BO3 and CO (NH2)2 per liter, and the rolling ratio was 200%. The solution was then dried and treated at 550 °C for 30 min, and finally CF/Fe3O4(3)/BN was obtained. The amount of Fe3O4 in the composites was regulated by the addition of different amounts of FeCl3 and glucose, specifically 0 g, 5 g and 10 g for FeCl3, and 0 g, 0.67 g and 1.33 g for glucose. Using the above-mentioned experimental procedure, the final products were obtained and denoted as CF/BN, CF/Fe3O4(1), CF/Fe3O4(2), CF/Fe3O4(1)/BN, and CF/Fe3O4(2)/BN, respectively.
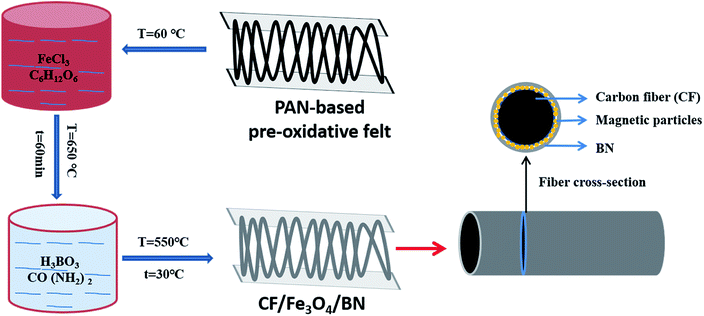 |
| | Fig. 1 Preparation process for CF/Fe3O4/BN composites. | |
2.2. Characterization
Phase structural analysis of the prepared CF/FeCoNi/BN was performed by X-ray diffraction (XRD, Rigaku D/max-2500PC) with Cu Kα radiation. A scanning electron microscope (SEM; Scios DualBeam) equipped with an energy-dispersive spectrometer (EDS) was used for morphological observations and elemental analyses. The chemical states were characterized by X-ray photoelectron spectroscopy (XPS; Thermo Fisher Scientific ESCALAB-250) with Cu Kα radiation. The magnetic properties were analyzed using a vibrating sample magnetometer (VSM; Quantum Design MPMS) at 300 K. The formation mechanism was analyzed by thermogravimetry/differential scanning calorimetry (TG/DSC; Netzsch 214 Polyma) at a heating rate of 10 °C min−1 from 30 °C to 1000 °C in an argon atmosphere in the presence of air. EM parameters (relative complex permittivity and relative complex permeability) were evaluated using a vector network analyzer (VNA; CeyearAV3672C) in the frequency range of 2.0–18.0 GHz. Before the test, the sample was thoroughly mixed with paraffin in a mass ratio of 3![[thin space (1/6-em)]](https://www.rsc.org/images/entities/char_2009.gif) :
:![[thin space (1/6-em)]](https://www.rsc.org/images/entities/char_2009.gif) 7 and then pressed into a coaxial ring with an outer diameter of 7 mm and an inner diameter of 3.04 mm. The reflection coefficient (RC) of the composites was determined in the frequency ranges of 8.2–12.4 GHz and 12–18 GHz by the NRL arc method. A metal sheet (180 mm × 180 mm) and the composite with the same dimensions were successively placed on a sample platform, and two horn antennas were used to send and receive the EM wave normal to the sheet.
7 and then pressed into a coaxial ring with an outer diameter of 7 mm and an inner diameter of 3.04 mm. The reflection coefficient (RC) of the composites was determined in the frequency ranges of 8.2–12.4 GHz and 12–18 GHz by the NRL arc method. A metal sheet (180 mm × 180 mm) and the composite with the same dimensions were successively placed on a sample platform, and two horn antennas were used to send and receive the EM wave normal to the sheet.
3 Results and discussion
3.1. Crystal structure
The crystal diffraction patterns of the samples prepared under different conditions are shown in Fig. 2. The PAN-based preoxygen filaments were impregnated with a mixed solution of FeCl3 and glucose and subjected to high-temperature treatment at 650 °C under the protection of nitrogen, and FeCl3 was thermally decomposed. The reduction reaction produced Fe3O4 (PDF # 74–0748) magnetic particles, and nonmagnetic Fe2O3 (PDF # 74–0748). Subsequent immersion in a mixture of urea and boric acid followed by high-temperature treatment led to the formation of BN (PDF # 45-0895) on the outermost layer of the CF. However, CF/Fe3O4/BN did not show remarkable (002) and (100) plane diffraction peaks at 26.5° and 43.3°. This result was primarily to the fact that the positions of 21.6° and 43.3° are typical CF diffraction peaks,25 while the position at 43.3° is also a strong diffraction peak of Fe3O4. The heat-treatment temperature was low (550 °C), and the treatment time was not long (30 min). The final CF covering film did not have abundant BN, and the generated BN was primarily amorphous, resulting in a broadened diffraction peak and weak intensity.26
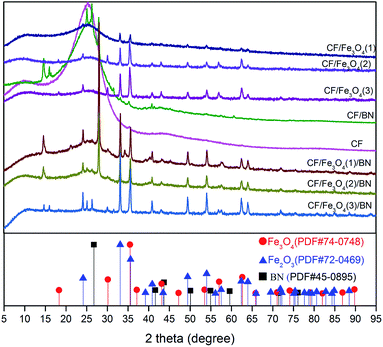 |
| | Fig. 2 XRD profiles for CF, CF/Fe3O4, and CF/Fe3O4/BN composites. | |
3.2. Morphological analyses
Fig. 3 shows the scanning electron micrograph of the prepared sample. Fig. 3(a) illustrates that the surface of the CF fiber had obvious grooves, which is a typical PAN-based CF after stretching treatment.24 After the BN doping, the grooves on the fiber surface were reduced, and the coating was distributed on the fiber surface. Fig. 3(c) and (d) show the morphology of the fiber surface after being impregnated with different concentrations of FeCl3 solution and heat treated. The particles on the fiber surface were distributed along the fiber axis, and as the concentration of the FeCl3 solution increased, the fiber surface particulate matter increased. The morphology of the loaded particulate matter also changed. When the concentration of FeCl3 was 20 g/100 ml, a large number of scaly particles were generated onto the surface of the fiber. The XRD analysis showed that the particle species contained Fe3O4, which is a typical EM wave-absorbing material.27 Scale-like structures have been reported to increase EM wave absorption.28 Fig. 3(f)–(h) display the morphology of the fiber surface after CF/Fe3O4 covered the BN coating, and the fiber surface was basically covered by the coating. The uniform distribution of the magnetic particles and BN onto the surface of the fiber was beneficial to maintain the stability and improve the oxidation and corrosion resistances of the material. Furthermore, a gap existed between the fibers, which was beneficial for the penetration of the EM in the material and to reduce the loss caused by the EM in the material.
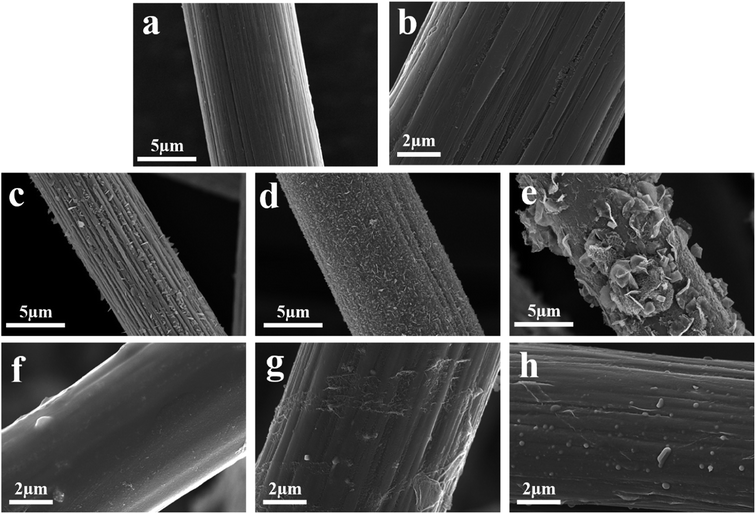 |
| | Fig. 3 SEM images of (a) CF, (b) CF/BN, (c) CF/Fe3O4(1), (d) CF/Fe3O4(2), (e) CF/Fe3O4(3), (f) CF/Fe3O4(1)/BN, (g) CF/Fe3O4(2)/BN, and (h) CF/Fe3O4(3)/BN. | |
3.3. EDS analyses
Fig. 4 shows the energy-dispersive spectrometer (EDS) elemental analysis and area scan of the fiber surface. As shown in Fig. 4(a) and (b), the PAN-based pre-oxidized fibers were carbonized. Fig. 4(c) shows the presence of B, N, C, Fe, and O on the surface of the CF/Fe3O4(3)/BN composite. The XRD analysis shows that these elements comprise Fe3O4 and BN, further confirming the possibility of the material formation. As shown in Fig. 4(d)–(h), B, N, C, Fe, and O were uniformly distributed onto the surface of the fiber. B and N constituted a high-temperature-resistant BN coating, which could increase the oxidation resistance temperature of the CF, reduce the surface resistance of CF, and reduce the reflection of EM by fibers. The surface of the fiber was evenly distributed with soft magnetic particles composed of elements, such as Fe and O. The magnetic particles of Fe3O4 have obvious absorbing properties and are commonly used for EM wave absorption.27 Additionally, various EM wave-absorbing materials form a multilayer structure onto the surface of a fiber and have a rich interfacial polarization, which is beneficial for improving the EM wave absorption of a material.
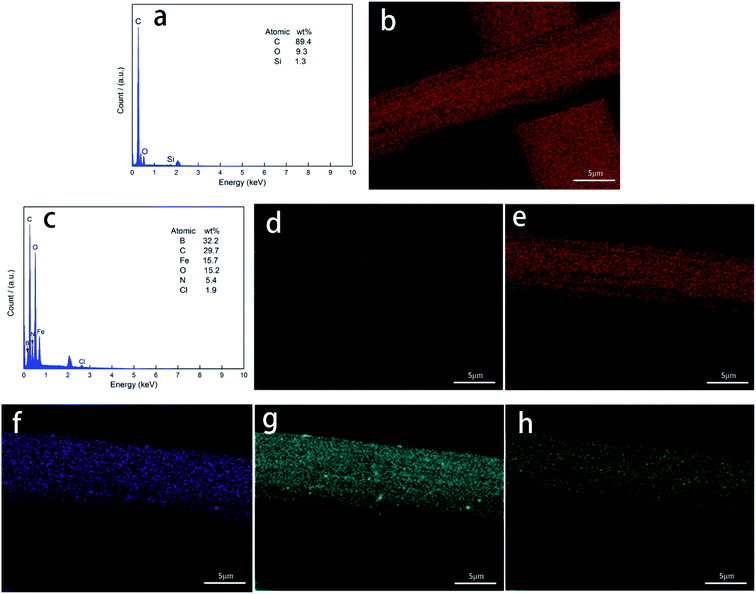 |
| | Fig. 4 EDS (a) and SEM topography maps (b) of CF for elements C; EDS (c) of CF/Fe3O4(3)/BN composites and SEM topography maps of CF/Fe3O4(3)/BN composites for elements (d) B, (e) C, (f) Fe, (g) O, and (h) N. | |
3.4. XPS analyses
To obtain further information on the composition and structure of the coatings, the coatings were examined by XPS. Fig. 5(a) shows the X-ray photoelectron spectra of CF, CF/Fe3O4(3), and CF/Fe3O4(3)/BN composites. The CF consisted of elemental C, N, and O. The CF/Fe3O4(3) consisted of C, N, O, and Fe, and the CF/Fe3O4(3)/BN composite consisted of elemental B, C, N, O, and Fe. The electronic states of the elements were further characterized by high-resolution XPS. Fig. 3(b) shows the X-ray photoelectron spectrum of Fe2p, in which two distinct peaks appeared at binding energies of 711.3 eV and 725.3 eV, corresponding to the spin–orbit peaks of Fe2p1/2 and Fe2p3/2, respectively. This result indicated the formation of an Fe3O4 phase in the CF/Fe3O4(3) and CF/Fe3O4(3)/BN composites.29,30 In addition, the Fe2p1/2 and Fe2p3/2 area intgP of CF/Fe3O4(3)/BN accounted for 30.179% and 69.821%, respectively. Comparison with 33.333% of Fe2p1/2 in Fe3O4 showed a difference because Fe2O3 was contained in the particles.31 Fig. 3(c) presents the B1s X-ray photoelectron spectra of CF, CF/Fe3O4(3), and CF/Fe3O4(3)/BN composites with peak-fitting curves. The broad full-width half-maximum suggests more than one type of bonding scheme for B. The X-ray photoelectron spectra were therefore resolved to investigate the possible chemical bond in the coatings. The deconvolution of the B1s spectrum of CF/Fe3O4(3)/BN provided three peaks centered at 191.8, 192.5, and 193.09 eV. B1s have peaks at 191.8 eV for h-BN, 188.4 eV for B4C, and 189.4 eV for BC3.4, while the B1s spectrum of B2O3 should be at 193.0 eV.19,32 However, the XPS peaks of the materials obtained by different preparation methods differed. Therefore, the resolved peaks at 191.8 eV could be assigned to the B–N bonding, whereas those at 192.5 eV could be assigned to the O–B–O bonding. The resolved peaks at 193.0 eV could be attributed to the B–O bonding. Treatment of urea and boric acid at 550 °C yielded BN, boron oxide, and boron oxynitride.26 Fig. 5(d) shows the N1s X-ray photoelectron spectra with peak-fitting curves, indicating that CF and CF/Fe3O4(3) had –N![[double bond, length as m-dash]](https://www.rsc.org/images/entities/char_e001.gif) and N–H, which is the typical structure of PAN-based carbon fibers.33,34 The N1s of CF/Fe3O4(3)/BN had B–N, N–H, C–N, and –ONO, probably because urea reacts with other substances to form nitric acid, resulting in the presence of –ONO.34,35 However, this concept requires further study.
and N–H, which is the typical structure of PAN-based carbon fibers.33,34 The N1s of CF/Fe3O4(3)/BN had B–N, N–H, C–N, and –ONO, probably because urea reacts with other substances to form nitric acid, resulting in the presence of –ONO.34,35 However, this concept requires further study.
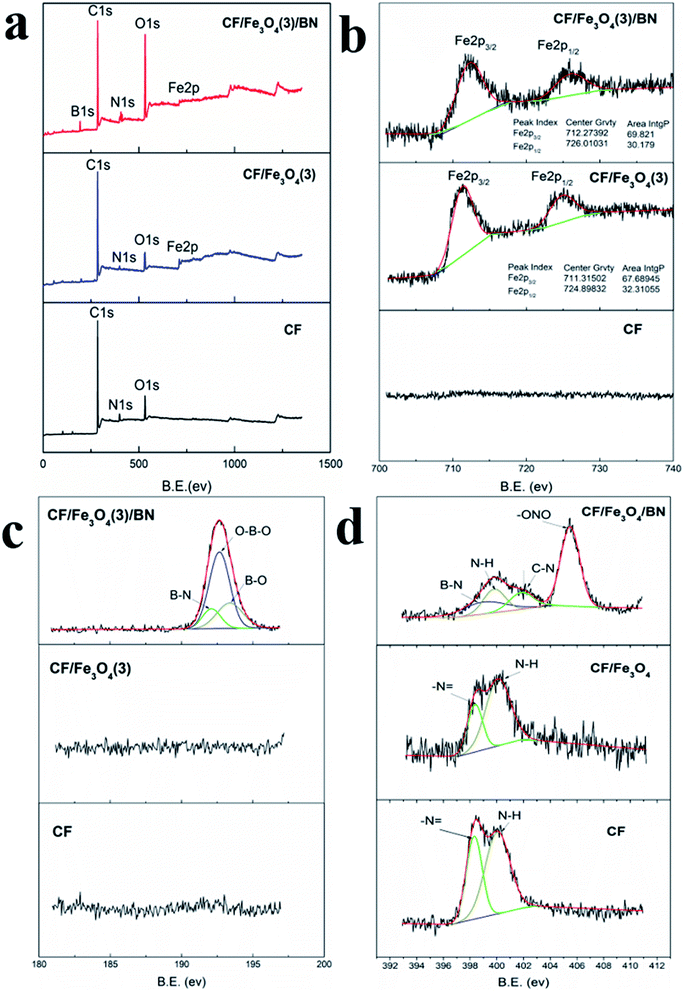 |
| | Fig. 5 XPS spectra: (a) wide scan, and (b) Fe2p, (c) B1s, and (d) N1s spectra of CF, CF/Fe3O4(3) and CF/Fe3O4(3)/BN composites. | |
3.5. Magnetic hysteresis analyses
The magnetic behaviors of CF, CF/BN, CF/Fe3O4(1)/BN, CF/Fe3O4(2)/BN and CF/Fe3O4(3)/BN composites were analyses by VSM analysis at room temperature. Fig. 6 shows that the hysteresis loop of the initial CF and CF/BN is almost a straight line, which indicates non-magnetic behavior, while the hysteresis loop of CF/Fe3O4(1)/BN, CF/Fe3O4(2)/BN and CF/Fe3O4(3)/BN is a typical S-type curve. The magnetic parameters of CF, CF/BN, CF/Fe3O4(1)/BN, CF/Fe3O4(2)/BN and CF/Fe3O4(3)/BN composites, including saturation magnetization (Ms), magnetic coercivity (Hc), and remanent magnetization (Mr) are listed in Table 1. As shown in Fig. 6 and Table 1, the saturation magnetization (Ms), remnant magnetization (Mr) and coercive force (HC) of the CF/Fe3O4/BN composites obtained at room temperature are different. The CF/Fe3O4(3)/BN has a higher Ms (8.03 emu g−1) and Mr (1.39 emu g−1), and a smaller Hc (204 Oe), indicating that it has superparamagnetic properties at room temperature. The difference in magnetic properties of these composites may be attributed to the introduction of magnetic Fe3O4.
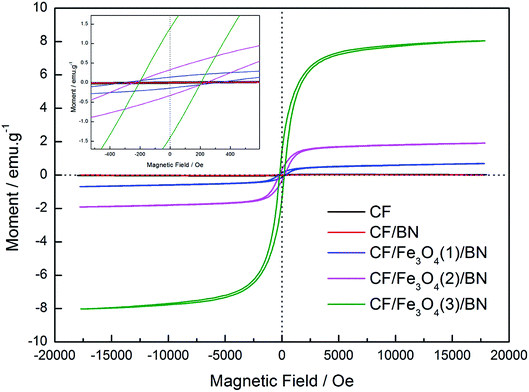 |
| | Fig. 6 Magnetic hysteresis loops of CF, CF/BN, CF/Fe3O4(1)/BN, CF/Fe3O4(2)/BN and CF/Fe3O4(3)/BN composites. | |
Table 1 Magnetic properties of CF, CF/BN, CF/Fe3O4(1)/BN, CF/Fe3O4(2)/BN and CF/Fe3O4(3)/BN composites at room temperature
| Samples |
Hc (Oe) |
Ms (emu g−1) |
Mr (emu g−1) |
| CF |
651 |
0.04 |
0.02 |
| CF/BN |
462 |
0.04 |
0.008 |
| CF/Fe3O4(1)/BN |
309 |
0.68 |
0.13 |
| CF/Fe3O4(2)/BN |
237 |
1.91 |
0.32 |
| CF/Fe3O4(3)/BN |
204 |
8.03 |
1.39 |
3.6. Thermal analyses
FeCl3 is protected by N2 and uses glucose as a reducing agent, which can be oxidized and reduced to Fe3O4 at a certain temperature. The chemical reactions are shown in eqn (1)–(5).36,37| |
 | (1) |
| |
 | (2) |
| |
 | (3) |
| |
 | (4) |
| |
 | (5) |
Fig. 7 shows the TG and DTG curves of the boric acid and urea mixture in the presence of N2. When the temperature is approximately 90 °C, the boric acid undergoes dehydration to form H2B4O7.38 When the temperature is approximately 180 °C, a fast loss of weight is documented that is attributed to the condensation and hydrolysis reactions of urea that release a large amount of NH3.39 When the temperature reaches ∼304.5 °C, the boric acid is completely dehydrated to form B2O3 and H2O. As the temperature is further increased, B2O3 and NH3 react to form BN. The reaction equations that describe the entire process are given below.
| |
 | (6) |
| |
 | (7) |
| |
 | (8) |
| |
 | (9) |
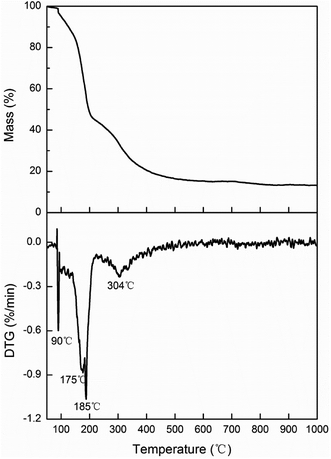 |
| | Fig. 7 Thermogravimetry (TG) and derivative thermogravimetric (DTG) curves of boric acid and urea. | |
Fig. 8 shows the TG and DTG curves of CF, CF/Fe3O4(3), and CF/Fe3O4(3)/BN. Pure CF began to oxidize and decompose in air at 450 °C and was completely oxidized at 700 °C. In addition, the decomposition temperature of CF decreased after it was covered with Fe3O4. This phenomenon is due to the fact that the presence of iron ions catalyzes the oxidation of CFs.40 After BN deposition, the decomposition temperature of the CF-based EM wave-absorbing material was remarkably improved. Fig. 8 also shows that CF/Fe3O4(3)/BN started to decompose at 550 °C and underwent complete thermal oxidation to 760 °C. The urea and boric acid decomposition was incomplete because of the 30 min treatment at 550 °C. After being heated, CF/Fe3O4(3)/BN continued to be thermally decomposed. When the temperature reached high levels, BN began to oxidize and eventually failed. However, the B2O3 film formed by BN oxidation could act as a barrier to prevent oxygen permeation, delaying the oxidation rate of the fiber.41 These findings show that after the modification of BN coating, the initial and final oxidation temperatures and the oxidation resistance of the material were improved.
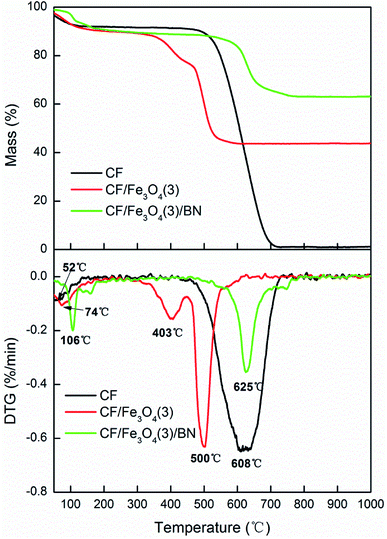 |
| | Fig. 8 TG and DTG curves of CF, CF/Fe3O4(3) and CF/Fe3O4(3)/BN. | |
3.7. EM parameters
Fig. 9(a)–(d) show the measured complex permittivity and permeability in the range of 2–18 GHz for the eight samples comprising 30 wt% CF, CF/BN, CF/Fe3O4(1), CF/Fe3O4(2), CF/Fe3O4(3), CF/Fe3O4(1)/BN, CF/Fe3O4(2)/BN, and CF/Fe3O4(3)/BN composites. As shown in Fig. 9(a) and (b), the values of ε′ and ε′′ of the samples were stable in the range of 2–14 GHz, with the corresponding values of approximately 3.5 and 0.4. This result shows that the material had no obvious relaxation and resonance behavior in the entire dielectric spectrum, and the dipole orientation polarization may be the main polarization mechanism in this frequency range.42 However, sharp peaks appeared in the range of 14–18 GHz, but the peaks were narrower, indicating that relaxation and resonance behavior may exist in this frequency range, but this phenomenon was not obvious. From the curve of ε′′, two broad dielectric resonance peaks around CF/Fe3O4(3)/BN were found near 14 and 17 GHz, and dielectric relaxation was evident.43 The peaks of the other materials were narrower or smaller. Compared with the ε′′ values of other carbon/magnetic composite materials, the value of ε′′ of the composite in this study was too small.16,37 Thus, the prepared material had higher resistance. This phenomenon may be due to the fact that BN had high resistance, and the resulting composite material had fewer defects. In general, a suitable resistance and dielectric loss are beneficial for improving the EM wave absorption of the material. As shown in Fig. 9(c) and (d), the curves of μ′ and μ′′ of the uncoated BN magnetic fiber composite materials showed little fluctuation, and their corresponding values were approximately 1 and 0, which is consistent with the description in the literature.44 Another report has similarly indicated that the magnetic loss of the carbon magnetic composite material is not a key factor for its EM absorption.45 Obvious magnetic resonance peaks appeared near 4 and 16 GHz, which correspond to the surface effect and spin wave excitation of the magnetic particles.46 Two possible contributions to microwave absorption, namely, dielectric and magnetic losses, are described. The dielectric tangent loss (tan![[thin space (1/6-em)]](https://www.rsc.org/images/entities/char_2009.gif) δE = ε′′/ε′) and magnetic tangent loss (tan
δE = ε′′/ε′) and magnetic tangent loss (tan![[thin space (1/6-em)]](https://www.rsc.org/images/entities/char_2009.gif) δM = μ′′/μ′) were calculated based on the permeability and permittivity of samples measured as described above. To determine which loss is dominant in the material, we calculated tan
δM = μ′′/μ′) were calculated based on the permeability and permittivity of samples measured as described above. To determine which loss is dominant in the material, we calculated tan![[thin space (1/6-em)]](https://www.rsc.org/images/entities/char_2009.gif) δE and tan
δE and tan![[thin space (1/6-em)]](https://www.rsc.org/images/entities/char_2009.gif) δM of each sample, and the results are shown in Fig. 9(e) and (f). The tan
δM of each sample, and the results are shown in Fig. 9(e) and (f). The tan![[thin space (1/6-em)]](https://www.rsc.org/images/entities/char_2009.gif) δE and tan
δE and tan![[thin space (1/6-em)]](https://www.rsc.org/images/entities/char_2009.gif) δM values were approximately in the ranges of 0.1–0.25 and 0–0.2, respectively. This result shows that the dielectric and magnetic losses of the carbon materials and carbon magnetic materials had limited effects on the EM wave absorption. A very high dielectric constant of a microwave-absorbing material will have an impact on the impedance matching, because it will produce strong reflections and weak absorption.47,48 At the same time, polarization and interfacial polarization are the two main reasons for the dielectric loss of composite materials in the microwave frequency range. The interface between a CF and magnetic particle coating will introduce more interfacial polarization.28 When the dielectric loss, magnetic loss, and material structure function together, the EM wave absorption of the material can be enhanced.49 However, in practical applications of EM wave-absorbing materials, impedance matching, EM loss synergy, and the three-dimensional structure of the material can greatly affect the EM wave absorption of the material.13,24,44
δM values were approximately in the ranges of 0.1–0.25 and 0–0.2, respectively. This result shows that the dielectric and magnetic losses of the carbon materials and carbon magnetic materials had limited effects on the EM wave absorption. A very high dielectric constant of a microwave-absorbing material will have an impact on the impedance matching, because it will produce strong reflections and weak absorption.47,48 At the same time, polarization and interfacial polarization are the two main reasons for the dielectric loss of composite materials in the microwave frequency range. The interface between a CF and magnetic particle coating will introduce more interfacial polarization.28 When the dielectric loss, magnetic loss, and material structure function together, the EM wave absorption of the material can be enhanced.49 However, in practical applications of EM wave-absorbing materials, impedance matching, EM loss synergy, and the three-dimensional structure of the material can greatly affect the EM wave absorption of the material.13,24,44
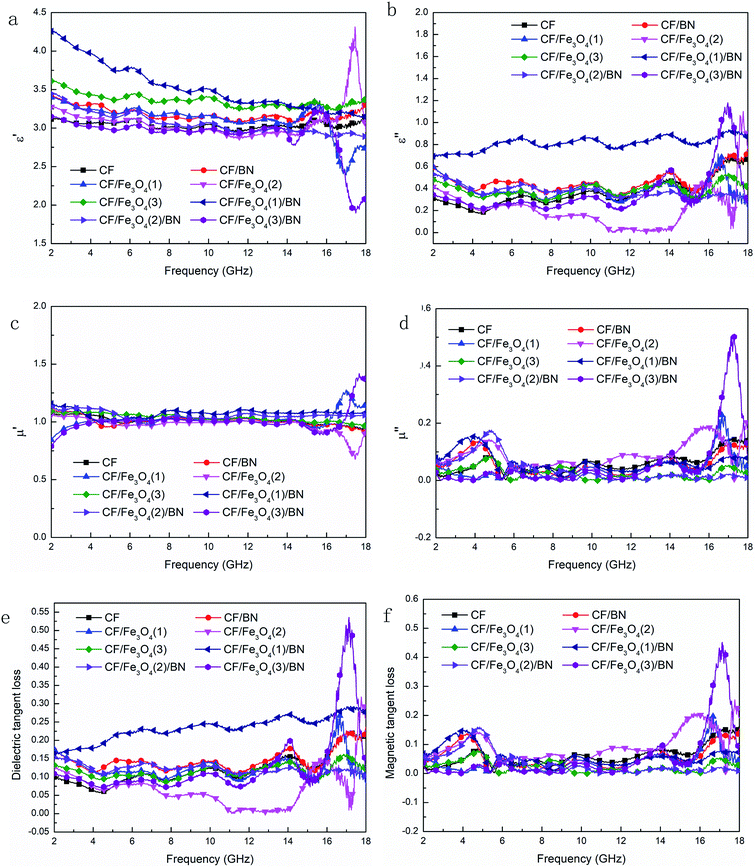 |
| | Fig. 9 Frequency dependence on real (a) and imaginary (b) parts of the complex permittivity of samples, real (c) and imaginary (d) parts of the complex permeability, and the corresponding dielectric (e) and magnetic loss tangents (f) of CF, CF/BN, CF/Fe3O4(1), CF/Fe3O4(2), CF/Fe3O4(3), CF/Fe3O4(1)/BN, CF/Fe3O4(2)/BN, and CF/Fe3O4(3)/BN composites. | |
Conventionally the relaxation process which can be described by the Cole–Cole semicircle has an important influence on permittivity behaviors of microwave absorption materials. According to the Debye dipolar relaxation,50 the relative complex permittivity can be expressed by the following equation:
| |
 | (10) |
where
f is the frequency,
τ is the relaxation time, and
εs and
ε∞ are the stationary dielectric constant and optical dielectric constant, respectively. From
eqn (1), it can be deduced that,
| |
 | (11) |
| |
 | (12) |
According to eqn (11) and (12), the relationship between ε′ and ε′′ can be deduced as follows:
| |
 | (13) |
Fig. 10 shows a plot of ε′′ values vs. ε′ values based on eqn (13). There are at least three semicircles in the curve for CF/Fe3O4(3)/BN, which are called Cole–Cole semicircles, with one semicircle corresponding to one polarization relaxation process, indicating the existence of multiple dielectric relaxations from 2 to 18 GHz. The multiple dielectric relaxations including interfacial polarization effects are caused by multi-interfaces between the Fe3O4, CF and BN. This generates polarization relaxation under the altering electromagnetic field and attenuates the electromagnetic wave, which results in a profound effect on the loss of microwave radiation. In our case, the new composites were achieved with CF, Fe3O4 particles and BN, allowing the materials to better respond to the requirements of impedance matching while endowing new dielectric relaxation characteristics.
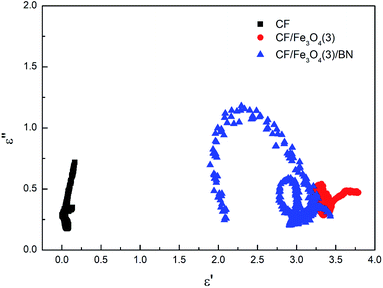 |
| | Fig. 10 Typical Cole–Cole curves of CF, CF/Fe3O4(3) and CF/Fe3O4(3)/BN. | |
3.8. EM wave-absorbing properties
Fig. 11 shows the EM wave absorption curve of the CF matrix composites. The loading of the magnetic particles onto the surface of CF could be inferred to affect the EM wave absorption of the material. In addition, the load and shape of the magnetic particles onto the surface of the carbon fiber affected the EM wave absorption of the material. When the FeCl3 concentration increases, the Fe3O4 load on the CF surface increases and the EM wave absorption of the carbon magnetic composite material is enhanced. The EM wave losses of CF, CF/Fe3O4(1), and CF/Fe3O4(2) are all >−5 dB, whereas that of CF/Fe3O4(3), which has more Fe3O4, is <−5 dB in the range of 11.4–18 GHz (bandwidth is 6.6 GHz). Fe3O4 is a typical EM wave absorbent. Increasing the Fe3O4 content can increase the EM wave absorption of the material.27 The morphology of the particles and compact coating on the fiber surface also affect the EM wave absorption. Fig. 3(e) shows that the particles on the surface of CF/Fe3O4(3) are in the form of flakes, and particle coating is more compact, which is beneficial to the loss of EM waves.28,51 However, the EM wave absorption exhibited only by loading Fe3O4 onto the surface of the carbonaceous fibers is still inadequate. When another layer of BN is coated onto the surface of the carbon magnetic materials, the EM wave absorption of the prepared materials is substantially enhanced. CF/BN, CF/Fe3O4(1)/BN, and CF/Fe3O4(2)/BN have improved EM wave absorption before the BN coating. In particular, the prepared CF/Fe3O4(3)/BN has an EM wave loss of <−5 dB in the range of 8.8–18 GHz at a frequency bandwidth of 9.2 GHz. An EM wave loss in the range of 11.2–15.4 GHz is <−10 dB (effective bandwidth is 4.2 GHz). This phenomenon is due to the fact that when BN is covered, contact occurs between fibers and BN, fibers and magnetic particles, and magnetic particles and BN, which creates a large number of interface effects and generates more interface polarization.27,28 BN is a high-resistance material, which can affect the formation of the conductive network of the material and reduce the reflection effect of the material on EM waves. When the dielectric loss, magnetic loss, and material structure function together, the EM wave absorption of the material can be enhanced.13,49
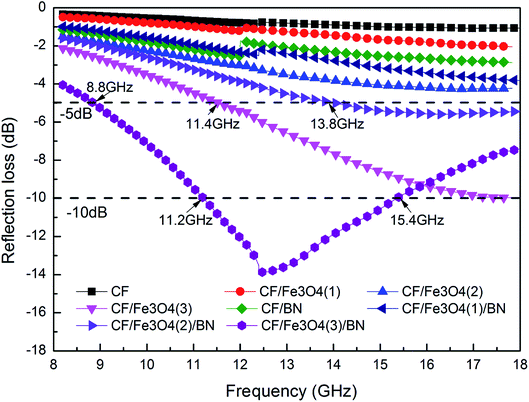 |
| | Fig. 11 EM wave absorption properties of CF, CF/BN, CF/Fe3O4(1), CF/Fe3O4(2), CF/Fe3O4(3), CF/Fe3O4(1)/BN, CF/Fe3O4(2)/BN, and CF/Fe3O4(3)/BN composites. | |
4 Conclusion
A PAN-based carbon fiber has been selected as a substrate, and its excellent properties of high-temperature resistance, oxidation resistance, high strength, light weight, and strong corrosion resistance have been fully utilized. The magnetic particles were supported onto the surface of the CF by in situ hybridization, and the outermost layer was coated with a high-temperature-resistant BN. A three-layered CF-based, high-temperature, EM wave-absorbing material with light weight and a broad absorption response has been prepared. This special structure mediated electrical loss, magnetic loss, and three-dimensional network synergy that enhanced the EM wave absorption of the material. The prepared CF/Fe3O4(3)/BN had an absorption bandwidth of 9.2 GHz with a reflection loss that exceeded −5 dB, and its effective bandwidth at <−10 dB was 4.2 GHz. At the same time, the presence of BN significantly improved the oxidation resistance of the CFs. The CF/Fe3O4(3)/BN sample began to decompose at 550 °C, which was considerably higher than the thermal decomposition temperature of CF/Fe3O4(3) and CFs. The CF/Fe3O4(3)/BN composite EM wave-absorbing materials can be a new type of absorbing composite material with excellent properties, such as broadband, high efficiency, stability, light weight, and high-temperature resistance.
Data availability
The data used to support the findings of this study are available from the corresponding author upon request.
Conflicts of interest
There are no conflicts to declare.
Acknowledgements
This study was supported by the National Key Research and Development Program of China (2016YFB0303100), A Project Funded by the Priority Academic Program Development of Jiangsu Higher Education Institutions (Su Caijiao44 No. 192), and the National Science Foundation for Young Scientists of China (Grant No. 51503105).
References
- W. Chen, S. Li, C. Chen and L. Yan, Adv. Mater., 2011, 23, 5679–5683 CrossRef CAS PubMed.
- C. Bao, L. Song, W. Xing, B. Yuan, C. A. Wilkie, J. Huang, Y. Guo and Y. Hu, J. Mater. Chem., 2012, 22, 6088–6096 RSC.
- X. Bai, Y. Zhai and Y. Zhang, J. Phys. Chem. C, 2011, 115, 11673–11677 CrossRef CAS.
- J. Guo, X. Wang, P. Miao, X. Liao, W. Zhang and B. Shi, J. Mater. Chem., 2012, 22, 11933–11942 RSC.
- J. Liu, J. Xu, R. Che, H. Chen, Z. Liu and F. Xia, J. Mater. Chem., 2012, 22, 9277–9284 RSC.
- Y.-J. Su, T.-H. Ko and J.-H. Lin, J. Appl. Polym. Sci., 2008, 108, 3610–3617 CrossRef CAS.
- S. Wu, F. Zhang, Y. Yu, P. Li, X. Yang, J. Lu and S. Ryu, Compos. Interfaces, 2008, 15, 671–677 CrossRef CAS.
- X. U. Hong-Xin and G. Luo, Liaoning Chem. Ind., 2001,(11), 473–497 Search PubMed.
- S. Otani and A. Oya, Acs Symposium, 1986, pp. 323–334 Search PubMed.
- W. Xie, H. Cheng, Z. Chu, Z. Chen and C. Long, Ceram. Int., 2011, 37, 1947–1951 CrossRef CAS.
- Q. Sun, L. Sun, Y. Cai, T. Ji and G. Zhang, RSC Adv., 2018, 8, 35337–35342 RSC.
- H. Sun, R. Che, X. You, Y. Jiang and H. Peng, Adv. Mater., 2014, 26, 8120–8125 CrossRef CAS PubMed.
- W. Ye, Q. Sun and G. Zhang, Ceram. Int., 2019, 45, 5093–5099 CrossRef CAS.
- L. Wang, Y. Huang, C. Li, J. Chena and X. Sun, Phys. Chem. Chem. Phys., 2015, 17, 5878–5886 RSC.
- C. Shi, J. Zhu, X. Shen, F. Chen, F. Ning, H. Zhang, Y.-Z. Long, X. Ning and J. Zhao, RSC Adv., 2018, 8, 4072–4077 RSC.
- Y. Wan, J. Xiao, C. Li, G. Xiong, R. Guo, L. Li, M. Han and H. Luo, J. Magn. Magn. Mater., 2016, 399, 252–259 CrossRef CAS.
- X. Huang, J. Zhang, W. Rao, T. Sang, B. Song and C. Wong, J. Alloys Compd., 2016, 662, 409–414 CrossRef CAS.
- M. Ning, J. Li, B. Kuang, C. Wang, D. Su, Y. Zhao, H. Jin and M. Cao, Appl. Surf. Sci., 2018, 447, 244–253 CrossRef CAS.
- Z. Wei, X. Peng, L. Yang, H. Luo and Z. Liang, J. Inorg. Mater., 2013, 28, 479–484 CrossRef.
- C. G. Cofer and J. Economy, Carbon, 1995, 33, 389–395 CrossRef CAS.
- G. Wen, G. L. Wu, T. Q. Lei, Y. Zhou and Z. X. Guo, J. Eur. Ceram. Soc., 2000, 20, 1923–1928 CrossRef CAS.
- W. Zhou, P. Xiao and Y. Li, Appl. Surf. Sci., 2012, 258, 8455–8459 CrossRef CAS.
- F. Ye, L. Zhang, X. Yin, Y. Liu and L. Cheng, Appl. Surf. Sci., 2013, 270, 611–616 CrossRef CAS.
- W. Ye, W. Li, Q. Sun, J. Yu and Q. Gao, RSC Adv., 2018, 8, 24780–24786 RSC.
- Z. Zhou, C. Lai, L. Zhang, Y. Qian, H. Hou, D. H. Reneker and H. Fong, Polymer, 2009, 50, 2999–3006 CrossRef CAS.
- Y.-s. Wei, X.-z. Huang, Z.-j. Du and Y. Cheng, Surf. Interface Anal., 2017, 49, 177–181 CrossRef CAS.
- X. Sun, J. He, G. Li, J. Tang, T. Wang, Y. Guo and H. Xue, J. Mater. Chem. C, 2013, 1, 765–777 RSC.
- L. Wang, F. He and Y. Wan, J. Alloys Compd., 2011, 509, 4726–4730 CrossRef CAS.
- X. Zhang, W. Zhu, W. Zhang, S. Zheng and S. Qi, J. Mater. Sci.: Mater. Electron., 2018, 29, 7194–7202 CrossRef CAS.
- C. K. Lo, D. Xiao and M. M. F. Choi, J. Mater. Chem., 2007, 17, 2418–2427 RSC.
- M. Ritter and W. Weiss, Surf. Sci., 1999, 432, 259–279 CrossRef.
- D. J. Joyner and D. M. Hercules, J. Chem. Phys., 1980, 72, 1095–1108 CrossRef CAS.
- W. H. Lee, J. G. Lee and P. J. Reucroft, Appl. Surf. Sci., 2001, 171, 136–142 CrossRef CAS.
- S. D. Gardner, C. S. K. Singamsetty, G. He and C. U. Pittman, Appl. Spectrosc., 1997, 51, 636–648 CrossRef CAS.
- D. Wang, S. Liu, G. H. Xu, X. U. Sun and Y. I. Zhao, Chin. J. Chem., 1985, 3, 332–336 Search PubMed.
- H. Wang, P. Hu, D. a. Pan, J. Tian, S. Zhang and A. A. Volinsky, J. Alloys Compd., 2010, 502, 338–340 CrossRef CAS.
- Q. Sun, L. Sun, Y. Cai, W. Ye, S. Xu, T. Ji and G. Yuan, Ceram. Int., 2019, 45, 18298–18305 CrossRef CAS.
- R. Pankajavalli, S. Anthonysamy, K. Ananthasivan and P. R. Vasudeva Rao, J. Nucl. Mater., 2007, 362, 128–131 CrossRef CAS.
- H. Onoda, A. Takenaka, K. Kojima and H. Nariai, Mater. Chem. Phys., 2003, 82, 194–198 CrossRef CAS.
- C. Sun, Y. Guo, X. Xu, Q. Du, H. Duan, Y. Chen, H. Li and H. Liu, Composites, Part A, 2017, 92, 33–41 CrossRef CAS.
- M. Das, A. K. Basu, S. Ghatak and A. G. Joshi, J. Eur. Ceram. Soc., 2009, 29, 2129–2134 CrossRef CAS.
- M. Zhang, Q. Liu, Z. Zi, Y. Dai, X. Zhu, Y. Sun and J. Dai, Sci. China: Technol. Sci., 2013, 56, 13–19 CAS.
- M. Liu, J. Xiang, Z.-P. Wu, J.-L. Li and X.-Q. Shen, Chin. J. Inorg. Chem., 2017, 33, 57–65 CAS.
- W. Ye, L. Sun, J. Yu and Q. L. Sun, J. Text. Res., 2019, 40, 97–102 Search PubMed.
- Z. Han, D. Li, H. Wang, X. G. Liu, J. Li, D. Y. Geng and Z. D. Zhang, Appl. Phys. Lett., 2009, 95, 23114 CrossRef.
- J. Xiang, J. Li, X. Zhang, Q. Ye, J. Xu and X. Shen, J. Mater. Chem. A, 2014, 2, 16905–16914 RSC.
- M.-M. Lu, W.-Q. Cao, H.-L. Shi, X.-Y. Fang, J. Yang, Z.-L. Hou, H.-B. Jin, W.-Z. Wang, J. Yuan and M.-S. Cao, J. Mater. Chem. A, 2014, 2, 10540–10547 RSC.
- M. S. Cao, R. R. Qin, C. J. Qiu and J. Zhu, Mater. Des., 2003, 24, 391–396 CrossRef.
- J. Li, S. Bi, B. Mei, F. Shi, W. Cheng, X. Su, G. Hou and J. Wang, J. Alloys Compd., 2017, 717, 205–213 CrossRef CAS.
- Y. Xiong and Y. Xia, Adv. Mater., 2007, 19, 3385–3391 CrossRef CAS.
- N. Li, G. W. Huang, Y. Li, H. M. Xiao and S. Y. Fu, ACS Appl. Mater. Interfaces, 2016, 9, 2973–2983 CrossRef PubMed.
|
| This journal is © The Royal Society of Chemistry 2020 |
Click here to see how this site uses Cookies. View our privacy policy here.  Open Access Article
 *ab,
Qilong Sun
 ab,
Xiaoyun Long*ab and
Yingying Caiab
![[thin space (1/6-em)]](https://www.rsc.org/images/entities/char_2009.gif) :
:![[thin space (1/6-em)]](https://www.rsc.org/images/entities/char_2009.gif) 7 and then pressed into a coaxial ring with an outer diameter of 7 mm and an inner diameter of 3.04 mm. The reflection coefficient (RC) of the composites was determined in the frequency ranges of 8.2–12.4 GHz and 12–18 GHz by the NRL arc method. A metal sheet (180 mm × 180 mm) and the composite with the same dimensions were successively placed on a sample platform, and two horn antennas were used to send and receive the EM wave normal to the sheet.
7 and then pressed into a coaxial ring with an outer diameter of 7 mm and an inner diameter of 3.04 mm. The reflection coefficient (RC) of the composites was determined in the frequency ranges of 8.2–12.4 GHz and 12–18 GHz by the NRL arc method. A metal sheet (180 mm × 180 mm) and the composite with the same dimensions were successively placed on a sample platform, and two horn antennas were used to send and receive the EM wave normal to the sheet.

![[double bond, length as m-dash]](https://www.rsc.org/images/entities/char_e001.gif) and N–H, which is the typical structure of PAN-based carbon fibers.33,34 The N1s of CF/Fe3O4(3)/BN had B–N, N–H, C–N, and –ONO, probably because urea reacts with other substances to form nitric acid, resulting in the presence of –ONO.34,35 However, this concept requires further study.
and N–H, which is the typical structure of PAN-based carbon fibers.33,34 The N1s of CF/Fe3O4(3)/BN had B–N, N–H, C–N, and –ONO, probably because urea reacts with other substances to form nitric acid, resulting in the presence of –ONO.34,35 However, this concept requires further study.


![[thin space (1/6-em)]](https://www.rsc.org/images/entities/char_2009.gif) δE = ε′′/ε′) and magnetic tangent loss (tan
δE = ε′′/ε′) and magnetic tangent loss (tan![[thin space (1/6-em)]](https://www.rsc.org/images/entities/char_2009.gif) δM = μ′′/μ′) were calculated based on the permeability and permittivity of samples measured as described above. To determine which loss is dominant in the material, we calculated tan
δM = μ′′/μ′) were calculated based on the permeability and permittivity of samples measured as described above. To determine which loss is dominant in the material, we calculated tan![[thin space (1/6-em)]](https://www.rsc.org/images/entities/char_2009.gif) δE and tan
δE and tan![[thin space (1/6-em)]](https://www.rsc.org/images/entities/char_2009.gif) δM of each sample, and the results are shown in Fig. 9(e) and (f). The tan
δM of each sample, and the results are shown in Fig. 9(e) and (f). The tan![[thin space (1/6-em)]](https://www.rsc.org/images/entities/char_2009.gif) δE and tan
δE and tan![[thin space (1/6-em)]](https://www.rsc.org/images/entities/char_2009.gif) δM values were approximately in the ranges of 0.1–0.25 and 0–0.2, respectively. This result shows that the dielectric and magnetic losses of the carbon materials and carbon magnetic materials had limited effects on the EM wave absorption. A very high dielectric constant of a microwave-absorbing material will have an impact on the impedance matching, because it will produce strong reflections and weak absorption.47,48 At the same time, polarization and interfacial polarization are the two main reasons for the dielectric loss of composite materials in the microwave frequency range. The interface between a CF and magnetic particle coating will introduce more interfacial polarization.28 When the dielectric loss, magnetic loss, and material structure function together, the EM wave absorption of the material can be enhanced.49 However, in practical applications of EM wave-absorbing materials, impedance matching, EM loss synergy, and the three-dimensional structure of the material can greatly affect the EM wave absorption of the material.13,24,44
δM values were approximately in the ranges of 0.1–0.25 and 0–0.2, respectively. This result shows that the dielectric and magnetic losses of the carbon materials and carbon magnetic materials had limited effects on the EM wave absorption. A very high dielectric constant of a microwave-absorbing material will have an impact on the impedance matching, because it will produce strong reflections and weak absorption.47,48 At the same time, polarization and interfacial polarization are the two main reasons for the dielectric loss of composite materials in the microwave frequency range. The interface between a CF and magnetic particle coating will introduce more interfacial polarization.28 When the dielectric loss, magnetic loss, and material structure function together, the EM wave absorption of the material can be enhanced.49 However, in practical applications of EM wave-absorbing materials, impedance matching, EM loss synergy, and the three-dimensional structure of the material can greatly affect the EM wave absorption of the material.13,24,44


