 Open Access Article
Significant enhancement of dielectric permittivity and percolation behaviour of La2−xSrxNiO4/poly(vinylidene fluoride) composites with different Sr doping concentrations
Keerati Meeporna,
Narong Chanlekb and
Prasit Thongbai *cd
*cd
aMaterials Science and Nanotechnology Program, Faculty of Science, Khon Kaen University, Khon Kaen 40002, Thailand
bSynchrotron Light Research Institute (Public Organization), 111 University Avenue, Muang District, Nakhon Ratchasima 30000, Thailand
cDepartment of Physics, Faculty of Science, Khon Kaen University, Khon Kaen 40002, Thailand. E-mail: pthongbai@kku.ac.th
dInstitute of Nanomaterials Research and Innovation for Energy (IN-RIE), NANOTEC–KKU RNN on Nanomaterials Research and Innovation for Energy, Khon Kaen University, Khon Kaen, 40002, Thailand
First published on 15th January 2020
Abstract
The percolation behaviour and dielectric properties of La2−xSrxNiO4 (LSNO)/poly(vinylidene fluoride) (PVDF) composites with different Sr doping concentrations were investigated. The semiconducting LSNO filler particles with x = 0.2 (LSNO-1) and x = 0.4 (LSNO-2) were prepared using a chemical combustion method. The microstructures, thermal properties, and phase compositions of the polymer composites and filler particles were systematically investigated. The conductivity of the LSNO fillers increased with the Sr content and had an important impact on the dielectric properties of the LSNO/PVDF composites. The percolation threshold of the LSNO-2/PVDF composite was lower than that of the LSNO-1/PVDF composite. An ultra-high dielectric permittivity (ε′) of 3384.7 (at 1 kHz and room temperature), which was approximately 340 times higher than that of pure PVDF, was obtained for the LSNO-2/PVDF composite with a filler volume fraction of 25 vol%. The enhanced dielectric properties were attributed to interfacial polarisation at the semiconductor–insulator interface, a micro-capacitor model, and the intrinsically remarkable dielectric properties of the LSNO ceramic.
1. Introduction
Polymer-based composite materials with high dielectric permittivity (ε′) values have attracted increasing research focus in recent years because they have several advantages over dielectric ceramics and potential applications in various fields, including microelectronics, pulsed power, bandpass filtering, power conditioning, sensing, and energy storage.1–7 The dielectric permittivity of a polymer-based composite material can be dramatically enhanced by introducing conductive metal fillers (Ni, Al, and Ag) and carbon-based fillers (multiwalled carbon nanotubes, graphene, and carbon black) into the polymer matrix. A dramatically increased dielectric permittivity was obtained when the volume fraction of filler used was increased to a critical fraction, i.e., a percolation threshold (fc), according to the percolation theory.8–12 However, a conductor–polymer composite with a greatly enhanced dielectric permittivity near fc still cannot be considered an effective material in practical applications, especially in capacitor applications, because of its high conductivity (σ) and high dielectric loss (tan![[thin space (1/6-em)]](https://www.rsc.org/images/entities/char_2009.gif) δ). Therefore, it is necessary to develop a new composite system. Semiconductor–polymer composite systems have been studied as promising candidates because of their lower conductivities and high dielectric permittivities when the filler content is close to the percolation threshold.
δ). Therefore, it is necessary to develop a new composite system. Semiconductor–polymer composite systems have been studied as promising candidates because of their lower conductivities and high dielectric permittivities when the filler content is close to the percolation threshold.
Recently, several semiconducting materials have been used with several kinds of polymer matrices.13–19 Among these, La2−xSrxNiO4 (LSNO) ceramic oxides have attracted considerable attention as alternative semiconducting fillers for polymer composite dielectric materials because of their semiconductive properties and remarkably high dielectric permittivities of 105 to 106. They can also exhibit a very high dielectric permittivity of approximately 104 even in the gigahertz region. The extremely good dielectric properties of LSNO ceramics are attributed to an intrinsic effect, caused by polaron hopping between Ni2+ and Ni3+.20–24 A filler material with an extremely high dielectric permittivity as a result of an intrinsic property is more suitable for compositing than one with such a dielectric permittivity resulting from an extrinsic effect at grain boundaries. Therefore, LSNO ceramics are promising effective fillers for polymer-based composite systems. Furthermore, it has been reported that their conductivities depend on the Sr content.25 Therefore, it is necessary to understand the dielectric properties and percolation thresholds of composites filled with LSNO ceramic fillers.
In this work, two semiconductor–polymer composite systems were fabricated, using La2−xSrxNiO4 (LSNO) ceramics with x = 0.2 (LSNO-1) and x = 0.4 (LSNO-2) as fillers. Poly(vinylidene fluoride) (PVDF) polymer was selected as the polymer matrix. The dependencies of the dielectric properties and percolation threshold on the conductivities of the LSNO fillers for the two composite systems are discussed in detail. The dielectrics and percolation mechanisms of the LSNO/PVDF composites are explained by the effective medium percolation theory model (EMPT). PVDF was chosen as the matrix because of its superior mechanical, thermal, and dielectric properties.
2. Experimental details
The precursors used for synthesising the LSNO fillers included Sr(NO3)2 (99.0% purity), La(NO3)3·6H2O (99.99% purity), and CH4N2O (99.0–100.5% purity), which were purchased from Sigma-Aldrich. Ni(NO3)2·6H2O (99.0% purity) and C6H8O7·H2O (99.5% purity) were purchased from Kanto Chemical and RCI Labscan, respectively. The chemicals employed for the PVDF-based composite fabrication consisted of dimethylformamide (DMF) and PVDF (Mw of ∼534![[thin space (1/6-em)]](https://www.rsc.org/images/entities/char_2009.gif) 000), which were purchased from RCI Labscan and Sigma-Aldrich, respectively.
000), which were purchased from RCI Labscan and Sigma-Aldrich, respectively.
Synthesis of La2−xSrxNiO4 (LSNO) ceramic fillers
LSNO fillers with x = 0.2 (LSNO-1) and x = 0.4 (LSNO-2) were synthesised using a chemical combustion method to prepare nanocrystalline LSNO.23,24 First, a C6H8O7·H2O solution was produced by dissolving C6H8O7·H2O in deionised water. Second, stoichiometric amounts of Ni(NO3)2·6H2O, Sr(NO3)2, and La(NO3)3·6H2O were dissolved in the C6H8O7·H2O solution, after which CH4N2O was added and stirred constantly at room temperature (RT). After this, the temperature of the mixed solution was increased from RT to 200 °C until a green treacly gel was obtained. In the next step, this green gel was dehydrated at 300 °C for 30 min and then calcined at 1000 °C for 6 h to obtain the LSNO phase without impurities.Fabrication of LSNO-1/PVDF and LSNO-2/PVDF composites
Two PVDF-based composite systems using LSNO-1 and LSNO-2 as fillers were fabricated via a solution processing method similar to a previously reported technique.26 First, the PVDF powder was dissolved in DMF solvent at RT until the solution was transparent. Second, the LSNO-1 and LSNO-2 fillers were separately added to the PVDF solution at 5–25 vol% and continuously stirred for 4 h. To enhance the dispersion of the ceramic filler, each mixture was further ultrasonicated for 10 min. Finally, each composite solution was poured into a casting plate and dried in an oven at 70 °C for 6 h. Afterward, LSNO-1/PVDF and LSNO-2/PVDF composite films with thicknesses of 50–195 μm were obtained. The LSNO-1/PVDF and LSNO-2/PVDF composites with filler volume fractions of 5, 10, 15, 20, and 25 vol% were called 5 vol% LSNO-1, 10 vol% LSNO-1, 15 vol% LSNO-1, 20 vol% LSNO-1, and 25 vol% LSNO-1, respectively, and 5 vol% LSNO-2, 10 vol% LSNO-2, 15 vol% LSNO-2, 20 vol% LSNO-2, and 25 vol% LSNO-2, respectively.Material characterisations
The morphologies and phase compositions of the LSNO fillers and PVDF-based composites were characterised using scanning electron microscopy (SEM; SEC, SNE4500M), transmission electron microscopy (TEM; FEI, TECNAI G2 20), and powder X-ray diffraction (XRD; PANalytical, EMPYREAN). The chemical-state information of the Ni in the LSNO fillers and thermal properties of the PVDF-based composites were evaluated using X-ray photoelectron spectroscopy (XPS; PHI5000 VersaProbe II, ULVAC-PHI) and thermogravimetric analysis (TGA; Pyris Diamond, PerkinElmer), respectively. An analysis using a KEYSIGHT E4990A impedance analyser was performed to investigate the dielectric properties of the PVDF-based composites. Prior to the dielectric measurement, silver electrodes were formed on both sides of each composite sample using silver paste.3. Results and discussion
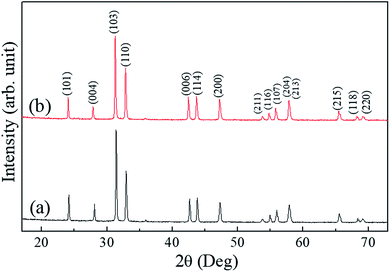
The microstructures of the LSNO-1 and LSNO-2 fillers prepared via a chemical combustion method and calcined at 1000 °C for 6 h are shown in Fig. 1(a) and (b), respectively. The SEM and TEM images (insets) reveal that the LSNO-1 and LSNO-2 powders consisted of nearly spherical particles with average radii of approximately 140–160 nm. It was found that as a result of the surface free energy, the assemblage between neighbouring particles was significantly decreased through the close packing of spherical particles.27 The XRD patterns of the LSNO-1 and LSNO-2 fillers are given in Fig. 2. The peaks at 2θ in both samples interrelated to 24° (101), 27° (004), 31° (103), 32° (110), 42° (006), 43° (114), 47° (200), 54° (211), 55° (116), 56° (107), 57° (204), 58° (213), 65° (215), 68° (118), and 69° (220) can be assigned to LSNO with a tetragonal structure according to JCPDS no. 32-1241. The XRD patterns of the LSNO-1 and LSNO-2 ceramic particles are similar to those reported in the literature.24,33 No visible diffraction peaks of impurity phases are observed, indicating that a chemical combustion method is an effective route for the preparation of La2−xSrxNiO4 (LSNO) ceramic powders.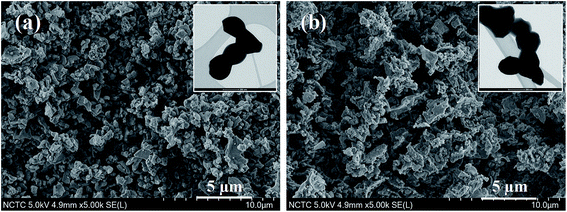 | ||
| Fig. 1 SEM images of (a) LSNO-1 and (b) LSNO-2 fillers obtained using combustion method. The insets show TEM images of the LSNO-1 and LSNO-2 fillers. | ||
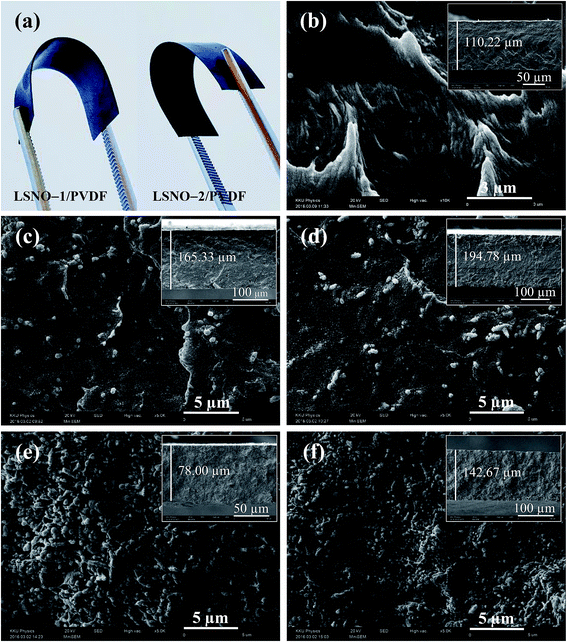
Fig. 3 shows macroscopic images of the flexibility of the 25 vol% LSNO-1 and 25 vol% LSNO-2 composite samples and SEM images of the fractured surfaces of the pure PVDF film and composites with the LSNO-1 and LSNO-2 fillers. As clearly seen in Fig. 3(b), the pure PVDF film prepared via solution casting is orderly, and a tight surface without any pores or impurities is observed. Fig. 3(c)–(f) show the fractured surfaces of the prepared 10 vol% LSNO-1, 10 vol% LSNO-2, 25 vol% LSNO-1, and 25 vol% LSNO-2 samples, respectively. The bright particles observed are the LSNO fillers, which are randomly dispersed across the PVDF matrix, as can be seen in Fig. 3(c) and (d). When the LSNO filler content increased to 25 vol%, as shown in Fig. 3(e) and (f), the fractured surfaces of the composites became rough, but the LSNO fillers were still well-dispersed. Interestingly, the composites with the 25 vol% filler concentrations still exhibited good mechanical flexibility, as seen in Fig. 3(a), which can be considered a beneficial effect of maintaining a well-dispersed LSNO filler distribution and using an effective preparation method. The overall dispersion states of the LSNO-1 and LSNO-2 fillers in a large area were also characterised using an optical microscope. Fig. 4(a) and (b) show the results of dispersion analyses of the 25 vol% LSNO-1 and 25 vol% LSNO-2 composites, respectively. Although it is observed that the LSNO fillers remained well-dispersed in the composites, small clusters of the LSNO fillers are also observed, as seen in the larger black spots. This may have resulted from the numerous particles and high surface free energy of the nanoparticles. It is important to note that the homogeneous dispersion of fillers can improve the dielectric properties of the composites.
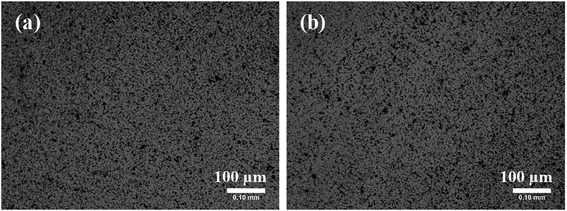 | ||
| Fig. 4 Optical microscopy images showing dispersion states of LSNO-1 and LSNO-2 fillers in PVDF matrix: (a) 25 vol% LSNO-1 and (b) 25 vol% LSNO-2 composites. | ||
The thermal stabilities of the LSNO-1/PVDF and LSNO-2/PVDF composites with various filler volume fractions are shown in Fig. 5(a) and (b), respectively. The TGA results for the LSNO/PVDF composites show the same trend, with the single state decomposition of the PVDF observed. The addition of the LSNO fillers caused an increase in the thermal stability of the PVDF. The temperature at a 25% weight loss (T25) increased from 450 °C for the pure PVDF film to 471, 480, 481, 482, and 484 °C for the 5 vol% LSNO-1, 10 vol% LSNO-1, 15 vol% LSNO-1, 20 vol% LSNO-1, and 25 vol% LSNO-1 composites and increases to 473, 480, 483, 484, and 484 C° for 5 vol% LSNO-2, 10 vol% LSNO-2, 15 vol% LSNO-2, 20 vol% LSNO-2, and 25 vol% LSNO-2 composites, respectively. These results indicate that the LSNO-1 and LSNO-2 fillers can slightly improve the thermal stability of the PVDF matrix.
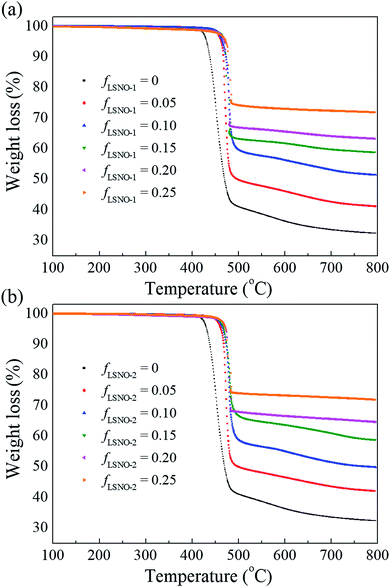 | ||
| Fig. 5 TGA curves of (a) LSNO-1/PVDF and (b) LSNO-2/PVDF composites with filler content of f = 0–0.25. | ||
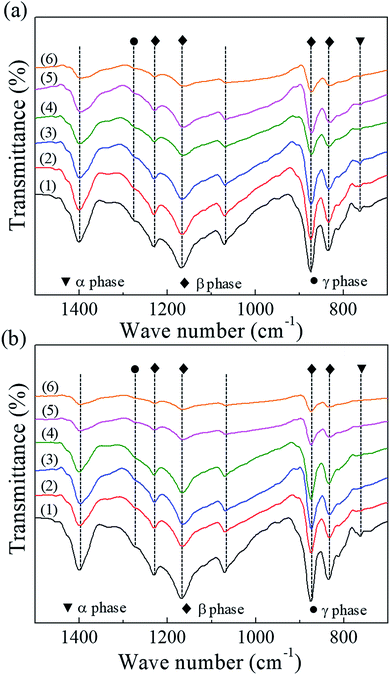
Fig. 6(a) and (b) reveal the FT-IR spectra for the LSNO-1/PVDF and LSNO-2/PVDF composites with filler contents of 0 (pure PVDF) to 25 vol%, respectively. It was found that the LSNO/PVDF composites consisted of α-phase and β-phase PVDF. The absorbance band at 766 cm−1 was assigned to the nonpolar α-phase,28 and polar β-phase was observed at 840, 878, 1170, and 1231 cm−1. The absorbance bands at 1070 and 1402 were related to the bending of C–C–C and the in-plane bending or scissoring of CH2, respectively.27 The absorbance bands at 766 and 840 cm−1 corresponding to the α-phase and β-phase, respectively, were utilised to calculate the content of the β-phase using eqn (1),28
 | (1) |
In order to describe the relationships between the conductivities of the LSNO fillers with x = 0.2 (LSNO-1) and x = 0.4 (LSNO-2) and the percolation threshold, the conductivities of the LSNO fillers were estimated using the XPS analysis results to reveal the co-occurrence of Ni2+ and Ni3+ in the LSNO powder samples. The substitution of La3+ by Sr2+ and increase in the Sr content caused a decrease in the Ni–O1 bond length. This decrease was simultaneous with the cumulative oxidation of Ni2+ to Ni3+ and resulted in the enhancement of the electrical conductivity of the LSNO ceramic.25 Fig. 7(a) and (b) show the XPS profiles of the LSNO-1 and LSNO-2 fillers, respectively. It was found that the Ni3+/Ni2+ ratio for LSNO-2 was greater than that for LSNO-1. Therefore, the conductivity of LSNO-2 was higher than that of the LSNO-1 ceramic because of the increase in the charge carriers in the conduction band upon hole injection, which was simultaneous with the Sr chemical doping. Besides a high permittivity of the fillers, the conductivity of the LSNO-1 and LSNO-2 fillers also has a significant influence on the dielectric properties of the composites. A higher conductivity should result in a higher dielectric response in the composites.
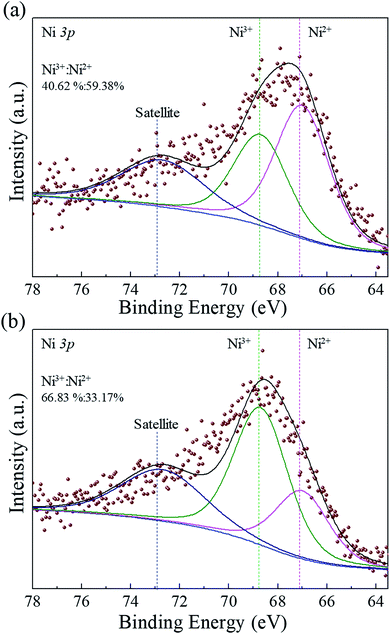 | ||
| Fig. 7 XPS profiles of (a) LSNO-1 and (b) LSNO-2 fillers prepared via a chemical combustion method and calcined at 1000 °C for 6 h. | ||
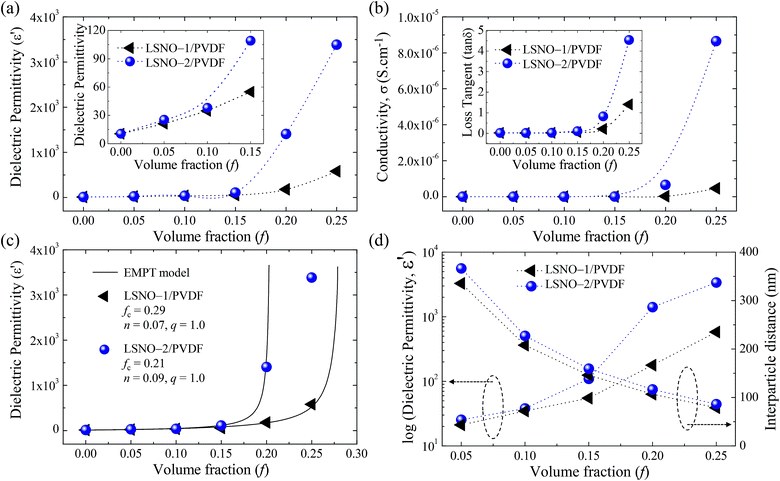
The dielectric permittivity (ε′), loss tangent (tan![[thin space (1/6-em)]](https://www.rsc.org/images/entities/char_2009.gif) δ), and conductivity (σ) values at 1 kHz for the LSNO-1/PVDF and LSNO-2/PVDF composites as functions of the filler volume fraction are shown in Fig. 8(a) and (b), respectively. The ε′ values for the 5 vol% LSNO-1, 10 vol% LSNO-1, 15 vol% LSNO-1, 20 vol% LSNO-1, and 25 vol% LSNO-1 composites were 21.2, 34.8, 54.9, 178.0, and 579.6, while the ε′ values for the 5 vol% LSNO-2, 10 vol% LSNO-2, 15 vol% LSNO-2, 20 vol% LSNO-2, and 25 vol% LSNO-2 composites were 25.4, 38.0, 109.1, 1407.2, and 3384.7, respectively. Fig. 8(a) clearly shows that the LSNO-2/PVDF composite had an abrupt change in ε′ when the LSNO-2 concentration became ≥20 vol%. Furthermore, the tan
δ), and conductivity (σ) values at 1 kHz for the LSNO-1/PVDF and LSNO-2/PVDF composites as functions of the filler volume fraction are shown in Fig. 8(a) and (b), respectively. The ε′ values for the 5 vol% LSNO-1, 10 vol% LSNO-1, 15 vol% LSNO-1, 20 vol% LSNO-1, and 25 vol% LSNO-1 composites were 21.2, 34.8, 54.9, 178.0, and 579.6, while the ε′ values for the 5 vol% LSNO-2, 10 vol% LSNO-2, 15 vol% LSNO-2, 20 vol% LSNO-2, and 25 vol% LSNO-2 composites were 25.4, 38.0, 109.1, 1407.2, and 3384.7, respectively. Fig. 8(a) clearly shows that the LSNO-2/PVDF composite had an abrupt change in ε′ when the LSNO-2 concentration became ≥20 vol%. Furthermore, the tan![[thin space (1/6-em)]](https://www.rsc.org/images/entities/char_2009.gif) δ and σ values followed a similar trend with an increase in the volume fraction of LSNO-2, as illustrated in Fig. 8(b). In contrast, both the dielectric properties and conductivity of the LSNO-1/PVDF composite slowly increased over the whole filler loading range studied (0–25 vol%). This could indicate the formation of a percolation network in the LSNO-1/PVDF composite at an LSNO-1 concentration of ≥25 vol%. Therefore, the percolation threshold (fc) of the LSNO-2/PVDF composite was lower than that of the LSNO-1/PVDF composite. The two kinds of LSNO/PVDF composites exhibited improved and superior ε′ values compared to the pure PVDF (ε′ = 10), and the ε′ values increased with the addition of the LSNO fillers. These enhanced ε′ values were related to interfacial polarisation or the Maxwell–Wagner–Sillars effect,1,5,17 which is produced by the accumulation of charge carriers at semiconductor–insulator interfaces under an applied electric field. As shown by the previously mentioned XPS results, the higher conductivity of LSNO-2 compared to the LSNO-1 filler resulted in the LSNO-2/PVDF composite possessing higher ε′ values for all of the filler concentrations compared to the LSNO-1/PVDF composite. This can be described as strong interfacial polarisation caused by the numerous charge carriers in the LSNO-2 filler.
δ and σ values followed a similar trend with an increase in the volume fraction of LSNO-2, as illustrated in Fig. 8(b). In contrast, both the dielectric properties and conductivity of the LSNO-1/PVDF composite slowly increased over the whole filler loading range studied (0–25 vol%). This could indicate the formation of a percolation network in the LSNO-1/PVDF composite at an LSNO-1 concentration of ≥25 vol%. Therefore, the percolation threshold (fc) of the LSNO-2/PVDF composite was lower than that of the LSNO-1/PVDF composite. The two kinds of LSNO/PVDF composites exhibited improved and superior ε′ values compared to the pure PVDF (ε′ = 10), and the ε′ values increased with the addition of the LSNO fillers. These enhanced ε′ values were related to interfacial polarisation or the Maxwell–Wagner–Sillars effect,1,5,17 which is produced by the accumulation of charge carriers at semiconductor–insulator interfaces under an applied electric field. As shown by the previously mentioned XPS results, the higher conductivity of LSNO-2 compared to the LSNO-1 filler resulted in the LSNO-2/PVDF composite possessing higher ε′ values for all of the filler concentrations compared to the LSNO-1/PVDF composite. This can be described as strong interfacial polarisation caused by the numerous charge carriers in the LSNO-2 filler.
To understand the effects of the filler content and interface on the dielectric properties of the LSNO/PVDF composites, different filler volume fractions were chosen based on the interparticle distances. The interparticle distances (d) in the LSNO-1/PVDF and LSNO-2/PVDF composites can be calculated using the following derived equation:30
 | (2) |
To clarify the dielectric response and dependence of the percolation threshold on the filler conductivity for the LSNO-1/PVDF and LSNO-2/PVDF composites, comparisons were made between the theoretical approximations and experimental data at 1 kHz and RT. Fig. 8(c) shows the calculation results when using the EMPT model,31–33
 | (3) |
A comparison shows that at a filler concentration of less than 30 vol%, various other ceramic/PVDF composite systems such as BaTiO3/PVDF, Ba(Fe1/2Nb1/2)O3/PVDF, CaCu3Ti4O12/PVDF, and (Li + Ti) co-doped NiO/PVDF had ε′ values that were lower than 50 (at RT and 102 Hz).14,18,35–38 Moreover, the ε′ values of these composites were still lower than 100 even when the filler concentration was increased to 50 vol%. These results may be attributed to (i) the ε′ values of the ceramics used in the composites not being high enough (103 to 104),39,40 and (ii) the ε′ values of these ceramics generally being due to the grain boundary response.41 As previously mentioned, the superior dielectric properties (ε′ ≈ 155 to 106), which could primarily be attributed to intrinsically small polaronic hopping inside the LSNO particles, could have resulted in the higher ε′ values of the LSNO/PVDF composites compared to those of other ceramic/PVDF composites. The ε′ and tan![[thin space (1/6-em)]](https://www.rsc.org/images/entities/char_2009.gif) δ values of the LSNO-1/PVDF and LSNO-2/PVDF composites as a function of the filler content were measured over a frequency range of 102 to 106 Hz at RT, and the results are shown in Fig. 9(a–d). The ε′ values of both the LSNO-1/PVDF and LSNO-2/PVDF composites increased with the filler content, as seen in Fig. 9(a) and (b), respectively. The ε′ values of the LSNO/composites with the filler contents of 0 (pure PVDF) to 15 vol% were independent of the frequency in the range of 102 to 105 Hz, in contrast to the frequency dependence behaviour of the ε′ values for LSNO ceramics in this frequency range.23 This can be interpreted to mean that the dielectric response of the LSNO/PVDF composites with filler contents below 20 vol% is primarily caused by the intrinsic ε′ values of the LSNO fillers and PVDF matrix. In contrast, at filler contents greater than 15 vol%, a slight decrease in the ε′ value with increasing frequency was observed. Moreover, when the loading of the LSNO filler was increased from 15 to 20 vol%, the ε′ values increase from 54.9 to 178.0 for the LSNO-1/PVDF composite and drastically increased from 109.1 to 1407.2 for the LSNO-2/PVDF composite. This clearly indicated that the effect of interfacial polarisation on the enhanced ε′ values was dominant, especially for the LSNO-2/PVDF composite, as a result of their percolative nature. Such a drastic increase in the ε′ value for the LSNO-2/PVDF composite could also be rationalised by the micro-capacitor model,33,42 which considers the consistency of a network of several micro-capacitors formed by a thin layer of PVDF polymer between two neighbouring LSNO-2 particles, where each of these micro-capacitors contributes to an abnormally high capacitance. Fig. 9(c) and (d) show the frequency dependences of the tan
δ values of the LSNO-1/PVDF and LSNO-2/PVDF composites as a function of the filler content were measured over a frequency range of 102 to 106 Hz at RT, and the results are shown in Fig. 9(a–d). The ε′ values of both the LSNO-1/PVDF and LSNO-2/PVDF composites increased with the filler content, as seen in Fig. 9(a) and (b), respectively. The ε′ values of the LSNO/composites with the filler contents of 0 (pure PVDF) to 15 vol% were independent of the frequency in the range of 102 to 105 Hz, in contrast to the frequency dependence behaviour of the ε′ values for LSNO ceramics in this frequency range.23 This can be interpreted to mean that the dielectric response of the LSNO/PVDF composites with filler contents below 20 vol% is primarily caused by the intrinsic ε′ values of the LSNO fillers and PVDF matrix. In contrast, at filler contents greater than 15 vol%, a slight decrease in the ε′ value with increasing frequency was observed. Moreover, when the loading of the LSNO filler was increased from 15 to 20 vol%, the ε′ values increase from 54.9 to 178.0 for the LSNO-1/PVDF composite and drastically increased from 109.1 to 1407.2 for the LSNO-2/PVDF composite. This clearly indicated that the effect of interfacial polarisation on the enhanced ε′ values was dominant, especially for the LSNO-2/PVDF composite, as a result of their percolative nature. Such a drastic increase in the ε′ value for the LSNO-2/PVDF composite could also be rationalised by the micro-capacitor model,33,42 which considers the consistency of a network of several micro-capacitors formed by a thin layer of PVDF polymer between two neighbouring LSNO-2 particles, where each of these micro-capacitors contributes to an abnormally high capacitance. Fig. 9(c) and (d) show the frequency dependences of the tan![[thin space (1/6-em)]](https://www.rsc.org/images/entities/char_2009.gif) δ values of the LSNO-1/PVDF and LSNO-2/PVDF composites, respectively. All of the prepared composites with a filler content below 20 vol% showed similar frequency-dependent behaviours of tan
δ values of the LSNO-1/PVDF and LSNO-2/PVDF composites, respectively. All of the prepared composites with a filler content below 20 vol% showed similar frequency-dependent behaviours of tan![[thin space (1/6-em)]](https://www.rsc.org/images/entities/char_2009.gif) δ. The apparent tan
δ. The apparent tan![[thin space (1/6-em)]](https://www.rsc.org/images/entities/char_2009.gif) δ peak in the frequency range of 104 to 105 Hz corresponding to the step-like decrease in ε′ for the LSNO-2/PVDF composites with filler contents of 20–25 vol% was characteristic of the occurrence of a dielectric relaxation process. The high ε′ and tan
δ peak in the frequency range of 104 to 105 Hz corresponding to the step-like decrease in ε′ for the LSNO-2/PVDF composites with filler contents of 20–25 vol% was characteristic of the occurrence of a dielectric relaxation process. The high ε′ and tan![[thin space (1/6-em)]](https://www.rsc.org/images/entities/char_2009.gif) δ values in the low-frequency range and their decrease with increasing frequency confirmed the existence of interfacial polarisation.
δ values in the low-frequency range and their decrease with increasing frequency confirmed the existence of interfacial polarisation.
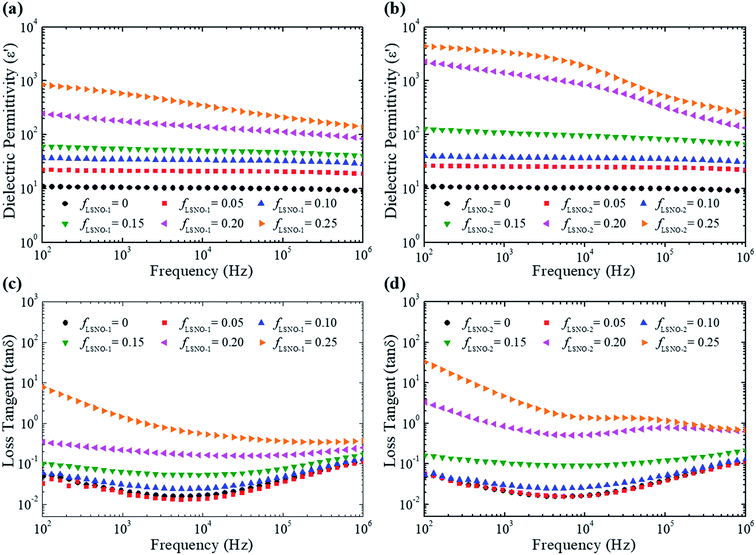 | ||
Fig. 9 Frequency dependence of (a and b) dielectric permittivity (ε′) and (c and d) loss tangent (tan![[thin space (1/6-em)]](https://www.rsc.org/images/entities/char_2009.gif) δ) for LSNO-1/PVDF and LSNO-2/PVDF composites, respectively. δ) for LSNO-1/PVDF and LSNO-2/PVDF composites, respectively. | ||
The temperature dependences of the dielectric properties of the LSNO-1/PVDF and LSNO-2/PVDF composites at 1 kHz as a function of the filler content were measured over a temperature range of −60 °C to +100 °C, and the results are shown in Fig. 10. The ε′ values of the LSNO/PVDF composites increased with the temperature, as seen in Fig. 10(a) and (b). A step increase in the ε′ value and the appearance of a tan![[thin space (1/6-em)]](https://www.rsc.org/images/entities/char_2009.gif) δ peak (Fig. 10(c) and (d)) in the low-temperature region correspond to the rotational motions of dipolar groups of the PVDF matrix, which result in the β relaxation. The enhanced tan
δ peak (Fig. 10(c) and (d)) in the low-temperature region correspond to the rotational motions of dipolar groups of the PVDF matrix, which result in the β relaxation. The enhanced tan![[thin space (1/6-em)]](https://www.rsc.org/images/entities/char_2009.gif) δ values at the high-temperature region for the composites with the filler contents of 5–15 vol% indicate that the dominant polarisation at high temperature is the interfacial polarisation. The temperature dependence behaviour of the tan
δ values at the high-temperature region for the composites with the filler contents of 5–15 vol% indicate that the dominant polarisation at high temperature is the interfacial polarisation. The temperature dependence behaviour of the tan![[thin space (1/6-em)]](https://www.rsc.org/images/entities/char_2009.gif) δ values for the composites with the filler contents of 20–25 vol% reflects the change in the PVDF matrix due to the addition of the LSNO fillers. The crystallisation of the PVDF into the β-phase was expected to decrease with an increase in the LSNO filler, and this was supported by the FT-IR results.
δ values for the composites with the filler contents of 20–25 vol% reflects the change in the PVDF matrix due to the addition of the LSNO fillers. The crystallisation of the PVDF into the β-phase was expected to decrease with an increase in the LSNO filler, and this was supported by the FT-IR results.
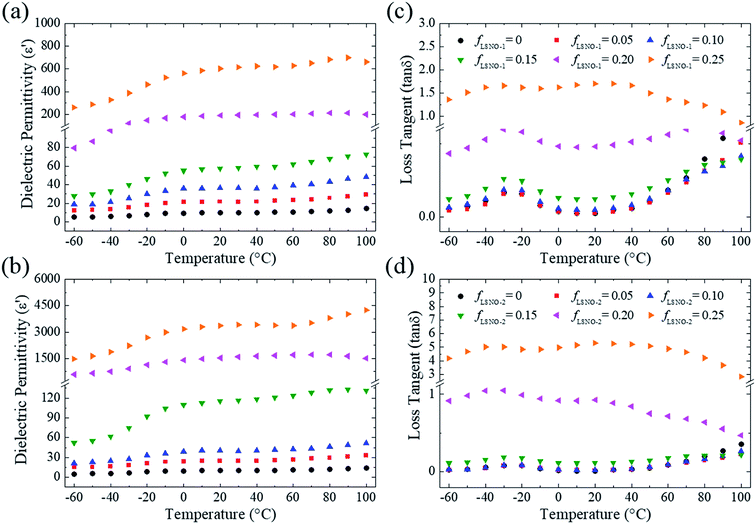 | ||
Fig. 10 Temperature dependences of (a and b) dielectric permittivity (ε′) and (c and d) loss tangent (tan![[thin space (1/6-em)]](https://www.rsc.org/images/entities/char_2009.gif) δ) at 1 kHz for LSNO-1/PVDF and LSNO-2/PVDF composites, respectively. δ) at 1 kHz for LSNO-1/PVDF and LSNO-2/PVDF composites, respectively. | ||
4. Conclusion
Promising semiconductor–polymer composites were successfully fabricated using a solution processing method. LSNO-1 and LSNO-2 particles were used as fillers to study the effects of the conductivity of the semiconducting LSNO filler on the dielectric properties and percolation threshold of PVDF-based composites. The results demonstrated that the conductivity of the LSNO filler had a significant impact on the physical properties of the LSNO/PVDF composites. The percolation thresholds of the LSNO/PVDF composites decreases as the conductivity of the LSNO increased. The LSNO-1/PVDF and LSNO-2/PVDF composites showed percolation thresholds of 0.29 and 0.21, respectively. Drastic changes in the dielectric properties and conductivity were observed only in the LSNO-2/PVDF composite, while both the dielectric properties and conductivity of the LSNO-1/PVDF composite increased slowly over the whole filler loading range studied (0–25 vol%). At a filler content of 20 vol%, the ε′ and tan![[thin space (1/6-em)]](https://www.rsc.org/images/entities/char_2009.gif) δ values of the LSNO-1/PVDF composite were 178.0 and 0.22, while those of the LSNO-2/PVDF composite were 1407.2 and 0.83, respectively. Nevertheless, the LSNO/PVDF composites with the filler content of 25 vol% exhibited excellent flexibility. Hence, the LSNO ceramic proved to be an important semiconductive filler, and these semiconductor–polymer composites are potential candidates for dielectric charge storage capacitors and electromagnetic wave absorption applications.
δ values of the LSNO-1/PVDF composite were 178.0 and 0.22, while those of the LSNO-2/PVDF composite were 1407.2 and 0.83, respectively. Nevertheless, the LSNO/PVDF composites with the filler content of 25 vol% exhibited excellent flexibility. Hence, the LSNO ceramic proved to be an important semiconductive filler, and these semiconductor–polymer composites are potential candidates for dielectric charge storage capacitors and electromagnetic wave absorption applications.
Conflicts of interest
There are no conflicts to declare.Acknowledgements
This work was financially supported by the Synchrotron Light Research Institute [Grant No. BRG6180003], Khon Kaen University [Grant No. BRG6180003], and the Thailand Research Fund (TRF) [Grant No. BRG6180003]. This work was partially supported by the Research Network NANOTEC (RNN) program of the National Nanotechnology Center (NANOTEC), NSTDA, Ministry of Science and Technology and Khon Kaen University, Thailand. K. M. would like to thank the Thailand Research Fund under the Royal Golden Jubilee PhD Program [Grant No. PHD/0191/2556] for his PhD scholarship.References
- K. Zou, Y. Dan, Y. Yu, Y. Zhang, Q. Zhang, Y. Lu, H. Huang, X. Zhang and Y. He, J. Mater. Chem. A, 2019, 7, 13473–13482 RSC
.
- X. Zhang, Y. Shen, B. Xu, Q. Zhang, L. Gu, J. Jiang, J. Ma, Y. Lin and C. W. Nan, Adv. Mater., 2016, 28, 2055–2061 CrossRef CAS PubMed
.
- Prateek, D. Singh, N. Singh, A. Garg and R. K. Gupta, Compos. Sci. Technol., 2019, 174, 158–168 CrossRef CAS
.
- F. Liu, Q. Li, J. Cui, Z. Li, G. Yang, Y. Liu, L. Dong, C. Xiong, H. Wang and Q. Wang, Adv. Funct. Mater., 2017, 27, 1606292 CrossRef
.
- M. Yang, C. Hu, H. Zhao, P. Haghi-Ashtiani, D. He, Y. Yang, J. Yuan and J. Bai, Carbon, 2018, 132, 152–156 CrossRef CAS
.
- Prateek, V. K. Thakur and R. K. Gupta, Chem. Rev., 2016, 116, 4260–4317 CrossRef CAS PubMed
.
- X. Chen, X. Han and Q.-D. Shen, Adv. Electron. Mater., 2017, 3, 1600460 CrossRef
.
- S. Tu, Q. Jiang, X. Zhang and H. N. Alshareef, ACS Nano, 2018, 12, 3369–3377 CrossRef CAS PubMed
.
- S. Maiti, S. Suin, N. K. Shrivastava and B. B. Khatua, J. Appl. Polym. Sci., 2013, 130, 543–553 CrossRef CAS
.
- L. Zhang, W. Wang, X. Wang, P. Bass and Z. Y. Cheng, Appl. Phys. Lett., 2013, 103, 232903 CrossRef
.
- Z. Chen, H. Li, G. Xie and K. Yang, RSC Adv., 2018, 8, 1–9 RSC
.
- L. Zhang, Z. Liu, X. Lu, G. Yang, X. Zhang and Z. Y. Cheng, Nano Energy, 2016, 26, 550–557 CrossRef CAS
.
- Z.-M. Dang, C.-W. Nan, D. Xie, Y.-H. Zhang and S. C. Tjong, Appl. Phys. Lett., 2004, 85, 97 CrossRef CAS
.
- Z.-M. Dang, H.-P. Xu, D. Xie and L. Li, Mater. Lett., 2007, 61, 511–515 CrossRef CAS
.
- W. Wu, X. Huang, S. Li, P. Jiang and T. Toshikatsu, J. Phys. Chem. C, 2012, 116, 24887–24895 CrossRef CAS
.
- C. Dagdeviren and M. Papila, Polym. Compos., 2009, 31, 1003–1010 CrossRef
.
- Y. Zhang, Y. Wang, Y. Deng, M. Li and J. Bai, ACS Appl. Mater. Interfaces, 2012, 4, 65–68 CrossRef CAS PubMed
.
- H. Tang, Z. Zhou, C. C. Bowland and H. A. Sodano, Nano Energy, 2015, 17, 302–307 CrossRef CAS
.
- Z. Zhang, Y. Gu, J. Bi, S. Wang, M. Li and Z. Zhang, Mater. Lett., 2015, 160, 16–19 CrossRef CAS
.
- S. Krohns, P. Lunkenheimer, C. Kant, A. V. Pronin, H. B. Brom, A. A. Nugroho, M. Diantoro and A. Loidl, Appl. Phys. Lett., 2009, 94, 122903 CrossRef
.
- S. Krohns, P. Lunkenheimer, S. Meissner, A. Reller, B. Gleich, A. Rathgeber, T. Gaugler, H. U. Buhl, D. C. Sinclair and A. Loidl, Nat. Mater., 2011, 10, 899–901 CrossRef CAS PubMed
.
- X. Q. Liu, S. Y. Wu and X. M. Chen, J. Alloys Compd., 2010, 507, 230–235 CrossRef CAS
.
- K. Meeporn, N. Chanlek and P. Thongbai, RSC Adv., 2016, 6, 91377–91385 RSC
.
- K. Meeporn, T. Yamwong and P. Thongbai, Jpn. J. Appl. Phys., 2014, 53, 06JF01 CrossRef
.
- A. Aguadero, M. J. Escudero, M. Perez, J. A. Alonso, V. Pomjakushin and L. Daza, Dalton Trans., 2006, 4377–4383, 10.1039/b606316k
.
- K. Meeporn, S. Maensiri and P. Thongbai, Appl. Surf. Sci., 2016, 380, 67–72 CrossRef CAS
.
- B. Luo, X. Wang, Y. Wang and L. Li, J. Mater. Chem. A, 2014, 2, 510–519 RSC
.
- P. Martins, A. C. Lopes and S. Lanceros-Mendez, Prog. Polym. Sci., 2014, 39, 683–706 CrossRef CAS
.
- C. Ribeiro, C. M. Costa, D. M. Correia, J. Nunes-Pereira, J. Oliveira, P. Martins, R. Gonçalves, V. F. Cardoso and S. Lanceros-Méndez, Nat. Protoc., 2018, 13, 681 CrossRef CAS PubMed
.
- K. S. Deepa, S. Kumari Nisha, P. Parameswaran, M. T. Sebastian and J. James, Appl. Phys. Lett., 2009, 94, 142902 CrossRef
.
- F. Fang, W. Yang, S. Yu, S. Luo and R. Sun, Appl. Phys. Lett., 2014, 104, 132909 CrossRef
.
- X. Chen, F. Liang, W. Lu, Z. Jin, Y. Zhao and M. Fu, Polymers, 2018, 10, 1–10 CAS
.
- K. Meeporn, P. Thongbai, T. Yamwong and S. Maensiri, RSC Adv., 2017, 7, 17128–17136 RSC
.
- C. W. Nan, Y. Shen and J. Ma, Annu. Rev. Mater. Res., 2010, 40, 131–151 CrossRef CAS
.
- W. Wan, J. Luo, C.-e. Huang, J. Yang, Y. Feng, W.-X. Yuan, Y. Ouyang, D. Chen and T. Qiu, Ceram. Int., 2018, 44, 5086–5092 CrossRef CAS
.
- S. Luo, S. Yu, R. Sun and C. P. Wong, ACS Appl. Mater. Interfaces, 2014, 6, 176–182 CrossRef CAS PubMed
.
- Z. Wang, M. Fang, H. Li, Y. Wen, C. Wang and Y. Pu, Compos. Sci. Technol., 2015, 117, 410–416 CrossRef CAS
.
- T. Zhou, J. W. Zha, R. Y. Cui, B. H. Fan, J. K. Yuan and Z. M. Dang, ACS Appl. Mater. Interfaces, 2011, 3, 2184–2188 CrossRef CAS PubMed
.
- P. Thomas, K. T. Varughese, K. Dwarakanath and K. B. R. Varma, Compos. Sci. Technol., 2010, 70, 539–545 CrossRef CAS
.
- A. R. West, T. B. Adams, F. D. Morrison and D. C. Sinclair, J. Eur. Ceram. Soc., 2004, 24, 1439–1448 CrossRef CAS
.
- X. Sun, J. Deng, S. Liu, T. Yan, B. Peng, W. Jia, Z. Mei, H. Su, L. Fang and L. Liu, Appl. Phys. A: Mater. Sci. Process., 2016, 122, 864 CrossRef
.
- P. W. Jaschin, R. Bhimireddi and K. B. R. Varma, ACS Appl. Mater. Interfaces, 2018, 10, 27278–27286 CrossRef CAS PubMed
.
| This journal is © The Royal Society of Chemistry 2020 |

