 Open Access Article
Roles of gel polymer electrolytes for high-power activated carbon supercapacitors: ion reservoir and binder-like effects†
Habin Park,
Jaewon Chung,
Hansol Yong,
Jongwon Jung and
Cheolsoo Jung *
*
Department of Chemical Engineering, University of Seoul, 163 Shiripdae-ro, Dongdaemun-gu, Seoul, 02504, Republic of Korea. E-mail: csjung@uos.ac.kr
First published on 29th January 2020
Abstract
Ion reservoir and binder-like effects of gel polymer electrolytes (GPEs) are suggested for working mechanisms to enhance rate capability and cycling stability of activated carbon (AC) supercapacitors (SCs) even at 3.4 V. Analysis on kinetics from cyclic voltammetry, electrochemical reactions through in situ Fourier-transform infrared spectroscopy, and differential information of galvanostatic curves reveals that the increased rate-capability is derived dominantly by an improved non-faradaic process by the ion reservoir effect of GPEs in the AC. Although the designed GPEs induce slightly higher bulk and diffusion resistance at the incipient stage, the GPEs play a binder-like function to suppress detachment of AC particles and aggravation of impedance parameters during cycling at 3.4 V.
Introduction
Supercapacitors (SCs), including electric double-layer capacitors (EDLCs) and pseudocapacitors (PsCs), have been assessed as promising energy storage devices owing to their high power density and long life span.1–4 Considerable efforts have been made for improvement of capacitance with novel active materials,5 widened cell voltage,6 and ameliorated rate capability with the modification of active materials.7 In addition, a myriad of materials have been used for SC electrodes, such as transition metal oxides,8 conducting polymers,9 and various types of carbon.10,11 Among them, activated carbons (ACs) have been used traditionally to fabricate electrodes because of their high specific surface area of microporous structure and easy availability.12 However, their microporous structure results in unfavorable rate capability, which is a crucial factor determining the power density of SCs.13 Therefore, improving the rate capability by bolstering the electrolytic behaviors in a porous structure is important in developing superior SCs. In addition, although widening the cell voltage is also significant for higher power density,2 SCs can be hardly operated with only typical organic liquid electrolytes (LEs) and AC electrodes due to their electrolytic decomposition or degradation of the active materials.14–16Ionic liquids (ILs), which have been highlighted as alternatives for LEs, have broaden electrochemical window (EW),17 however, their high-cost limits commercialization for SCs.18 With gel polymer electrolytes (GPEs), which have been reported to be next generation electrolyte for energy storages, showing moderate ionic conductivity,19 this study suggests a simple and effective method to fabricate superb SCs which can be operated at 3.4 V, showing improved rate capability and cycling stability than the LE. Archetypal methacrylates, methyl methacrylate (MMA) and ethylene glycol dimethacrylate (EGDMA), which are comparably low-cost, were used to form the GPEs. Cyclic voltammetry, in situ Fourier-transform infrared spectroscopy, and the galvanostatic charge–discharge performance demonstrated the GPE SCs' enhanced reversible faradaic and non-faradaic charge–discharge processes. These results could not be elucidated only with diffusion of the electrolytes in the AC pores, which were measured by the electrochemical impedance spectra. The GPE SCs were much durable at 3.4 V during galvanostatic cycling and showed the ameliorated recovery of the capacitance, compared to LE SC.
Experimental
Material preparation and cell fabrication
Spiro-(1,10)-bipyrrolidinium tetrafluoroborate (SBPBF4) and acetonitrile (ACN, 99.9%) were purchased from Enchem, Korea and Daejung, Korea, respectively, and used after dehydration using molecular sieves. Ethylene glycol dimethacrylate (EGDMA, 98%) and methyl methacrylate (MMA, 99%) were purchased from Sigma Aldrich and used without further purification. Benzoyl peroxide (BPO, 75%) was purchased from Lancaster synthesis, United Kingdom, and used after recrystallization with methanol and chloroform and purification. The activated carbon electrodes were obtained from Korchip, Korea.LE was prepared as 1.0 M SBPBF4 in ACN. GPEs were prepared by free-radical polymerization with BPO. The GPEs, EGD05, and MMA05, were comprised of 5 wt% each monomer, EGDMA and MMA, 2 wt% BPO compared to the monomer, and LE as the remainder, then cured for 18 h at 60 °C. The GPE SCs were prepared with the pre-gel in pouch SCs, then cured using the same method. Evidences of the polymerization of the GPEs are shown and described in Fig. S1.† The SCs were fabricated with 2.5 cm × 2.5 cm AC electrodes as the positive and negative electrodes and cellulose sheet as a separator. A 0.5 g of the electrolytes was injected into the fabricated pouch SCs.
Characterization and electrochemical measurements
Cyclic voltammetry (CV) of the electrolytes was measured using WBCS 3000 (Wonatech, Korea) with AC electrodes as the working, counter, and reference electrodes from 5 to 40 mV s−1. In situ Fourier-transform infrared (FTIR) spectra of the electrolytes were measured using the attenuated total reflection (ATR) technique with Spectrum 100 (PerkinElmer, USA) holding the specific potentials on the same electrodes using an Emstat3 (PalmSens, Netherlands). The SCs were also charged to 3.4 V and discharged to 0 V galvanostatically using the WBCS 3000, and the capacitances were measured at 20 °C at various current rates from 0.1 to 3.2 A g−1. The cycling stability of the SCs was measured at 3.2 A g−1 for 5000 cycles. The potential and capacitance distributions of the positive and negative electrodes were measured and calculated on the same electrodes. Imbalance efficiency is a dimensionless number and was calculated based on an imbalance of the positive and negative capacitances using an equation, |C+ − C−|/Ctotal, where C+ is positive capacitance, C− is negative capacitance, and Ctotal is total capacitance, which is utilized to determine a mechanism for increase in total capacitance; from obviously high, biased value of one side or emaciated imbalance between both sides. Open circuit voltage (OCV) variances were measured after discharging at 0.1 A g−1 for 2 h. Electrochemical impedance spectroscopy (EIS) was conducted to measure the various impedance components at 3.4 V using IM6ex (Zahner, German) from 200 kHz to 30 mHz and at an amplitude of 10 mV. The Nyquist plots were fitted to an equivalent circuit model using Zman (Wonatech, Korea) software. The morphological investigation of the AC electrodes was conducted using Mini-SEM (SEC Co., Korea).Results and discussion
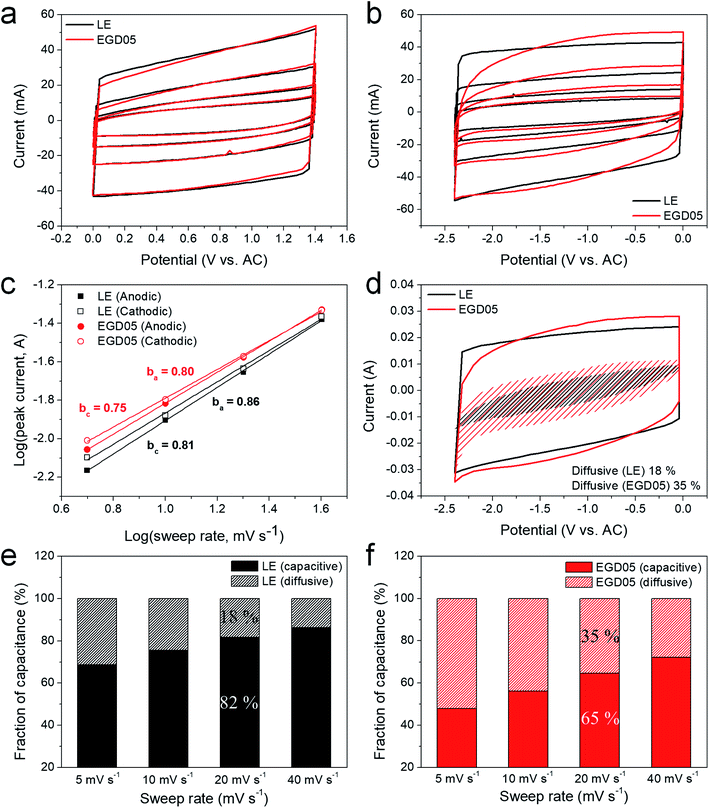
Fig. 1a and b display CVs of LE and EGD05 on the positive and negative AC electrodes at various rates. Because LE and EGD05 have the same electrode surface, smaller incipient currents of EGD05 on positive and negative electrodes were induced by its lower ionic conductivity than LE (Fig. S2†).20 Each CV curve on the positive electrode showed similar patterns, even at a high rate (Fig. 1a), but a much distorted current shape of EGD05 on the negative electrode was observed, unlike the shape of LE (Fig. 1b). First, compared with LE, slow increase in current of EGD05 was observed. It was derived by large diffusion resistance of EGD05, which is also correlated with equivalent series resistance (ESR) and time constants, causing delayed electrolytic transport to the electrode surface (Table S1 and Fig. S9†). Second, to examine whether the slightly increased and broad current was a response to a faradaic process, the currents of reduction at approximately −1.5 V and the oxidation at approximately −0.9 V were gathered and their kinetic information was analyzed from the relationship: log(i) vs. log(v) (Fig. 1c). The redox current (i) of capacitors obeys the relationship, i = avb, with sweep rate (v), where b = 0.5 describes a diffusion controlled process and b = 1 indicates a capacitive process.21–23 EGD05 showed a smaller cathodic slope of 0.75 and an anodic slope of 0.80, which indicates that EGD05 is controlled by a diffusion process somewhat, despite the greater part of capacitive process (Fig. 1c). Unlike the pseudocapacitive behavior reported by other groups,21–23 the GPE, in this study, could diffuse into the AC pores to conduct the charge–discharge process, so that the diffusive process with parameters close to 0.5 would occur. In addition, through the transformed power–law relationship, considering both charge storage processes, i = k1v + k2v1/2,23 larger diffusive portion of EGD05 on the negative electrode than of LE was observed (Fig. 1d, e, and f). The diffusive portion of both electrolytes decreased with increasing rate,21,22 but the portion of EGD05 was still higher than of LE and the decreasing rate was also suppressed by approximately 10% at 40 mV s−1. Therefore, the increased total current of EGD05, compared to LE, might be derived by slight faradaic portion. However, because the increasing rate of capacitive portion of EGD05 was approximately two times higher than of LE and largely grown capacitive portion at high rate was observed, non-faradaic process should be improved for much high current at high rate. MMA05, having a similar structure as EGD05 except for the functionality of cross-linking, also showed an enhanced diffusive process somewhat at a similar potential range with comparable kinetic information (Fig. S3†).To determine the mechanism for the slight enhancement of the faradaic process, in situ ATR FTIR spectra were measured at specific potentials for 30 min. Fig. 2a presents a plausible redox mechanism of PEGDMA. Electrochemical reduction would occur to form a radical structure with a resonance to be stabilized,24 then the structure would be oxidized to form the original structure. This reversible reaction was investigated on an ATR crystal under the AC electrode holding −2.0 and +0.1 V to reduce and oxidize further based on the kinetics (Fig. 1c). There was a space between the crystal and electrode so that a constant potential was conducted to detect the byproduct that diffused sufficiently to the crystal (Fig. 2b). If the byproduct had a resonance structure after reduction, the spectra should shift slightly or widen toward a lower wavenumber. As shown in Fig. 2c, the C![[double bond, length as m-dash]](https://www.rsc.org/images/entities/char_e001.gif) O stretching peak widened toward a lower wavenumber and a new broad peak was generated at 1678 cm−1 after 30 min at −2.0 V. This broad and small peak disappeared after 30 min at +0.1 V. LE displayed no changes in the range due to the absence of the structure (Fig. 2d). Therefore, this novel peak would be contributed from the formation of a reversible byproduct and the peak appeared at a lower wavenumber due to the resonance structure (Fig. 2a). However, the widened C
O stretching peak widened toward a lower wavenumber and a new broad peak was generated at 1678 cm−1 after 30 min at −2.0 V. This broad and small peak disappeared after 30 min at +0.1 V. LE displayed no changes in the range due to the absence of the structure (Fig. 2d). Therefore, this novel peak would be contributed from the formation of a reversible byproduct and the peak appeared at a lower wavenumber due to the resonance structure (Fig. 2a). However, the widened C![[double bond, length as m-dash]](https://www.rsc.org/images/entities/char_e001.gif) O stretching peak was still present after oxidation. As shown in Fig. S4,† EGD05 showed a severe increase in current after −2.0 V, which means another unfavorable reduction occurred. As shown in Fig. S5,† the reduced resonance structure could progress further irreversibly by taking electrons to form carboxylate species. This was confirmed in the asymmetric and symmetric COO stretching peaks, even after oxidation.25,26 Therefore, the widened C
O stretching peak was still present after oxidation. As shown in Fig. S4,† EGD05 showed a severe increase in current after −2.0 V, which means another unfavorable reduction occurred. As shown in Fig. S5,† the reduced resonance structure could progress further irreversibly by taking electrons to form carboxylate species. This was confirmed in the asymmetric and symmetric COO stretching peaks, even after oxidation.25,26 Therefore, the widened C![[double bond, length as m-dash]](https://www.rsc.org/images/entities/char_e001.gif) O stretching would be contributed from the irreversible reduction and the small and broad peak at approximately 1678 cm−1 would appear due to the plausible resonance radical structure. MMA05 could not be investigated using the same method due to polymer migration into the AC under the potential and evanescent wave27 into the AC surface (Fig. S6†). On the other hand, considering the analogous potentiostatic behavior (Fig. S3 and S4†) and its same ester moiety, MMA05 would show a similar reversible reaction but the extent of the reaction would be slightly different from EGD05 (Fig. 1).
O stretching would be contributed from the irreversible reduction and the small and broad peak at approximately 1678 cm−1 would appear due to the plausible resonance radical structure. MMA05 could not be investigated using the same method due to polymer migration into the AC under the potential and evanescent wave27 into the AC surface (Fig. S6†). On the other hand, considering the analogous potentiostatic behavior (Fig. S3 and S4†) and its same ester moiety, MMA05 would show a similar reversible reaction but the extent of the reaction would be slightly different from EGD05 (Fig. 1).
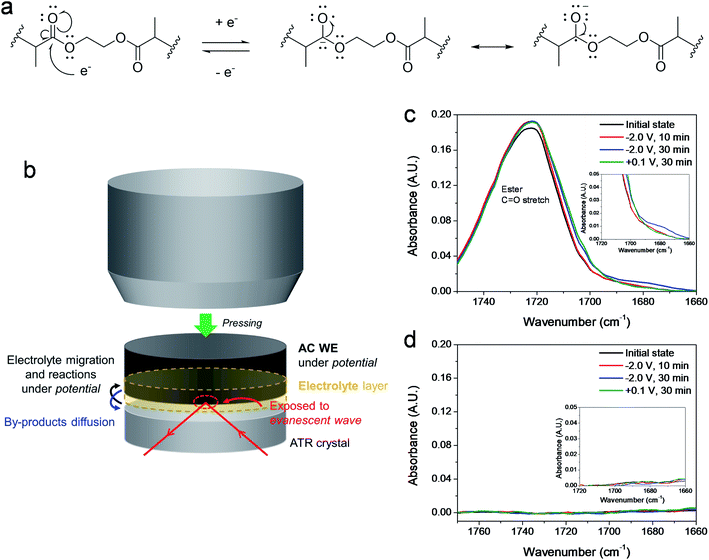 | ||
| Fig. 2 (a) Plausible redox mechanism of PEGDMA. (b) Illustration of operating in situ FTIR holding −2.0 and +0.1 V vs. AC. Absorbance spectra of (c) EGD05 and (d) LE with magnified insets | ||
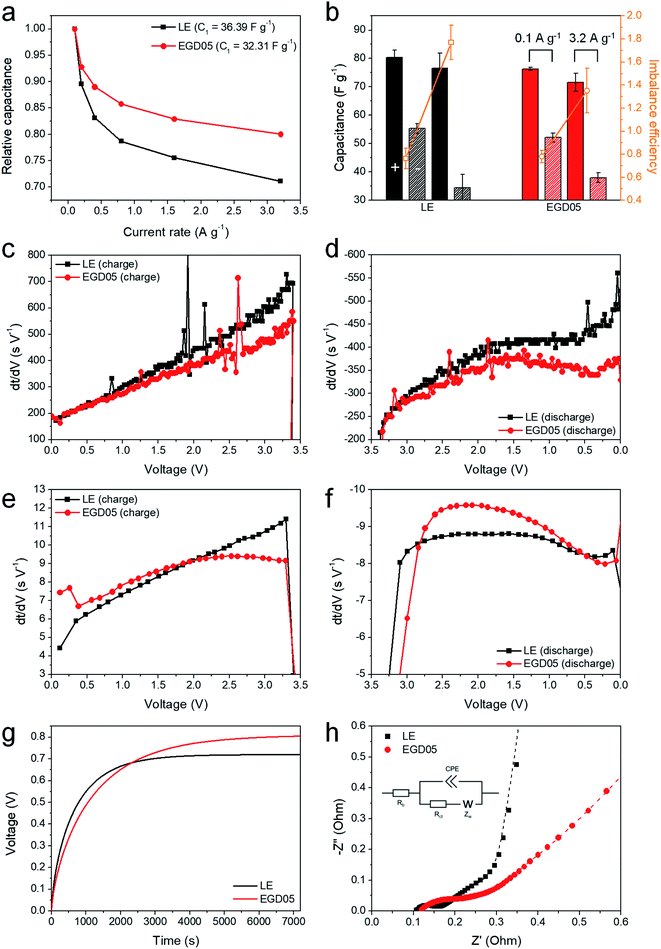
The galvanostatic performance was also investigated at various rates (Fig. 3). Despite the lower discharge capacitance of EGD05 at the slowest rate (C1 = 32.31 F g−1) due to its lower ionic conductivity,28 approximately 30% decrease in capacitance of LE was ameliorated to 20% decrease at the highest current rate, when using PEGDMA (Fig. 3a). To analyze this improvement, positive and negative discharge capacitances at 0.1 and 3.2 A g−1 were calculated (Fig. 3b) based on the potential distributions (Fig. S7a†). It was confirmed that the improved relative capacitance was contributed from the increase in negative capacitance at a high rate, and imbalance efficiency of both capacitances at 3.2 A g−1 was ameliorated by the GPE, thereby increasing the total capacitance. To investigate these mechanisms, the galvanostatic curves (Fig. S8†) were also analyzed. First derivative curve vs. voltage assists to determine where the increase in capacitance occurred.29 At 0.1 A g−1, EGD05 has a smaller capacitance throughout both processes (Fig. 3c and d). However, at 3.2 A g−1, EGD05 showed an increased capacitance at the initial charge and discharge voltage range (Fig. 3e and f). The increased charge and discharge capacitances did not show beyond the redox potential ranges (Fig. 1b), as in other PsC,21 therefore the increase in negative capacitance at high rate was considered mainly due to the enhanced capacitive process by PEGDMA. To investigate the mechanism, the open circuit voltage (OCV) variations of LE and EGD05 after discharging to 0 V were also observed (Fig. 3g). The OCV of EGD05 increased slowly to a higher voltage than of LE. This means that PEGDMA alleviated the rate of OCV variation, but held more ions near the negative AC electrode surface so that the ions could adsorb and desorb between PEGDMA and AC at a higher rate. At a lower rate, the charge–discharge process of EGD05 had to occur among the bulk electrolyte and AC, which would be affected by its lower ionic conductivity to decrease the total capacitance. The Nyquist plots at 3.4 V with an equivalent circuit were obtained to investigate the electrochemical performance of LE and EGD05 (Fig. 3h). Every SC was analyzed using three significant impedance components, bulk resistance (Rb), charge transfer resistance (Rct),30 coupled with the constant phase element (CPE), and Warburg impedance (Zw).31 As shown in Table S1,† Rb and Zw of EGD05 increased approximately 12 and 128%. This means that PEGDMA existed not only in the bulk electrolyte, but also in the AC pores. Rct of EGD05 also increased approximately 124% compared to that of LE, which was contributed from PEGDMA to form another faradaic reaction on the AC (Fig. 1) or behave as a resistance in the AC pores. In addition, Fig. S9† shows characteristic relaxation time constant (τ0).31 EGD05 showed a 1.33 s slower response than of LE, which corresponded to the Warburg impedance, namely, diffusion resistance in the AC pores, but this did not correspond to the relative capacitance (Fig. 3a) as reported by Teng et al.13 Therefore, the improvement of rate capability should be elucidated by another factor to enhance the high rate performance, such as some faradaic process (Fig. 1 and 2) or the ion reservoir effect (Fig. 3g) by PEGDMA in the AC pores. MMA05 demonstrated similar galvanostatic charge–discharge behavior to EGD05 (Fig. S10†), and showed similar frequency-dependent behavior (Fig. S9 and S10h†) with the alleviated increments of all impedance parameters (Table S1†).
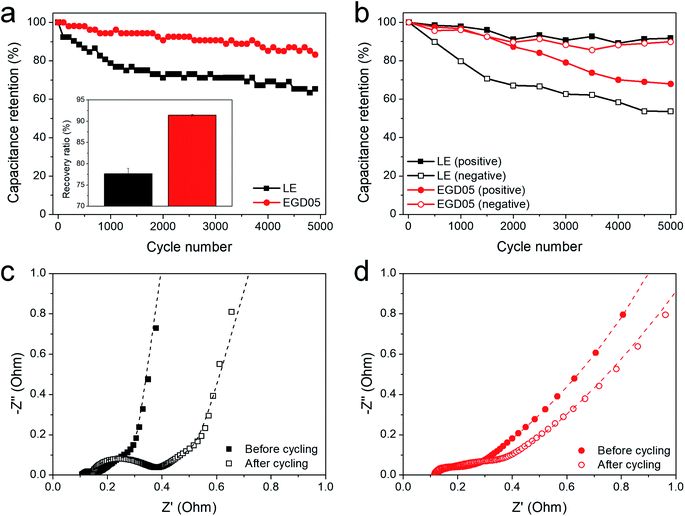
Fig. 4 presents cycling stability of LE and EGD05 at 3.4 V. EGD05 showed improved capacitance retention and recovery ratio after 5000 cycles (Fig. 4a). Positive and negative capacitances were also calculated based on the potential distributions during cycling (Fig. S7b† and 4b). LE showed severe loss of negative capacitance, but EGD05 showed a highly retained negative capacitance during cycling. Because maintaining the negative capacitance is more crucial for improving the cycling stability in this study (Fig. 3b), EGD05, showing superior retention of the negative capacitance (Fig. 4b) is a suitable SC for high voltage operation. Fig. 4c and d presents the Nyquist plots measured after cycling to analyze the changes in the impedance components. Since Rct in LE increased more than 350% after cycling, although Rb and Zw increased approximately 32 and 37%, the aggravation of Rct appeared to be the major cause of the deteriorated durability of LE (Table S2†).32 In EGD05, PEGDMA mitigated the aggravation of Rct, and even other components during cycling. MMA05 showed similar cycling stability to EGD05, but there were differences in the extent of the capacitance retention and increase in the impedance parameters (Fig. S11 and Table S2†).
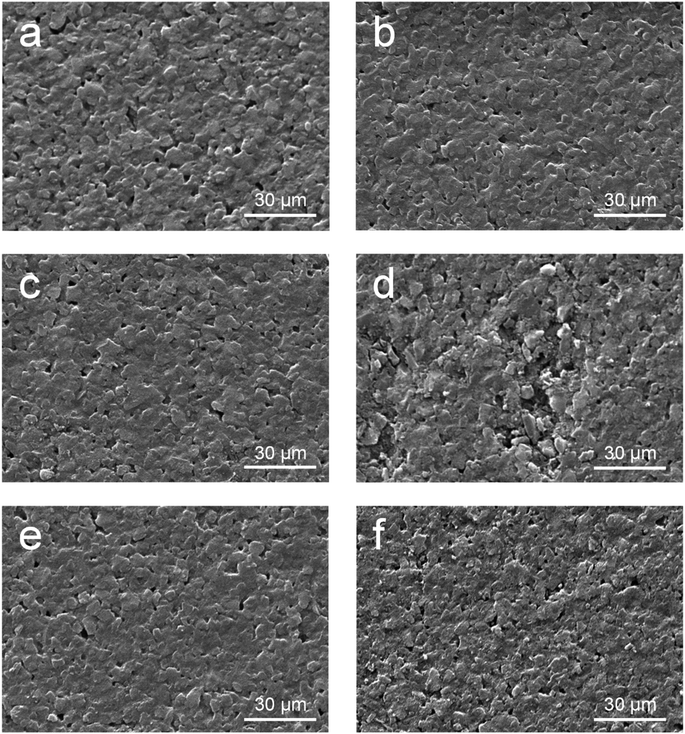
There might be two mechanisms for the improvement of cycling stability of EGD05. First, suppression of electrolytic decomposition by PEGDMA was investigated. Although the reaction might occur when operating AC SCs at high voltage,14,15 the electrochemical reaction was not severe during that cycling under the potential distribution,32 and there were no significant differences in the reactivity between LE and EGD05 in the cell potential ranges (Fig. 1, S4 and S7†). Then, second mechanism, electrode deformation, which can be occurred when continuously charged and discharged at high voltage, should be investigated. During that cycling, volumetric expansion of active materials may be caused by physisorption of electrolytes on electrode surface, bringing about severe deterioration of mechanical stability among active materials, including cracks of themselves and detachment from the electrode.16,32 As shown in Fig. 5, SEM images can explain the improved cycling stability of EGD05. No degradation of positive electrodes after cycling at 3.4 V was observed for both cells, compared to the pristine state (Fig. 5c and e). However, the negative electrode in LE showed detachments of active materials from the electrode (Fig. 5d), as in other studies.6,16,32 EGD05 showed less degraded negative electrode surface but rougher surface than the pristine one (Fig. 5f). This suggests that PEGDMA acted as an additional binder throughout the AC electrode to hold more the active materials mechanically during cycling, resulting more retained capacitance with suppressed increase in the impedance parameters. MMA05, which showed slightly retained capacitance, demonstrated some defects on the negative electrodes, as in LE (Fig. S12†). PMMA among the ACs would act as a binder, but it could not enhance the coherence among the active materials sufficiently. This result was also in accordance with a research that cross-linked binder can be stretched further and is adequate for electrode materials.33
Conclusion
This study examined the mechanism for improving the rate capability and cycling stability by archetypal methacrylate-based GPEs on the AC electrode. Non-faradaic process was confirmed to be more significant factor in improving the rate capability by PEGDMA with a slightly enhanced pseudocapacitive process in EGD05. Enhanced negative capacitance and ameliorated imbalance efficiency was observed for the improvement. This could be elucidated with the ion reservoir effect. Cycling stability at 3.4 V was also improved by PEGDMA due to the retained morphology of the negative electrode by the binder-like activity among the active materials. As a result, PEGDMA suppressed the aggravation of all impedance components during cycling, thereby leading the splendid maintenance of negative capacitance. MMA05, which was composed of PMMA, having the similar chemical structure, showed analogous electrochemical behavior as EGD05. With these results on archetypal methacrylate-based GPEs, other analogous GPEs with different functional moieties need to be uncovered to further improve the rate capability and durability at high voltage to achieve much higher power AC SCs.Conflicts of interest
There are no conflicts to declare.Acknowledgements
This work was supported by the 2019 Research Fund of the University of Seoul.References
- P. Simon and Y. Gogotsi, Nat. Mater., 2018, 7, 845–854 CrossRef PubMed.
- A. Borenstein, O. Hanna, R. Attias, S. Luski, T. Brousse and D. Aurbach, J. Mater. Chem. A, 2017, 5, 12653–12672 RSC.
- N. Liang, Y. Ji, J. Xu, D. Zuo, D. Chen and H. Zhang, J. Power Sources, 2019, 423, 68–71 CrossRef CAS.
- Z. Cui, C. X. Guo, W. Yuan and C. M. Li, Phys. Chem. Chem. Phys., 2012, 14, 12823–12828 RSC.
- C. T. Alexander, J. T. Mefford, J. Saunders, R. P. Forslund, K. P. Johnston and K. J. Stevenson, ACS Appl. Mater. Interfaces, 2019, 11, 5084–5094 CrossRef CAS PubMed.
- Y. Lee, J. Chung and C. Jung, Electrochim. Acta, 2017, 253, 59–67 CrossRef CAS.
- R. Yi, S. Chen, J. Song, M. L. Gordin, A. Manivannan and D. Wang, Adv. Funct. Mater., 2014, 24, 7433–7439 CrossRef CAS.
- K. Zhou, W. Zhou, L. Yang, J. Lu, S. Cheng, W. Mai, Z. Tang, L. Li and S. Chen, Adv. Funct. Mater., 2015, 25, 7530–7538 CrossRef.
- M. Boota and Y. Gogotsi, Adv. Energy Mater., 2019, 9, 1802917 CrossRef.
- L. Pan, Y. Wang, H. Hu, X. Li, J. Liu, L. Guan, W. Tian, X. Wang, Y. Li and M. Wu, Carbon, 2018, 134, 345–353 CrossRef CAS.
- H. Peng, B. Yao, X. Wei, T. Liu, T. Kou, P. Xiao, Y. Zhang and Y. Li, Adv. Energy Mater., 2019, 9, 1803665 CrossRef.
- Y. Huang, Y. Shi, Q. Gong, M. Weng, Y. Li, J. Gan, D. Wang, Y. Shao, M. Zhao, D. Zhuang, J. Liang, F. Pan, H. Zhu and C. Nan, J. Mater. Chem. A, 2019, 7, 10058–10066 RSC.
- K. P. Wang and H. Teng, J. Electrochem. Soc., 2007, 154, A993–A998 CrossRef CAS.
- P. Kurzweil and M. Chwistek, J. Power Sources, 2008, 176, 555–567 CrossRef CAS.
- H. Yong, H. Park, J. Jung and C. Jung, J. Ind. Eng. Chem., 2019, 76, 429–436 CrossRef CAS.
- M. Ebner, F. Marone, M. Stampanoni and V. Wood, Science, 2013, 342, 716–720 CrossRef CAS PubMed.
- L. Kumar, P. K. Boruah, M. R. Das and S. Deka, ACS Appl. Mater. Interfaces, 2019, 11, 37665–37674 CrossRef CAS PubMed.
- H. Park, H. Yong, J. Jung and C. Jung, ChemElectroChem, 2019, 6, 4418–4428 CrossRef CAS.
- Y. Kumar, G. P. Pandey and S. A. Hashmi, J. Phys. Chem. C, 2012, 116, 26118–26127 CrossRef CAS.
- P. Sivaraman, S. P. Mishra, D. D. Porphode, A. P. Thakur, K. Shashidhara, A. B. Samui and A. R. Bhattacharyya, RSC Adv., 2015, 5, 83546–83557 RSC.
- Q. Mahmood, S. K. Park, K. D. Kwon, S.-J. Chang, J.-Y. Hong, G. Shen, Y. M. Jung, T. J. Park, S. W. Khang, W. S. Kim, J. Kong and H. S. Park, Adv. Energy Mater., 2016, 6, 1501115 CrossRef.
- J. Zhang, H. Chen, X. Sun, X. Kang, Y. Zhang, C. Xu and Y. Zhang, J. Electrochem. Soc., 2017, 164, A820–A825 CrossRef CAS.
- J. Wang, J. Polleux, J. Lim and B. Dunn, J. Phys. Chem. C, 2007, 111, 14925–14931 CrossRef CAS.
- K. Nakahara, S. Iwasa, M. Satoh, Y. Morioka, J. Iriyama, M. Suguro and E. Hasegawa, Chem. Phys. Lett., 2002, 359, 351–354 CrossRef CAS.
- M. Ibrahim, A. Nada and D. E. Kamal, Indian J. Pure Appl. Phys., 2005, 43, 911–917 CAS.
- S. K. Papageorgiou, E. P. Kouvelos, E. P. Favvas, A. A. Sapalidis, G. E. Romanos and F. K. Katsaros, Carbohydr. Res., 2010, 345, 469–473 CrossRef CAS PubMed.
- G. T. Fieldson and T. A. Barbari, AIChE J., 1995, 41, 795–804 CrossRef CAS.
- I. I. Misnon, R. A. Aziz, N. K. M. Zain, B. Vidhyadharan, S. G. Krishnan and R. Jose, Mater. Res. Bull., 2014, 57, 221–230 CrossRef CAS.
- D. Yu, K. Goh, H. Wang, L. Wei, W. Jiang, Q. Zhang, L. Dai and Y. Chen, Nat. Nanotechnol., 2014, 9, 555–562 CrossRef CAS PubMed.
- D. Qu, J. Power Sources, 2002, 109, 403–411 CrossRef CAS.
- B. Liu, M. Yang, H. Chen, Y. Liu, D. Yang and H. Li, J. Power Sources, 2018, 397, 1–10 CrossRef CAS.
- H. Park, J. Chung, B.-I. Lim and C. Jung, J. Ind. Eng. Chem., 2019, 80, 301–310 CrossRef CAS.
- Z. Chen, L. Christensen and J. R. Dahn, J. Electrochem. Soc., 2003, 150, A1073–A1078 CrossRef CAS.
Footnote |
| † Electronic supplementary information (ESI) available. See DOI: 10.1039/c9ra08765f |
| This journal is © The Royal Society of Chemistry 2020 |

