 Open Access Article
Lamellae-controlled electrical properties of polyethylene – morphology, oxidation and effects of antioxidant on the DC conductivity†
Mattias E. Karlsson a,
Xiangdong Xub,
Henrik Hillborgc,
Valter Strömd,
Mikael S. Hedenqvista,
Fritjof Nilsson*a and
Richard T. Olsson
 *a
*a
aDepartment of Fibre and Polymer Technology, School of Engineering Sciences in Chemistry, Biotechnology and Health, KTH Royal Institute of Technology, SE-100 44 Stockholm, Sweden. E-mail: rols@kth.se; Fax: +46 8208856; Tel: +46 87906000
bDepartment of Materials and Manufacturing Technology, Chalmers University of Technology, SE-412 96 Gothenburg, Sweden
cABB Power Grids Research, SE-721 78 Västerås, Sweden
dMaterial Science and Engineering, School of Industrial Engineering and Management, KTH Royal Institute of Technology, SE-100 44 Stockholm, Sweden
First published on 29th January 2020
Abstract
Destruction of the spherulite structure in low-density polyethylene (LDPE) is shown to result in a more insulating material at low temperatures, while the reverse effect is observed at high temperatures. On average, the change in morphology reduced the conductivity by a factor of 4, but this morphology-related decrease in conductivity was relatively small compared with the conductivity drop of more than 2 decades that was observed after slight oxidation of the LDPE (at 25 °C and 30 kV mm−1). The conductivity of LDPE was measured at different temperatures (25–60 °C) and at different electrical field strengths (3.3–30 kV mm−1) for multiple samples with a total crystalline content of 51 wt%. The transformation from a 5 μm coherent structure of spherulites in the LDPE to an evenly dispersed random lamellar phase (with retained crystallinity) was achieved by extrusion melt processing. The addition of 50 ppm commercial phenolic antioxidant to the LDPE matrix (e.g. for the long-term use of polyethylene in high voltage direct current (HVDC) cables) gave a conductivity ca. 3 times higher than that of the same material without antioxidants at 60 °C (the operating temperature for the cables). For larger amounts of antioxidant up to 1000 ppm, the DC conductivity remained stable at ca. 1 × 10⁻¹⁴ S m−1. Finite element modeling (FEM) simulations were carried out to model the phenomena observed, and the results suggested that the higher conductivity of the spherulite-containing LDPE stems from the displacement and increased presence of polymeric irregularities (formed during crystallization) in the border regions of the spherulite structures.
1 Introduction
The nature of electrical conduction in insulating polymers is still not fully understood despite extensive research during the last decades.1,2 A large number of underlying physical phenomena have been reported to affect the DC conductivity of thin film-shaped insulation materials; e.g. different charge carrier types (electrons, holes, ions, polar molecules), different carrier origins (intrinsic, injected), and different transport mechanisms (hopping, tunnelling, trap–band transition).3–7 Here, the small measured currents and the long relaxation times to steady state current add to the complexity in understanding the resistivity in some of the most insulating materials.3,8 At the same time, the operating voltages of extruded high voltage direct current (HVDC) cables has increased over the past decades9,10 and 640 kV (with a transmission capacity of up to 3.1 GW) is currently available.11 The attempts to reach higher voltages stem from the reduced energy losses and the more efficient power transmission over longer distances.12,13 A higher operating voltage demands however better insulating materials, preventing electrical charge build-up that may lead to premature insulation failure.Among different strategies to prepare more insulating polyethylene, considerable attention has been given to inorganic nanoparticles as traps for mobile charges.14 The effect of nanoparticle surface modifications and molecular interactions at the particle interfaces' is therefore currently emerging as an extensive field of research.14–16 The removal of charge carriers from the pure polymer preceded these studies, resulting in the production of ultra-pure low-density polyethylene (LDPE) as insulation in extruded HVDC cables.13 Complete elimination of charge carriers was however impossible since LDPE is required to be cross-linked to give useful mechanical properties in HVDC insulation applications.13 The cross-linking reactions generate charge carrier by-products (acetophenone, cumyl alcohol and methane), which remain in the polymer even after extensive degassing.17 This is in contrast to polypropylene (PP) that does not need to be cross-linked to show the required mechanical properties.18 The cross-linked low-density polyethylene is nevertheless the most large-scale manufactured polymer for HVDC cable insulation, making it an important material from an industrial point of view.19 A better understanding of the underlying phenomena governing or impeding conduction is therefore critical for the future development of next generation of long-distance HVDC-cables that can contribute to more efficient power transmission.
It has previously been shown that the dielectric properties of the semi-crystalline LDPE polymer can be altered by blending the LDPE with small fractions of HDPE (high density polyethylene), which sometimes reduces the conductivity by an order of magnitude.20–27 The HDPE allows ca. 4 nm thicker lamella to grow in the semi-crystalline LDPE matrix containing mostly 7–8 nm thick crystals.20 It was argued that the presence of these thicker crystals and increased depth of trap sites is the cause of the conductivity decrease.20 In this paper, the DC conductivity of thin film-shaped LDPE has been examined with respect to the organization of the crystalline phase of the LDPE, while retaining a constant crystal lamellar thickness and a total crystalline content of 51 wt%. The materials were identically synthesized polyethylene that had been processed into films containing either banded spherulites of 8 nm thick lamellae or randomly dispersed lamellae of the same thickness. The films containing the randomly dispersed lamellae had a conductivity 4 times lower than that of the spherulite-containing LDPE. The addition of an antioxidant to the LDPE with randomly organized lamellae increased the conductivity (ca. 3 times), whereas a low degree of oxidation of the LDPE resulted in a significant decrease in conductivity (ca. 100 times). The arrangement of the crystalline phase and the effect of oxidation were evaluated at several temperatures and electrical fields, and theoretically interpreted by finite element modelling. The exact mechanisms for the reduction in conductivity as related to morphologies are yet to be identified but the results here presented show for the first time the relative impact of a number of underlying factors affecting the conduction, and present a viable theory that may explain how the conduction is favoured (and why) in semi-crystalline low-density polyethylene.
2 Experimental
2.1 Materials
Low-density polyethylene (LDPE) pellets were provided by Borealis AB. Irganox 1076 (CAS: 2082-79-3, Ciba Specialty Chemicals), n-heptane (CAS: 142-82-5, ≥99%, VWR), orthophosphoric acid (CAS: 7664-38-2, >85%, VWR), sulfuric acid (CAS: 7664-93-9, ≥98%, Sigma Aldrich) and potassium permanganate (CAS: 10294-64-1, ≥99%, VWR) were used as received.2.2 Sample preparation
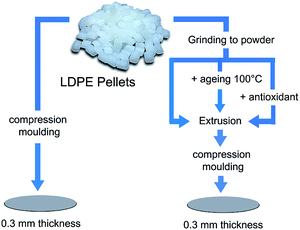
Fig. 1 shows the sample preparation procedure's starting with LDPE pellets to obtain circular samples with a diameter of 75 mm and a thickness of 0.3 mm. Note that compression moulding using a LabPro 400 press (Frontlijne Grotnes) was always the final step. The pressing was carried out at 130 °C by applying a contact pressure for 10 min and then a high force (200 kN) for 10 min followed by cooling to room temperature under the same force for 6 min with controlled water cooling. Polyethylene terephthalate (PET) film or aluminium foil was placed on both sides of the samples as a protective material during pressing. LDPE powder was obtained by cryo-grinding (Retsch ZM 200) at a rotation speed of 12![[thin space (1/6-em)]](https://www.rsc.org/images/entities/char_2009.gif) 000 rpm after freezing the LDPE pellets in liquid nitrogen.
000 rpm after freezing the LDPE pellets in liquid nitrogen.
Prior to compression moulding, the powder was extruded without additives, extruded with added antioxidants, or aged prior to extrusion. When the antioxidant (AO) was added to the LDPE, the powder was mixed with the predetermined amount of AO by first dissolving the antioxidant in a small amount of heptane (3 mL) followed by mixing of the LDPE/heptane mixture in a Vortex Genie 2 Shaker (G560E, Scientific Industries) for 1 h and finally drying overnight at 80 °C. The compounding was done at 150 °C and 100 rpm (using a Micro 5cc Twin Screw Compounder, DSM Xplore) for different extrusion times (up to 12 min) and the materials obtained were pelletized prior to compression moulding.
In the case of the aging prior to extrusion, LDPE powder was aged at 100 °C in a circulating air oven (Memmert UF 260) for 1–10 days, after which the aged powders were either vacuum dried for 3 h at 100 °C prior to extrusion or extruded directly after aging. The aged powders were shaken for 1 h prior to extrusion and the extrusion time was 1 min with a purge of nitrogen into the barrel.
2.3 Morphology and thermal characterization
A S-4800 field emission scanning electron microscope (SEM) from Hitachi was used to investigate the bulk morphology of compression moulded samples after permanganic etching of the amorphous domains to reveal the crystalline structures. Cross-sections of the pressed films were obtained by freeze cracking in liquid nitrogen, and they were then etched and investigated by SEM to characterize the bulk morphology. The etching proceeded for 2 h in an acid etchant of 4 mL water, 16 mL orthophosphoric acid, 40 mL sulfuric acid and 600 mg potassium permanganate and the samples were cleaned by rinsing with water and finally dried in a desiccator over night.28 The samples were sputtered (Cressington 208 HR sputter) with a Pt/Pd (60/40) conductive layer for 20 seconds using a current of 80 mA prior to electron microscopy where an acceleration voltage of 1 kV and emission current of 10 μA were used. The density was measured using a Precisa XR 205 SM-DR density determination kit with 2-propanol as solvent. The melt flow index was measured on a CFR 91 from DGTS according to the ISO 1133 Standard with a load of 2.16 kg at 190 °C. A differential scanning calorimeter (DSC) from Mettler-Toledo (DSC1) was used to study the mass crystallinity (wc), peak melting temperature (Tm) and onset crystallization temperature (Tc) of the compression moulded samples on 5 ± 0.5 mg pieces with a temperature change of 10 °C min−1 in a flow of nitrogen of 50 mL min−1. The samples were cooled to −50 °C, heated to 200 °C, again cooled to −50 °C and finally heated to 200 °C with a pause of 5 min at each constant temperature. The mass crystallinity was obtained from the first melting curve using the total enthalpy method.
 | (1) |
 | (2) |
A TG/DSC1 from Mettler-Toledo was used for the thermogravimetric analysis (TGA) on neat LDPE either with a non-isothermal increase in temperature (10 °C min−1) to 600 °C or isothermally at 150 °C for several hours. An oxygen atmosphere was used with a gas flow of 50 mL min−1. A Spectrum 100 (PerkinElmer) was used for Fourier-transform infrared spectroscopy (FTIR) of the aged samples using attenuated total reflection with a Golden Gate accessory (Graseby Specac LTD).
2.4 Electrical characterization
The samples produced were characterized at two different facilities with similar setups for measuring the leakage current through the insulation at high electric fields. For the setup at CTH (Chalmers University of Technology), a Keithley electrometer (6517 series) was used to measure the current flowing through the specimen placed in a shielded electrode system. A high voltage DC supply (Glassman FJ60R2, 60 kV) as well as an electrometer internal voltage supply (up to 1 kV) were utilized to obtain a broad range of testing electric fields (3.3, 12.5 and 30 kV mm−1). A low-pass filter to remove high frequency noise was integrated at the high voltage side. Two different electrode systems were used for the measurements, a Keithley 8009 electrode system for voltages up to 1 kV and a three-electrode system for voltages above 1 kV. DC conductivity measurements were made for at least 18 h in a dry air environment at 25, 40 and 60 °C at various electric field strengths (3.3, 12.5 and 30 kV mm−1). In both the electrode systems, the sensing electrode was shielded from leakage current by a guard electrode. The measured current data were collected in real time and filtered with an algorithm optimizing the necessary averaging. It was applied by evaluating the accumulated standard deviation of every incoming data point in a LabVIEW-based software, the data being collected at the highest possible speed (10 readings per second) and resolution (6.5d). The DC conductivity measurements at KTH (Royal Institute of Technology) were performed using a three-electrode system with sensing (30 mm in diameter) and guard electrode in brass and a high voltage electrode of stainless steel with a conductive rubber film between the sample and the high voltage electrode (Powersil 440). The data were obtained at a speed of 8 readings per second with a Keithley 6517B electrometer and collected in a LabVIEW software also controlling the high voltage supply (FUG HCP 35-12500). The electrode system was placed in an oven (Binder FED 115) heated to 60 °C in dry air. The electrical characterizations at CTH and KTH were made on samples compression moulded using protective Al foils and PET films, respectively.3 Results and discussion
3.1 Polymer morphology
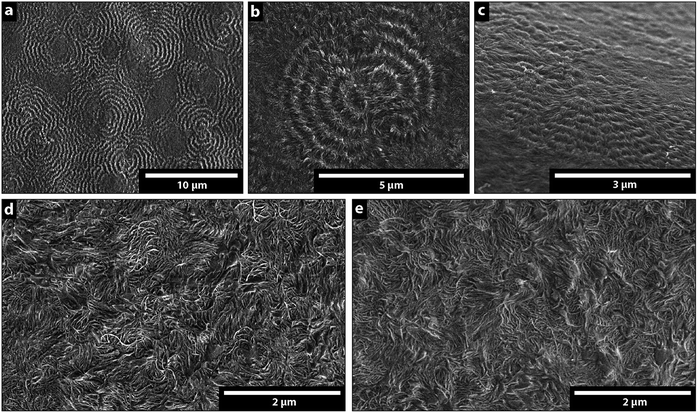
Fig. 2a and b show the supermolecular structure of ca. 5 um banded spherulites in thin films prepared by compression moulding of LDPE. The banded spherulites consist of radially grown lamellae with a thickness of ca. 8 nm (Table 1), splaying from their centre point of nucleation.31 Fig. 2d and e show that the bulk morphology changed to a random lamellar structure when the LDPE was extruded prior to the compression moulding. The randomly dispersed crystalline lamellae showed dominantly C- and S-shapes, and the lamellar thickness was also here 8 nm (Table 1). The transformation from the banded spherulites to the randomly arranged lamellae occurred with only 10 s extrusion time (Fig. 2d). A longer extrusion time of 6 min (Fig. 2e) did not further affect the randomly dispersed crystalline morphology, which contained no spherulites. Fig. 2c shows a cryo-fractured and etched cross-section of the pellets supplied by the LDPE manufacturer and demonstrates that the spherulitic structures were present in the original material, while Fig. S1† shows that 0.02 wt% antioxidant had no effect on the morphology development during the extrusion of the LDPE. To ensure homogeneity of the samples before further characterization, the densities of all the prepared samples were determined. All the materials had densities of 0.923 ± 0.001 g cm−3, regardless of the preparation technique, i.e. none of the samples contained voids.| Sample preparation method | wca (%) | Tcb (°C) | Tmc (°C) | Lcd (nm) |
|---|---|---|---|---|
| a Mass crystallinity.b Onset crystallization temperature with a cooling rate of 10 °C min−1.c Peak melting temperature with a heating rate of 10 °C min−1.d Lamellae crystal thickness. | ||||
| Pressed pellets | 52 | 100.7 | 109.4 | 7.9 |
| Extruded 10 s prior pressing | 49 | 101.6 | 109.8 | 8 |
| Extruded 6 min prior pressing | 50 | 102.5 | 110.2 | 8.1 |
| Extruded 12 min prior pressing | 51 | 102.4 | 110 | 8.1 |
| LDPE + 0.02% antioxidant (6 min) | 51 | 102.3 | 110.1 | 8.1 |
Table 1 shows the mass crystallinity, onset crystallization temperature and peak melting temperature obtained from DSC thermal analysis at a heating/cooling rate of 10 °C min−1. All the samples had a crystallinity of 51 ± 2 wt% and there was no significant difference in the peak melting temperature (109.8 ± 0.4 °C).
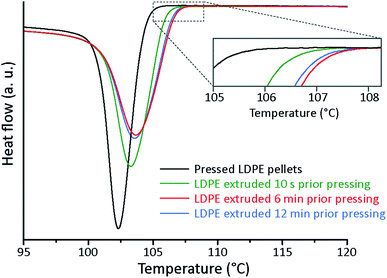
The onset crystallization temperature (Tc) with a cooling rate of 10 °C min−1 was 100.7 °C for the solely compression moulded material and it was 101.6 °C for the LDPE exposed to an extrusion time of 10 s prior to the compression moulding. For longer extrusion times (6 and 12 min), the onset crystallization temperature was 102.4 ± 0.1 °C, which was similar to that of the LDPE containing antioxidants. Fig. 3 shows the onset crystallization with a cooling rate of 1 °C min−1. In agreement with the results at a cooling rate of 10 °C min−1, the onset crystallization temperature was lowest for the non-compounded compression moulded material (104.2 °C), intermediate for the samples that had been extruded for 10 s (105.9 °C), and highest for the samples with an extrusion time of 6–12 min (106.5 ± 0.1 °C). It could thus be concluded that the crystallization of the random lamellar structure was initiated at a temperature more than 2 °C higher than for the samples containing the spherulitic structures.
Previously, Mandelkern32 et al. suggested that the random lamellae were formed as a consequence of allowing the polyethylene melt to crystallize at a high rate with significant undercooling. The randomized crystalline structure thus forms as a consequence of diffusion-controlled growth under conditions where the formation of more organized spherulites is restricted.32 Important factors affecting the diffusivity of the molecular structures during cooling include branching density and molecular weight, in addition to the degree of undercooling. Only randomly organized lamellae have, for example been obtained for very high molecular weights (>1 × 10⁶ g mol−1) regardless of the rate of crystallization and of the degree of undercooling, and a more extensive short chain branching also tends to favour the formation of random lamellae.31,32 The banded spherulites consisting of C- and S-shaped lamellae are, in contrast, more commonly formed with intermediate mass polyethylene at a low crystallization temperature.31 In the present study, the morphological differences were obtained using the same LDPE material and identical conditions for cooling, which subsequently resulted in the same degree of crystallinity (51 wt%). The difference in polyethylene morphology could thus not be due to any intrinsic differences in the molecular structure of the LDPE. The measured melt flow index value for the LDPE as supplied from the manufacturer were also the same as that of the material extruded for 6 min at 150 °C (1.8–1.9 g/10 min), indicating that the extrusion process did not to any significant extent affect the molecular weight of the polymer. The absence of supermolecular spherulite structures was therefore attributed to the extrusion dispersion of nucleation sites that were initially dominantly located in the volumes associated with the spherulites in the original LDPE. This caused nucleation to occur more frequently, simultaneously and rapidly throughout the material, so that there were fewer molecular sequences available at the interface of any growing lamellae. The uniform dispersion of the nucleation sites also allowed the random lamellae crystal growth to be initiated and terminated at the higher temperatures observed during the cooling sequence (see Fig. 3).
3.2 Influence of polymer morphology on the DC conductivity
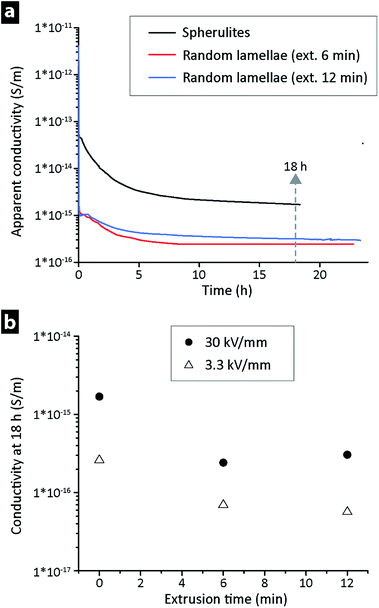
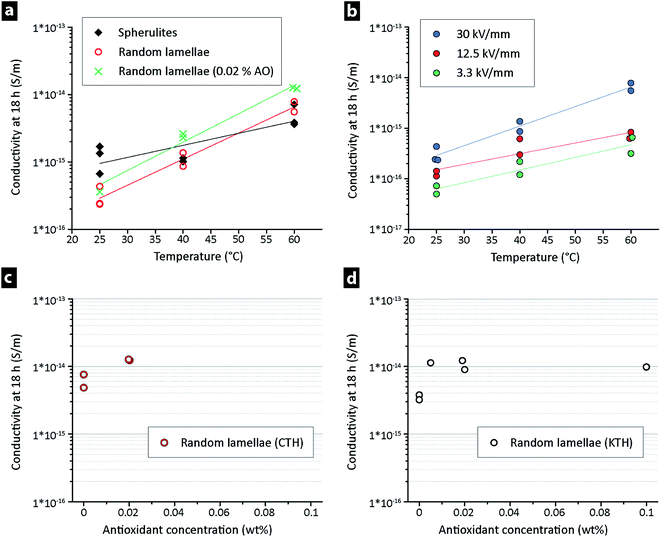
Fig. 4a shows the apparent conductivity versus time for LDPE at 30 kV mm−1 and 25 °C, the only difference being that the two materials with a conductivity ca. 5 times lower at ‘steady-state’ had been extruded 6 and 12 min prior to their compression moulding, i.e. that they had a random lamellar morphology. The lower conductivity of the extruded LDPE was also confirmed at different field strengths for the 6 and 12 min extruded materials, see Fig. 4b. The values in Fig. 4b were recorded after 18 h, i.e. when the ‘steady-state’ current had been reached (see arrow in Fig. 4a). On average, a decrease in field strength from 30 to 3.3 kV mm−1 led to a conductivity that was ca. 5 times lower, with the random lamellae samples always displaying values lower than that of the LDPE directly hot-pressed into a film. Identical measurements were performed at 40 and 60 °C at a field strength of 30 kV mm−1, Fig. 5a. The extruded LDPE containing the randomly organized lamellae here lost its more insulating properties to a greater extent than the non-extruded. At 60 °C, the extruded samples displayed a conductivity higher than that of the samples that had not been extruded (containing spherulites).Fig. 5b displays the vertical shift in the σ–T line towards higher conductivity when the electrical field was increased from 3.3 to 30 kV mm−1 for the 6 min extruded LDPE, corresponding to an increase in conductivity of about one order of magnitude.
Fig. 5a also shows that the addition of 0.02 wt% antioxidant to the random lamellae LDPE resulted in a higher conductivity than for the random lamellae LDPE without antioxidant. The effect of the antioxidant concentration at 60 °C is further shown in Fig. 5c and d, after 18 h of measurement. The addition of 50 ppm antioxidant resulted in a conductivity 3 times higher than that of the samples without antioxidant (Fig. 5d). An increase in the antioxidant concentration to 0.02 wt% (4 times) did not affect the conductivity (Fig. 5d). It was therefore concluded that a slight oxidation of the LDPE without antioxidant during the extrusion process had contributed to the reduced conductivity and/or that the antioxidant simply facilitated charge transfer while prohibiting oxidation of the LDPE during the processing. A five-fold increase in concentration from 0.02 to 0.1 wt% did not however lead to further increase in the conductivity, supporting the hypothesis that the reduced conductivity stemmed from oxidation of the LDPE during the high temperature processing at 150 °C. Fig. S2a† shows a non-isothermal thermogravimetric measurement (25–600 °C) under oxygen, confirming the LDPE oxidation as a mass increase in the region of 210–230 °C, as a shoulder prior to the mass loss associated with degradation of the polymer. An isothermal TGA at 150 °C in oxygen is further shown in Fig. S2b.† A clear increase in mass was seen over time and the inset shows that the mass started to increase after 5 min. No quantitative comparison could however be made for the compounding process, as the extrusion was carried out in a closed barrel under air.
Fig. 5c and d highlights that separately prepared materials with identical composition gave almost identical data on different instrumental setups. The comparison was made to ensure high reproducibility in the measured small currents, since it is in general difficult to compare absolute values of the DC conductivity due to that leakage currents can be influenced by sample thickness, electrode materials, humidity, protective pressing film and sample preparation etc.19,33 Ghorbani et al.34 recently demonstrated that, in spite of those challenges, it is possible to obtain reproducible DC conductivity data from thin film-shaped samples. The importance of a critical control of the sample storage, thermal history, electrical history and polymer processing was emphasized with a focus on consistent cooling rate during compression moulding, although it was at the same time shown that even the protective film used for the compression moulding affected the results.19,35 In the present work it is concluded that the data on the two different instrumental setups provided very similar data, although the protective films used in the pressing of the materials were different, i.e. aluminium (CTH) and PET film (KTH). Fig. S3a† shows that smoother surfaces were always present when pressing with PET film, whereas the pressing film topography was clearly evident when pressing with aluminium foil, see Fig. S3b.† PET films may however always be advantageous in any context of hygroscopic polymers, while showing little relevance for accurate measurements on LDPE. Overall, it could be concluded that the instrumental setups provided satisfactory measurements throughout the study (as evidenced by the recorded data acquired on two different instrumental setups).
3.3 Influence of oxidation (aging) on the DC conductivity
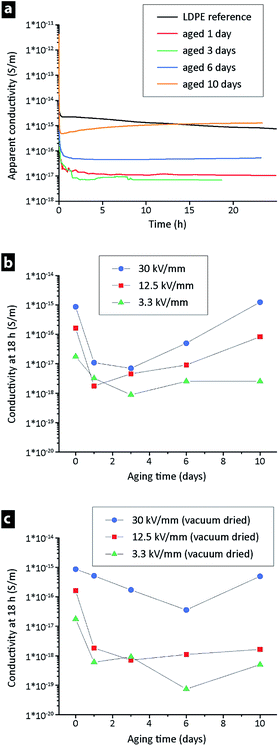
To study the effect of oxidation on the conductivity, samples of the LDPE powder were aged prior to the extrusion and compression moulding. The aging was performed at 100 °C under ambient conditions for 1, 3, 6 and 10 days. Fig. 6a shows the apparent conductivity (at 25 °C, 30 kV mm−1) as a function of aging time. The conductivities (after 18 h) of the samples aged for 1–3 days were two decades lower than that of the un-aged extruded LDPE, but after longer aging times (6 and 10 days) the conductivity again increased. The trend was also evident at different field strengths when the conductivity at 18 h was plotted against the aging time for 3.3–30 kV mm−1 (Fig. 6b). A distinct minimum in conductivity was observed for all three samples (including the 30 kV mm−1 sample) in the range of 1–3 days aging. The same experiment was performed for a new batch of LDPE powder, the only difference being that the aged powder was dried under vacuum (after aging) prior to the extrusion. The hypothesis was that the vacuum drying could assist in removing low molecular mass species that formed during the aging. Fig. 6c shows that the smallest steady-state currents (measured after 18 h) were recorded on samples that had been aged for ca. 6 days. It has previously been reported that small amounts of carbonyl groups can decrease the conductivity due to the trapping of charge carriers, but if the concentration of polar oxygen groups is large enough the conductivity will instead increase.36 Carbonyl groups are generated by oxidation of the polymer chain as low molecular mass species at longer oxidation times, see Fig. 7.37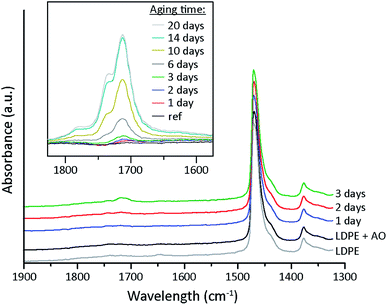 | ||
| Fig. 7 FTIR spectra of LDPE thin film samples for various aging times of the LDPE powder prior to extrusion. The inset shows the carbonyl absorption of a LDPE thin film sample aged at 100 °C. | ||
3.4 Influence of morphology and oxidation on the DC conductivity – FEM simulations and analysis
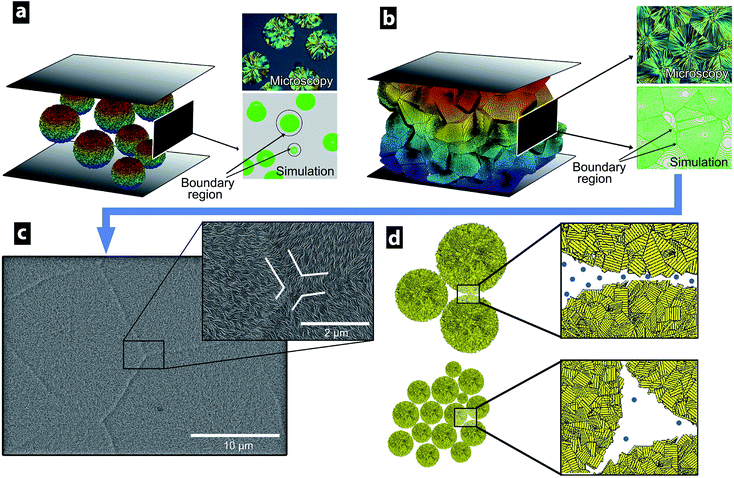
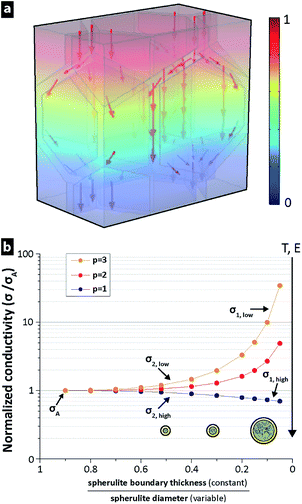
To examine the influence of LDPE morphology and oxidation in relation to the DC conductivity in different electric fields and at different temperatures, a finite element model (FEM) was developed. A high electronic bandgap usually correlates with a low conductivity.4 Crystalline PE has a bandgap of 8.8 eV, amorphous LDPE has a bandgap of 8.0–8.1 eV and amorphous LDPE with sufficient impurities has a significantly lower bandgap (5–7 eV).38–40 Therefore, it was assumed that charge transport in the LDPE occurs dominantly in amorphous regions with higher concentrations of impurities, i.e. along the crystalline lamellar layers in the spherulites,41 and along spherulite boundaries.42–45 In the FEM model, the conductive paths were considered to exist dominantly in the thin amorphous regions along the spherulite boundaries. The locally increased conductivity at the spherulite boundaries was caused by spherulites expelling trace impurities and polymer irregularities (TIPIs) together with chemical defects, i.e. assuming that the spherulite growth is perfectly clean and includes only polyethylene chains.46 Polymer irregularities were here considered as differently sized short-chain branches, while chemical defects may include a range of unsaturated bonds, e.g. double, conjugate double and vinyl, together with oxygen-containing groups, which exist in PE.40 Fig. 8a illustrates this boundary region with a constant thickness for two differently sized spherulites. An equally thick film sample would thus generate a higher concentration of possible TIPIs in the boundaries (cTIPIs), as larger spherulites have formed and have forced more conductive TIPIs into the spherulite boundary region with constant thickness (see Fig. 8a). For spherulites grown to sizes limited by their neighbouring spherulites, the boundary regions overlap, as shown in Fig. 8b and c. Fig. 8d illustrates the more TIPI-concentrated region present between the larger sized spherulites, i.e. compared to the case when an equal volume of molten polymer forms several smaller spherulites that assist in a more uniform spreading of the TIPIs throughout the material on a macroscopic scale.Fig. 9a shows the electric potential drop V0 between opposite sides of the thin films, while the other sides were given periodic boundary conditions allowing the sample films to be viewed as several repeating boxes. This made it possible to compute the conductivity by integrating the currents inside a repeating box with the idealized hexagonal spherulite structure with variable interlayer thickness (Fig. 9a). The concentration of TIPIs in the boundary region was approximated as cTIPIs = cA/(1 − φS), where cA is the concentration of TIPIs in a sample without spherulites and φS is defined as the volume fraction of spherulites.
The hypothesis that there was a more conductive network in the boundary region was based on previous observations that the amount of space charges decreased42–44 and the electrical strength increased45 with decreasing spherulite size, for both PE and other semi-crystalline polymers. A linear relationship between σ and c was used as a first approximation, although the local conductivity σ may show percolation behaviour and a small increase in cTIPIs may result in a large increase in current in certain regions. In order to take into account a potential non-linearity, it was proposed that the normalized conductivity would be proportional to a power of the TIPIs concentration in the boundary region of the spherulites, i.e.
| (σ/σA) = (cTIPIs/cA)p | (3) |
Fig. 10 illustrates schematically a region in two thin films where TIPIs are concentrated in the spherulite boundary regions with different sized spherulites (Fig. 10a and c) and that the TIPIs concentration cA is completely dispersed in a homogenous film (Fig. 10e). On a sub-atomistic level, each TIPI is presumed to influence the electronic structure in its vicinity with a probability that decreases with increasing distance between the TIPIs. With increasing energy (i.e. increasing field strength (E) or increasing temperature (T)), the influence radius of the TIPIs also increases. When two TIPIs show overlapping influence radii (Fig. 10a), the probability of charge transport significantly increases, resulting in a normalized conductivity that increases, whereas at lower E, T and c, the influence radius of the TIPIs may not provide a similar overlap for charge transfer and no percolation occurs on larger length scales in the spherulitic boundaries (Fig. 10c and e). With decreasing size of the spherulites, the conductivity goes towards the reference conductivity σA with a concentration cA of dispersed TIPIs (see Fig. 9b), which is also illustrated in Fig. 10c–f demonstrating percolation behaviour at high but not at low energies. Accordingly, for sufficiently small spherulite diameters, the normalized conductivity approaches the conductivity of the amorphous bulk phase, which is represented by σA and cA, independently of the energy supplied to the system (i.e. p-value exponent in the power law assumption in eqn (3)).
Considering the 4 times lower measured conductivity of the random lamellae structure, and its display of the reverse phenomenon at higher temperature, Fig. 10 presents an explanation. The morphology of randomly oriented lamellae was assumed to show well-dispersed TIPIs throughout the material, in a similar fashion as with very small spherulites (Fig. 10c) or a material where spherulites are absent (Fig. 10e). Thus at low T and E, the influence radius of the impurities may typically not be sufficiently large to form any percolated paths through extruded LDPE (random lamellae structure), Fig. 10c and e, due to the lower concentrations of TIPIs in the spherulite boundaries (per volume extruded material). On the other hand, when the T and/or E are increased sufficiently, percolation will also occur in the material showing random lamellae (Fig. 10d and f), as suggested in Fig. 10a. The volume of the percolating network is however much smaller in the material with large spherulites. Theoretically this is the explanation of the lower simulated conductivity for large spherulites (σ1,high) than for a random lamella (σA,high) see Fig. 10f and 9b.
The effects of aging and oxidation were also qualitatively handled in the FEM model. Since the influence radii in the vicinity of the oxidative products for the aged materials will become larger at higher temperatures and with stronger electric fields, the conductivity drop at short aging times (1–3 days) in Fig. 6b may be explained by the formation of small fractions of oxidation products (sites) acting as charge carrier capturers so that percolation is avoided. The significant increase in conductivity after longer aging may thus be due to a more extensive overlap of these numerous oxidation sites, which are consequently unable to retain the charges due to percolation. An increase in conductivity after the longest aging times (10 days) would thus be most pronounced at the highest fields (30 kV mm−1), which is in agreement with the experimental data (Fig. 6b). With vacuum drying (Fig. 6c), some of the oxidation products were evaporated and the amount of oxidation products after a particular aging time was consequently lower, suggesting that the optimal concentration was reached at a later stage, i.e. after 3–6 days. To conclude, the FEM model was able to schematically explain the experimental conductivity trends for temperature, voltage, oxidation and LDPE morphology. However, due to its simplicity it should be underlined that, although DFT simulations suggest that the main conduction occurs in the amorphous phase, conduction may well occur in the crystalline phase although its true nature is presently unknown.
4 Conclusions
A ten seconds passage of commercial polyethylene through an extruder led to a complete alteration of the spherulitic PE structure to a morphology composed of evenly dispersed randomly organized crystalline lamellae structure, while the degree of crystallinity (ca. 51%) was unchanged. The polyethylene consisting of disorganized random lamellae (8 nm), rather than organized superstructures of ca. 5 μm large spherulites of 8 nm thick lamellae, showed on average a DC conductivity four times lower at room temperature. At 40 °C, the difference in the DC conductivity disappeared and at 60 °C, the effect was reversed, showing the lowest conductivity values for the spherulitic morphologies. The phenomenon was confirmed with multiple measurements on different samples and it was suggested that the morphology alteration was due to a spreading/breaking of the nucleation sites associated with the initiation of the spherulitic crystal growth. Ageing for 1–3 days of the materials at 100 °C revealed that a small degree of oxidation resulted in a pronounced decrease in the room temperature conductivity of the LDPE, i.e. 1–2 orders of magnitude lower conductivity (1 × 10⁻¹⁸ S m−1), whereas the addition of 0.005 wt% antioxidants to the PE increased the conductivity by a factor of 3. At the same time, higher concentrations (up to 0.1 wt%) showed no further changes in the conductivity of the LDPE.The experimental findings were modelled using finite element (FEM) simulations to interpret the measured relationship between DC conductivity and polymer morphology (spherulites or randomly oriented lamellae) at different temperatures and different field strengths. A local conductivity increase in the spherulite boundary regions was presumed, due to the expelling of polymer irregularities, trace impurities and/or chemical polymer chain defects during the crystallization of the spherulites. The FEM simulations were able to qualitatively explain the experimentally observed correlations between DC conductivity, polymer morphology, temperature, field strength and oxidation. At the same time, the modelling supported the hypothesis that the DC conductivity is not controlled by the crystalline phase in the LDPE, which may however affect the conductivity indirectly by altering the amorphous phase in terms of the concentration of anomalies (TIPIs) that are expelled during the crystal growth. This hypothesis is consistent with the previously reported lower band gap DFT simulations for the amorphous phase, making it the more conductive element in the semi-crystalline LDPE.38–40 The exact mechanisms and the conductive paths in the amorphous interlayers of PE surrounding the crystalline phase remain however unknown.
Conflicts of interest
There are no conflicts to declare.Acknowledgements
This work was funded through SweGRIDS, by the Swedish Energy Agency and ABB and by the Swedish Research Council (VR 621-2014-5398).References
- L. A. Dissado and J. C. Fothergill, Electrical Degradation and Breakdown in Polymers, Peter Peregrinus Limited, 1992 Search PubMed.
- K. C. Kao, Dielectric Phenomena in Solids, Elsevier, Amsterdam, 2004 Search PubMed.
- H. Ghorbani, T. Christen, M. Carlen, E. Logakis, L. Herrmann, H. Hillborg, L. Petersson and J. Viertel, Long-term Conductivity Decrease of Polyethylene and Polypropylene Insulation Materials, IEEE Trans. Dielectr. Electr. Insul., 2017, 24(3), 1485–1493 CAS.
- E. Riande and R. Diaz-Calleja, Electrical properties of polymers, CRC Press, 2004 Search PubMed.
- A. T. Hoang, L. Pallon, D. M. Liu, Y. V. Serdyuk, S. M. Gubanski and U. W. Gedde, Charge Transport in LDPE Nanocomposites Part I-Experimental Approach, Polymers, 2016, 8(3), 87 CrossRef.
- A. T. Hoang, Y. V. Serdyuk and S. M. Gubanski, Charge Transport in LDPE Nanocomposites Part II-Computational Approach, Polymers, 2016, 8(4), 103 CrossRef.
- X. Wang, J. K. Nelson, L. S. Schadler and H. Hillborg, Mechanisms Leading to Nonlinear Electrical Response of a Nano p-SiC/Silicone Rubber Composite, IEEE Trans. Dielectr. Electr. Insul., 2010, 17(6), 1687–1696 CAS.
- F. Nilsson, M. Karlsson, L. Pallon, M. Giacinti, R. T. Olsson, D. Venturi, U. W. Gedde and M. S. Hedenqvist, Influence of water uptake on the electrical DC-conductivity of insulating LDPE/MgO nanocomposites, Compos. Sci. Technol., 2017, 152, 11–19 CrossRef CAS.
- J. C. Fothergill, The Coming of Age of HVDC Extruded Power Cables, Electrical Insulation Conference (Eic), 2014, pp. 124–137 Search PubMed.
- H. Ghorbani, A. Gustafsson, M. Saltzer and S. Alapati, Extra High Voltage DC Extruded Cable System Qualification a World Record in HVDC Cable Technology, International Conference on Condition Assessment Techniques in Electrical Systems (CATCON), 2015, pp. 236–241 Search PubMed.
- P. Bergelin, M. Jeroense, T. Quist and H. Rapp, 640 kV Extruded HVDC Cable System. Technical Paper, NKT, 2017 Search PubMed.
- G. Chen, M. Hao, Z. Q. Xu, A. Vaughan, J. Z. Cao and H. T. Wang, Review of High Voltage Direct Current Cables, CSEE J. Power Energy, 2015, 1(2), 9–21 Search PubMed.
- T. Hjertberg, V. Englund, P. Hagstrand, W. Loyens, U. Nilsson and A. Smedberg, in Materials for HVDC cables, Jicable HVDC'13, France, 2013 Search PubMed.
- A. M. Pourrahimi, R. T. Olsson and M. S. Hedenqvist, The Role of Interfaces in Polyethylene/Metal-Oxide Nanocomposites for Ultrahigh-Voltage Insulating Materials, Adv. Mater., 2018, 30(4), 1703624 CrossRef PubMed.
- A. M. Pourrahimi, T. A. Hoang, D. M. Liu, L. K. H. Pallon, S. Gubanski, R. T. Olsson, U. W. Gedde and M. S. Hedenqvist, Highly Efficient Interfaces in Nanocomposites Based on Polyethylene and ZnO Nano/Hierarchical Particles: A Novel Approach toward Ultralow Electrical Conductivity Insulations, Adv. Mater., 2016, 28(39), 8651–8657 CrossRef CAS.
- C. Muller, L. Q. Ouyang, A. Lund, K. Moth-Poulsen and M. M. Hamedi, From Single Molecules to Thin Film Electronics, Nanofibers, e-Textiles and Power Cables: Bridging Length Scales with Organic Semiconductors, Adv. Mater., 2019, 31(22), 1807286 CrossRef PubMed.
- T. Andrews, R. N. Hampton, A. Smedberg, D. Wald, V. Waschk and W. Weissenberg, The role of degassing in XLPE power cable manufacture, IEEE Electr. Insul. Mag., 2006, 22(6), 5–16 Search PubMed.
- C. D. Green, A. S. Vaughan, G. C. Stevens, A. Pye, S. J. Sutton, T. Geussens and M. J. Fairhurst, Thermoplastic Cable Insulation Comprising a Blend of Isotactic Polypropylene and a Propylene-ethylene Copolymer, IEEE Trans. Dielectr. Electr. Insul., 2015, 22(2), 639–648 CAS.
- H. Ghorbani, Characterization of conduction and polarization properties of HVDC cable XLPE insulation materials, KTH, Stockholm, 2016 Search PubMed.
- M. G. Andersson, J. Hynynen, M. R. Andersson, V. Englund, P. O. Hagstrand, T. Gkourmpis and C. Muller, Highly Insulating Polyethylene Blends for High-Voltage Direct-Current Power Cables, ACS Macro Lett., 2017, 6(2), 78–82 CrossRef CAS.
- L. Z. Li, K. Zhang, L. S. Zhong, J. H. Gao, M. Xu, G. H. Chen and M. L. Fu, Treeing phenomenon of thermoplastic polyethylene blends for recyclable cable insulation materials, AIP Adv., 2017, 7(2), 025116 CrossRef.
- K. Zhang, L. Z. Li, L. S. Zhong, L. Cao, M. Xu, G. H. Chen and M. L. Fu, DC Dielectric Properties of Thermo-plastic Polyolefin Materials, 2016 IEEE Conference on Electrical Insulation and Dielectric Phenomena (IEEE Ceidp), 2016, pp. 470–473 Search PubMed.
- L. Z. Li, L. S. Zhong, K. Zhang, J. H. Gao and M. Xu, Temperature Dependence of Mechanical, Electrical Properties and Crystal Structure of Polyethylene Blends for Cable Insulation, Materials, 2018, 11(10), 1922 CrossRef PubMed.
- C. D. Green, A. S. Vaughan, G. C. Stevens, S. J. Sutton, T. Geussens and M. J. Fairhurst, Recyclable Power Cable Comprising a Blend of Slow-crystallized Polyethylenes, IEEE Trans. Dielectr. Electr. Insul., 2013, 20(1), 1–9 CAS.
- I. L. Hosier, A. S. Vaughan and S. G. Swingler, On the effects of morphology and molecular composition on the electrical strength of polyethylene blends, J. Polym. Sci., Part B: Polym. Phys., 2000, 38(17), 2309–2322 CrossRef CAS.
- I. L. Hosier, A. S. Vaughan and S. G. Swingler, Structure-property relationships in polyethylene blends: the effect of morphology on electrical breakdown strength, J. Mater. Sci., 1997, 32(17), 4523–4531 CrossRef CAS.
- Y. Zhou, J. L. He, J. Hu, X. Y. Huang and P. K. Jiang, Evaluation of Polypropylene/Polyolefin Elastomer Blends for Potential Recyclable HVDC Cable Insulation Applications, IEEE Trans. Dielectr. Electr. Insul., 2015, 22(2), 673–681 CAS.
- M. M. Shahin, R. H. Olley and M. J. Blissett, Refinement of etching techniques to reveal lamellar profiles in polyethylene banded spherulites, J. Polym. Sci., Part B: Polym. Phys., 1999, 37(16), 2279–2286 CrossRef CAS.
- B. Wunderlich, Heat of Fusion of Polyethylene, Journal of Polymer Science Part A-2: Polymer Physics, 1967, 5, 987–988 CrossRef CAS.
- B. Wunderlich and H. Bauer, Heat Capacities of Linear High Polymers, 1970, vol. 7, p. 151 Search PubMed.
- U. W. Gedde, Polymer Physics, Chapman & Hall, London, 1995 Search PubMed.
- L. Mandelkern, M. Glotin and R. A. Benson, Super-Molecular Structure and Thermodynamic Properties of Linear and Branched Polyethylenes under Rapid Crystallization Conditions, Macromolecules, 1981, 14(1), 22–34 CrossRef CAS.
- J. Viertel, L. Petersson, A. Friberg, G. Dominguez and C. Tornkvist, Electrode Influence on DC Conductivity Measurements of Low Density Poly Ethylene, IEEE Int C Sol Diel, 2013, pp. 1048–1051 Search PubMed.
- H. Ghorbani, A. Abbasi, M. Jeroense, A. Gustafsson and M. Saltzer, Electrical Characterization of Extruded DC Cable Insulation - The Challenge of Scaling, IEEE Trans. Dielectr. Electr. Insul., 2017, 24(3), 1465–1475 CAS.
- H. Ghorbani, M. Saltzer, F. Abid and H. Edin, Effect of Heat-treatment and Sample Preparation on Physical Properties of XLPE DC Cable Insulation Material, IEEE Trans. Dielectr. Electr. Insul., 2016, 23(5), 2508–2516 CAS.
- Y. Ohki, T. Asada, Y. Umeshima and M. Ikeda, Electrical conduction in highly resistive polyolefin films modified by polar groups, Electr. Eng. Jpn., 1997, 120(3), 9–16 CrossRef.
- K. B. Chakraborty and G. Scott, Effects of Thermal Processing on Thermal Oxidative and Photooxidative Stability of Low-Density Polyethylene, Eur. Polym. J., 1977, 13(9), 731–737 CrossRef CAS.
- K. J. Less and E. G. Wilson, Intrinsic photoconduction and photoemission in polyethylene, J. Phys. C: Solid State Phys., 1973, 6, 3110 CrossRef CAS.
- A. Moyassari, M. Unge, M. S. Hedenqvist, U. W. Gedde and F. Nilsson, First-principle simulations of electronic structure in semicrystalline polyethylene, J. Chem. Phys., 2017, 146(20), 204901 CrossRef CAS.
- L. H. Chen, T. D. Huan and R. Ramprasad, Electronic Structure of Polyethylene: Role of Chemical, Morphological and Interfacial Complexity, Sci. Rep., 2017, 7, 6128 CrossRef.
- A. Moyassari, T. Gkourmpis, M. S. Hedenqvist and U. W. Gedde, Molecular Dynamics Simulations of Short-Chain Branched Bimodal Polyethylene: Topological Characteristics and Mechanical Behavior, Macromolecules, 2019, 52(3), 807–818 CrossRef CAS.
- Y. J. Lin, W. C. Du, D. M. Tu, W. Zhong and Q. G. Du, Space charge distribution and crystalline structure in low density polyethylene (LDPE) blended with high density polyethylene (HDPE), Polym. Int., 2005, 54(2), 465–470 CrossRef CAS.
- X. Li, Q. G. Du, J. Kang and D. M. Tu, Influence of microstructure on space charges of polypropylene, J. Polym. Sci., Part B: Polym. Phys., 2002, 40(4), 365–374 CrossRef CAS.
- X. Li, Y. Cao, Q. G. Du, Y. Yin and D. M. Tu, Charge distribution and crystalline structure in polyethylene nucleated with sorbitol, J. Appl. Polym. Sci., 2001, 82(3), 611–619 CrossRef CAS.
- S. N. Kolesov, The Influence of Morphology on the Electric Strength of Polymer Insulation, IEEE Trans. Electr. Insul., 1980, 15(5), 382–388 Search PubMed.
- F. Nilsson, U. W. Gedde and M. S. Hedenqvist, Penetrant diffusion in polyethylene spherulites assessed by a novel off-lattice Monte-Carlo technique, Eur. Polym. J., 2009, 45(12), 3409–3417 CrossRef CAS.
Footnote |
| † Electronic supplementary information (ESI) available. See DOI: 10.1039/c9ra09479b |
| This journal is © The Royal Society of Chemistry 2020 |

