
 Open Access Article
 This Open Access Article is licensed under a
 Creative Commons Attribution 3.0 Unported Licence
A molecular density functional theory approach to electron transfer reactions
Guillaume
Jeanmairet
 *ab,
Benjamin
Rotenberg
ab,
Maximilien
Levesque
c,
Daniel
Borgis
cd and
Mathieu
Salanne
abd
*ab,
Benjamin
Rotenberg
ab,
Maximilien
Levesque
c,
Daniel
Borgis
cd and
Mathieu
Salanne
abd
aSorbonne Université, CNRS, Physico-Chimie des Électrolytes et Nanosystèmes Interfaciaux, PHENIX, F-75005 Paris, France. E-mail: guillaume.jeanmairet@sorbonne-universite.fr
bRéseau sur le Stockage Électrochimique de l'Énergie (RS2E), FR CNRS 3459, 80039 Amiens Cedex, France
cPASTEUR, Département de chimie, École Normale Supérieure, PSL University, Sorbonne Université, CNRS, 75005 Paris, France
dMaison de la Simulation, CEA, CNRS, Université Paris-Sud, UVSQ, Université Paris-Saclay, 91191 Gif-sur-Yvette, France
First published on 12th December 2018
Abstract
Beyond the dielectric continuum description initiated by Marcus theory, the standard theoretical approach to study electron transfer (ET) reactions in solution or at interfaces is to use classical force field or ab initio molecular dynamics simulations. We present here an alternative method based on liquid-state theory, namely molecular density functional theory, which is numerically much more efficient than simulations while still retaining the molecular nature of the solvent. We begin by reformulating molecular ET theory in a density functional language and show how to compute the various observables characterizing ET reactions from an ensemble of density functional minimizations. In particular, we define within that formulation the relevant order parameter of the reaction, the so-called vertical energy gap, and determine the Marcus free energy curves of both reactant and product states along that coordinate. Important thermodynamic quantities such as the reaction free energy and the reorganization free energies follow. We assess the validity of the method by studying the model Cl0 → Cl+ and Cl0 → Cl− ET reactions in bulk water for which molecular dynamics results are available. The anionic case is found to violate the standard Marcus theory. Finally, we take advantage of the computational efficiency of the method to study the influence of a solid–solvent interface on the ET, by investigating the evolution of the reorganization free energy of the Cl0 → Cl+ reaction when the atom approaches an atomistically resolved wall.
Electron transfer (ET) reactions play a central role in a wide range of chemical systems, including energy storage and harvesting in electrochemical devices or biological processes such as aerobic respiration and photosynthesis. This ubiquity can explain the considerable amount of experimental, theoretical and simulation studies that have been devoted to this class of reactions.1 The widely accepted theory of ET reaction in solution was proposed by Marcus.2–4 It is based on the description of the solvent by a dielectric continuum. The macroscopic fluctuations of the solvent are represented by an out-of-equilibrium polarization field, and the free energy is a functional depending quadratically on this polarization. It eventually provides a simple two-state picture, where the free energy of each state depends quadratically on a reaction coordinate. This famous two-parabola picture has been used with great success to interpret experimental results and to make predictions.5 However, Marcus theory does not take into account the molecular nature of the solvent which can break the linear assumption of solvent response. In such cases, we must resort to molecular simulation.
The vast majority of simulation studies on ET reaction have been carried out using Molecular Dynamics (MD). For example, the pioneering work of Warshel demonstrated that the vertical energy gap is the appropriate reaction coordinate6 and that the fluctuations of this quantity are Gaussian. Such Gaussian statistics give rise to the famous parabola picture of Marcus for the free energy profile. A strict Gaussian behaviour is equivalent to a linear response of the solvent to the field generated by the solute; it also implies that the two free energy parabolas have the same curvature because the solvent fluctuations are identical for the two states.7,8
This validity of the Gaussian assumption has been verified in numerous studies since, for ET in solution9,10 or in complex biological systems,11,12 using either classical or ab initio MD. However, there is evidence that some systems do not obey the Marcus assumption i.e. the free energy curves of the two states cannot be represented by a pair of identical parabolas. There are several possible origins of such a discrepancy,13 in particular the fact that reactant and product may have quite different solvation states. This can happen when the ET occurs between neutral and charged states, as predicted by Kakitani and Mataga14–16 and observed since in classical17–19 and ab initio20,21 simulations. Several extensions of Marcus theory have been put forward to take into account the various origins of non-linearity.21–24
The investigation of ET reactions by MD is quite challenging since it usually requires the computation of the free energy curves as a function of an order parameter which remains a demanding task. Indeed, it necessitates a proper sampling of the solvent configurations around the barrier. If the activation energy is high it requires the use of biases such as umbrella sampling25 coupled with histogram analysis techniques to reconstruct the unbiased data.26–28 This typically implies to run simulations on half a dozen fictitious intermediate states to study a single system.
To compute free energies, there exist alternative techniques based on statistical theory of liquids, which offer the advantage of keeping a molecular description of the solvent while avoiding to sample the instantaneous microscopic degrees of freedom. Among the different approaches one can mention integral equation theory either in its molecular29 or multiple sites formulation (RISM)30,31 and its 3D-RISM version.32,33 Another method is the classical density functional theory (cDFT) of liquids34,35 which describes the response of a fluid in the presence of a perturbation by introducing a functional of the fluid density. Minimization of the functional yields the grand potential at equilibrium fluid density. Some of us have previously introduced the molecular density functional theory (MDFT)36,37 which is able to provide the solvation free energy and the solvation structure of any solute embedded in a molecular solvent described by its inhomogeneous density field. The solvent density is a function of space coordinates and of the orientation; hence the functional must be minimized on a 6D grid: 3 dimensions for the cartesian coordinates and 3 dimensions for the three Euler angles. This formalism can be used to solvate any simple or complex solutes.38 We proposed functionals for several solvents39,40 with particular attention paid to the case of water.41,42 The most advanced version of the functional is equivalent to the molecular Ornstein–Zernike theory supplemented by the hypernetted-chain closure (HNC)43 for the solute–solvent correlations and can be minimized efficiently thanks to the use of rotational invariants in an optimal frame. The accuracy on the predictions of solvation free energies is promising as illustrated on the FreeSolv database.44 We shall take advantage of this accuracy to put forward an efficient way to compute the free energy curves.
An application of the MDFT formalism to ET reactions in acetonitrile was proposed some years ago.39 In this article we extend this approach and apply it to ET in aqueous solutions. In Section 1, after recalling some basics of ET theory and giving a very short description of the MDFT framework, we show how to compute the key quantities of ET reactions with MDFT. In particular, we show that the average vertical energy gap is an appropriate order parameter for the ET reaction. We prove that for a given set of external potentials the free energy functional is actually a function of this order parameter. We derive expressions to compute the free energy curves (FEC) and the reorganization free energies.
In Section 2 we first validate the framework on the simplest solute in water, i.e. a single neutral or charged chlorine atom modeled by a Lennard-Jones site, before studying the influence of the presence of a solid-solvent interface on the reorganization free energy; to this purpose we investigate the ET of this solute as a function of its distance to an atomistically resolved wall.
1 Theory
1.1 Electron transfer reaction
We limit ourselves to the study of ET reactions of solutes which interact with the solvent through a classical force field. Moreover, the solutes we consider in this article are rigid entities composed of a set of Lennard-Jones sites and point charges. An ET reaction involving two solutes of this type would correspond to an outer-sphere ET because there are no structural changes of the solutes. This implies that the ET reaction is completely controlled by the solvent response, as considered in Marcus' original paper.3 The physics of the system can be described by the two crossing free energy curves of the system before (0) and after (1) the ET. A schematic view of the two FEC is presented in Fig. 1 where some of the quantities necessary to describe the process are shown. The order parameter x describes the solvent configuration around the solute, thus the abscissa x0 of the minimum of the FEC W0 corresponds to a solvent in equilibrium with state 0. We emphasize that several microscopic solvent configurations correspond to an identical value of the order parameter.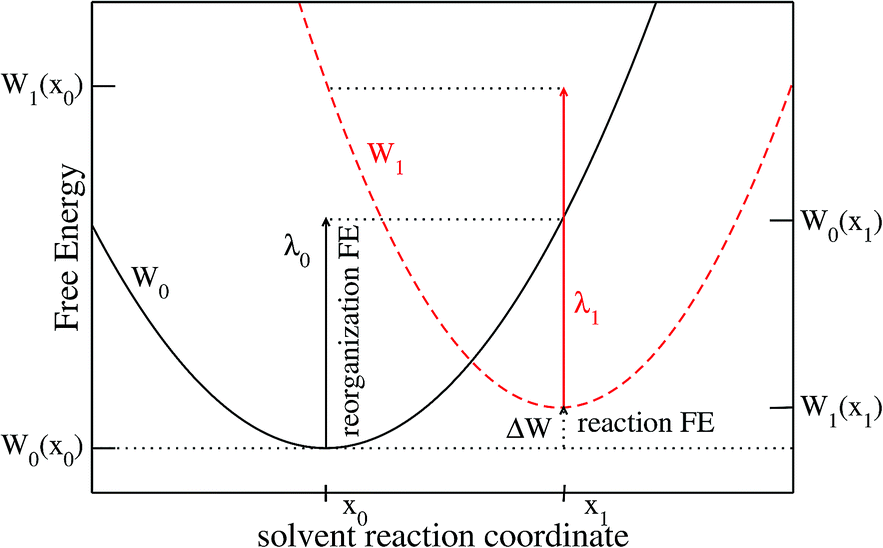 | ||
| Fig. 1 Schematic representation of a solvent controlled ET reaction. The diabatic free energy curves for state 0 and 1 are represented in solid black and dashed red, respectively. The reorganization free energies λ0 and λ1 for the two states are represented with solid arrows, the reaction free energy with a dotted arrow. | ||
Values of the order parameter differing from x0 correspond to solvent configurations that are not in equilibrium with state 0. The more the solvent configuration differs from equilibrium, the more the free energy increases. The difference between the minima of the 2 FEC corresponds to the free energy difference between the two states, each surrounded by a solvent in equilibrium with these states, i.e. the reaction free energy, ΔW. Two others key quantities appear in Fig. 1: the reorganization free energies λ0 (resp. λ1) which represent the cost in free energy to solvate state 0 (resp. 1) in a solvent in equilibrium with the other state. The difference in free energy between the transition state (the crossing point) and state 0 controls the kinetics of the 0 → 1 reaction.
We emphasize that in the Marcus picture, the solvent is treated as a continuum which responds linearly to the electric field generated by the solute. This implies that the FEC of the 2 states are identical parabolas. As a consequence, there is a unique reorganization free energy parameter λ = λ0 = λ1. The objective of the present paper is to show how to compute the various quantities appearing in Fig. 1, within MDFT. This could be a way to test the validity of Marcus assumption when the molecular nature of the solvent is taken into account, while taking advantage of the numerical efficiency of MDFT compared to MD.
1.2 Molecular density functional theory
We briefly recall the fundamentals of MDFT which belong to the more general class of cDFT. Based on the Hohenberg–Kohn ansatz,45 Mermin introduced the framework of density functional theory (DFT) at finite temperature for the inhomogeneous electron gas.34 Later, Evans rewrote the theory for a classical system, setting the foundations of cDFT which describes the response of a fluid to an external perturbation.35MDFT is designed to study solvation problems. The fluid perturbed by the presence of one or several solutes is described by its density field. In the following we will always consider liquids, referred to as the solvent. It is advantageous to define a new functional F, as the difference between the grand potential functional of the solvent in the presence of the solute Θ and that of the homogeneous solvent,
| F[ρ] = Θ[ρ] − ΘH. | (1) |
With this definition, the functional at its minimum is equal to the solvation free energy. Because both the solute and the solvent are in most cases molecules with several atomic sites, their interactions depend on both the position of the centres of mass (CM) and orientations. Hence, the solvent density will be denoted by ρ(r,Ω) where r is the position in cartesian coordinates and Ω the orientation described by three Euler angles (θ,ϕ,ψ). The density minimizing the functional is the full equilibrium solvent density around the solute which may be integrated to recover the usual radial distribution functions.
The usual strategy to have a workable expression of this functional is to split it into the sum of ideal, excess and external contributions,
| F[ρ] = Fid[ρ] + Fext[ρ] + Fexactexc[ρ]. | (2) |
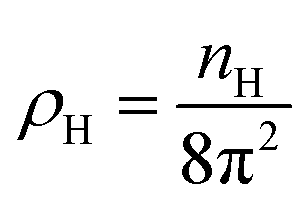
In eqn (2) the ideal term corresponds to the entropy of the non-interacting fluid, which reads
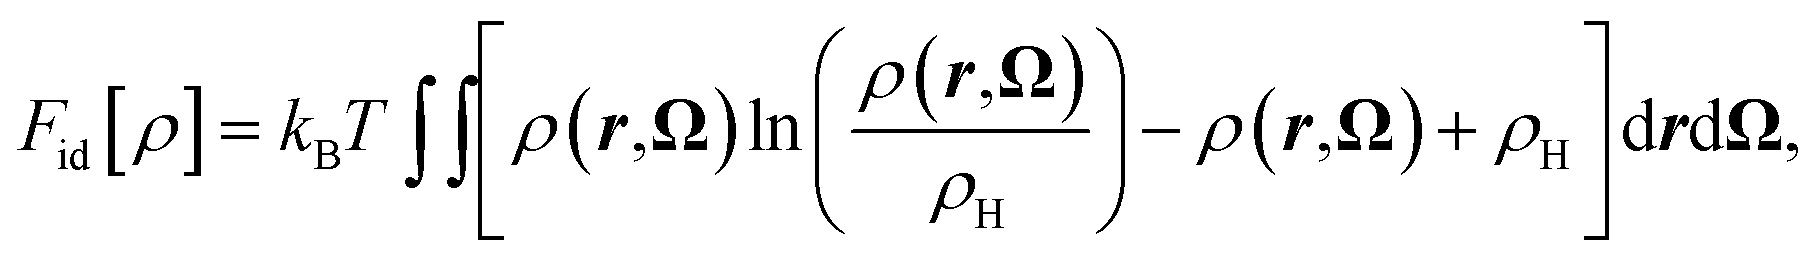 | (3) |
 with nH the density of the homogeneous solvent. The second term in eqn (2) account for the perturbation by the solute. The solute acts on the solvent via an ”external” potential Vext, typically the sum of a Lennard-Jones term and of an electrostatic term. In the usual case of pair-wise additive interaction, Vext reads
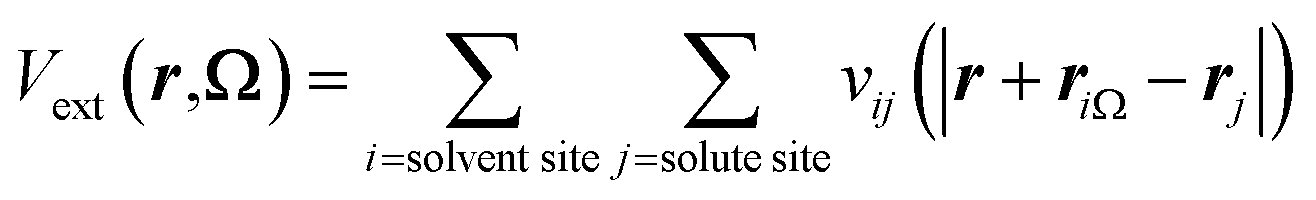 | (4) |
 | (5) |
Finally, the last term corresponds to the solvent–solvent interactions. An exact expression for this term is available46 but in practice it is rewritten as the sum of two terms
| Fexactexc[ρ] = Fexc[ρ] + Fb[ρ], | (6) |
 | (7) |
We have previously developed several approximations for the bridge term Fb51–53 but we shall neglect it in this paper and refer to this functional formulation as the HNC functional. While the numerical problem involved in MD is the sampling of phase space, MDFT involves an optimization which is numerically more efficient. Consequently, to compute solvation free energies of a spherical solute in water, MDFT requires ≈10 cpu minutes with our lab-developed program while it requires ≈100 cpu hours to compute the same quantity with commercially available MD codes.
1.3 ET reaction in the MDFT framework
| ΔW = F1[ρ1] − F0[ρ0] + ΔE0. | (8) |
The first two terms represent the solvent contribution to the free energy while ΔE0 is the difference in energy between the 2 solutes in vacuum. In this paper we restrict the study to rigid classical solutes with no intramolecular potentials, so that last term vanishes.
In his original work, Marcus estimated the free energy cost to solvate a solute within a solvent where polarization is not in equilibrium with the electric field generated by the solute. In the MDFT framework the density field contains all the structural equilibrium information of the solvent, including its polarization. We can consider MDFT as a more general field theory than that used by Marcus. Nevertheless, the density field itself remains a complicated object. To facilitate our understanding it is useful to define a solvent reaction coordinate i.e. a scalar quantity which is uniquely defined by the density field. By introducing a class of intermediate potentials interpolating between state 0 and state 1, we show that the average vertical energy gap is an appropriate order parameter. We then derive an expression for the free energies of states 0 and 1 as functions of the average vertical energy gap.
States 0 and 1 are characterized by the following Hamiltonian
| Hη = K + U + Vη. | (9) |
| fη(XN,pN) = Ξη−1exp[−β(Hη(XN,pN) − μN)], | (10) |
| Ξη = Tr[exp(−β(Hη − μN))], | (11) |
 | (12) |
| Vη = V0 + η(V1 − V0) with η ∈ [0,1]. | (13) |
This defines the corresponding set of Hamiltonians (eqn (9)), probability distributions (eqn (10)) and grand partition functions (eqn (11)) for any value of η. Since for physically relevant cases V0 and V1 differ by more than a constant, any value of η defines a unique potential Vη (up to an irrelevant constant). Because of this uniqueness of the potential, a unique equilibrium solvent density ρη is associated with any value of η. This is a consequence of the cDFT principle35 which implies a one-to-one mapping between external potential, equilibrium distribution and equilibrium solvent density.†
We define the average vertical energy gap, related to an equilibrium density ρη by
 | (14) |
This quantity represents the energy difference between states 1 and 0 solvated in the solvent of density ρη. We prove in Appendix A that, for the family of potentials in eqn (13), 〈ΔE〉η is an adequate order parameter since it uniquely defines ρη. Thus, the free energy of any state is a function of 〈ΔE〉η. For instance, for state 0 it reduces to
| F0(〈ΔE〉η) ≡ F0[ρη]. | (15) |
Note that the average free energy gap defined in eqn (14) differs from the microscopic version, ΔE, used in MD;
| ΔE({R}) = E1({R}) − E0({R}), | (16) |
| 〈ΔE({R})〉η = 〈ΔE〉η, | (17) |
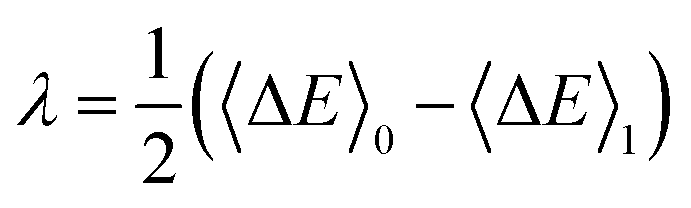
We can now express the reorganization free energies displayed in Fig. 1 as
| λ0 = F0(〈ΔE〉1) − F0(〈ΔE〉0) = F0[ρ1] − F0[ρ0] = ΔW − 〈ΔE〉1, | (18) |
| λ1 = F1(〈ΔE〉0) − F1(〈ΔE〉1) = F1[ρ0] − F1[ρ1] = −ΔW + 〈ΔE〉2. | (19) |
Borgis and coworkers have reported a similar relation to compute the reorganization free energies using MDFT.39 Under the assumption that Marcus theory is valid - hence that the two reorganizations free energies are equal, i.e. λ = λ0 = λ1, eqn (18) and (19) reduce to:
 | (20) |
 often used in molecular simulations. We also note that, as for the usual variable ΔE in MD, the exact relation introduced by Warshel is satisfied:
| F1(〈ΔE〉η) = F0(〈ΔE〉η) + 〈ΔE〉η. | (21) |
This is a corollary of eqn (34) with η = 1. In the next subsection we explain how the average vertical energy gap, reorganization free energies and free energy curves are computed using MDFT.
As shown above, the free energies corresponding to these values of the energy gaps are
| FA(〈ΔE〉η) = FA[ρη] | (22) |
An alternative route to compute the FEC was previously proposed by Hirata et al.55,56 using another implicit solvent method, RISM. We show in Appendix C that the thermodynamic cycle they propose is equivalent to the present scheme, although not expressed in a free energy density functional language. Now that we have shown how MDFT can be used to investigate ET reactions, the following section is dedicated to assess the validity of this approach on simple and complex solutes.
2 Applications
2.1 ET between Cl0, Cl+ and Cl− ions
In this article we focus on the difficult case of aqueous solvation, but calculation for simpler solvents such as acetonitrile or CO2 are expected to give results of comparable quality. We apply the necessary correction due to periodic boundary conditions to charged solutes57,58 and an additional correction accounting for the overestimation of the pressure within HNC53 to both neutral and charged solutes.To allow comparisons, we chose a system which has been extensively studied using MD by Hartnig et al.19 This model of chlorine consists of one Lennard-Jones site, with σ = 4.404 Å and ε = 0.4190 kJ mol−1, and a charge equal to −1, 0 or 1 elementary charges e. To compute the FEC of the atom and the 2 ions with a good accuracy we ran MDFT calculations with a solute charge varying in steps of 0.1 elementary charges. We used a 40 × 40 × 40 Å3 box with 1203 spatial grid points and 196 possible orientations per spatial point. The solvent is SPC/E water for which the exact direct correlation function projected on a basis of rotational invariants was obtained by Belloni et al. using a hybrid Monte Carlo plus integral equation approach.59–61 All simulations are carried out at 298.15 K.
The FEC are shown in Fig. 2 which compares the MDFT results (solid lines) to the MD results19 (symbols). The representation adopted here differs from that used by Hartnig and Koper, since we report the FEC as a function of the vertical energy gap and do not apply an arbitrary vertical shift of the curves. The methodology used to plot the MD data in this representation is described in Appendix D. This representation is better suited to highlight some features of the ET. For instance, we note that both pairs of FEC cross when the average free energy gap is equal to 0, as expected.
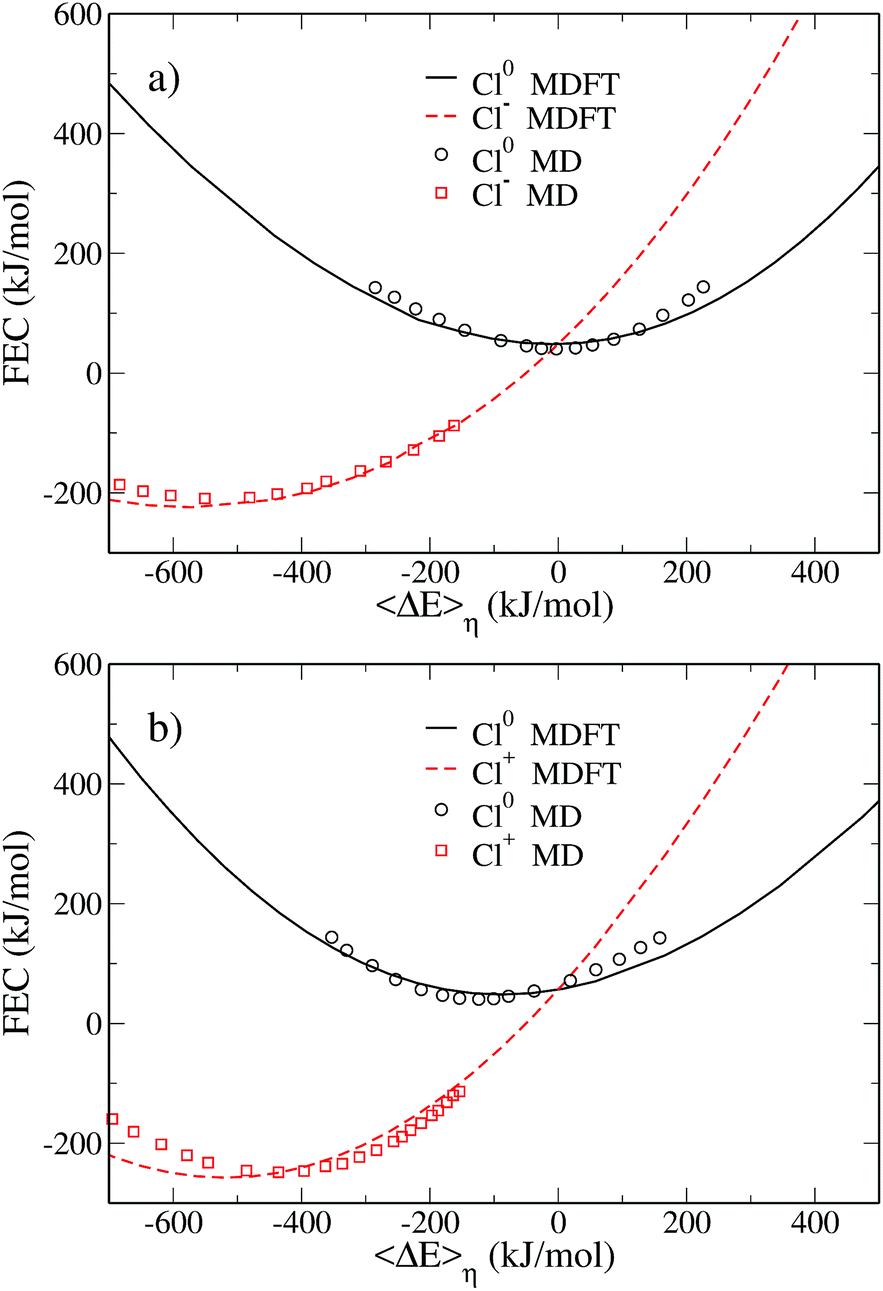 | ||
| Fig. 2 Pairs of free energy curves of (a) Cl0/Cl− and (b) Cl0/Cl+ as a function of the average vertical energy gap. The black solid line and the dashed red line correspond to the MDFT results for the atom and the ions, respectively. Those results are compared to Hartnig's work19 reported as a function of the absolute vertical energy gap. The black circles correspond to the atom and the red squares to the ions. | ||
The agreement between MD and MDFT is satisfactory, the main difference being a shift of the MDFT curves towards negative values of 〈ΔE〉η for the cation. The most interesting observation from Fig. 2 is the consistency between the curvature obtained by MD and by MDFT. In particular, Cl0 and Cl+ exhibit a similar curvature while that of Cl− is larger, indicating that the neutral to anion ET does not follow the Marcus picture while the neutral to cation ET does. To be more quantitative, we computed the reorganization free energy associated with the three species, based on the curvature by fitting the data within 90 kJ mol−1 from the minimum with the following expression
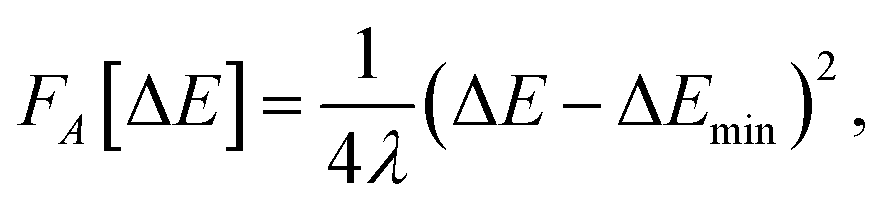 | (23) |
The reorganization free energies obtained via MDFT and MD are compared in Table 1. For the MD data, we report the values of the free energies given in the original work, in addition to the one we have recomputed to keep the fitting procedure consistent between the two approaches. MDFT overestimates the reorganization free energies compared to MD. However, comparing the values of the reorganization free energies between species leads to conclusions similar to those concerning the curvature of the FEC. The neutral atom and the cation have a similar reorganization free energy, while the anion has a much larger one.
| Species | λ MDFT (kJ mol−1) | λ MD (kJ mol−1) |
|---|---|---|
| Cl0 | 233 | 153 (132) |
| Cl− | 297 | 263 (252) |
| Cl+ | 216 | 165 (177) |
The simple picture emerging from the comparison of curvatures is however misleading. Table 1 suggests that a single reorganization free energy can be associated with each solute, but this does not hold for several reasons: (i) it assumes that the FEC of a solute is a parabola (ii) it neglects the other solutes involved in the ET. We should refer to the reorganization free energy for a given 0 → 1 ET reaction as defined in Fig. 1, because the meaningful physical quantity is a free energy, not the curvature of a fitting curve. To illustrate this point, we report in Table 2 the reorganization free energies computed using eqn (18) and (19). These free energies for the Cl0 → Cl+ reaction are almost identical to those reported in Table 1. This is consistent with the Marcus picture: if the two FEC are identical parabolas, there is a unique λ parameter defining the curvature and the two free energy differences. However, in the Cl0 → Cl− ET reaction the reorganization free energy of state 0 is much larger than in the other ET reaction. This is a consequence of the larger curvature of the second state. The reorganization free energy of Cl− is significantly reduced compared to those listed in Table 1, another consequence of the smaller curvature of state 0.
| Species | Cl0/Cl− (kJ mol−1) | Cl0/Cl+ (kJ mol−1) |
|---|---|---|
| Cl0 | 297 | 214 |
| Cl− | 264 | N/A |
| Cl+ | N/A | 218 |
This difference between the reorganization free energies is a further indication that the 0 → −1 ET does not follow Marcus theory.
Another way to check if the ET reaction follows the Marcus picture is to consider the evolution of the average vertical energy gap 〈ΔE〉η with the parameter η. As mentioned earlier, such a curve is linear in Marcus theory. The evolution of the average vertical energy gap with η is presented in Fig. 3. For the neutral to positive charge transfer, the vertical energy gap does vary linearly with the coupling parameter η. In contrast, for the neutral to anion ET a non-linear variation is observed indicating a deviation from Marcus theory.
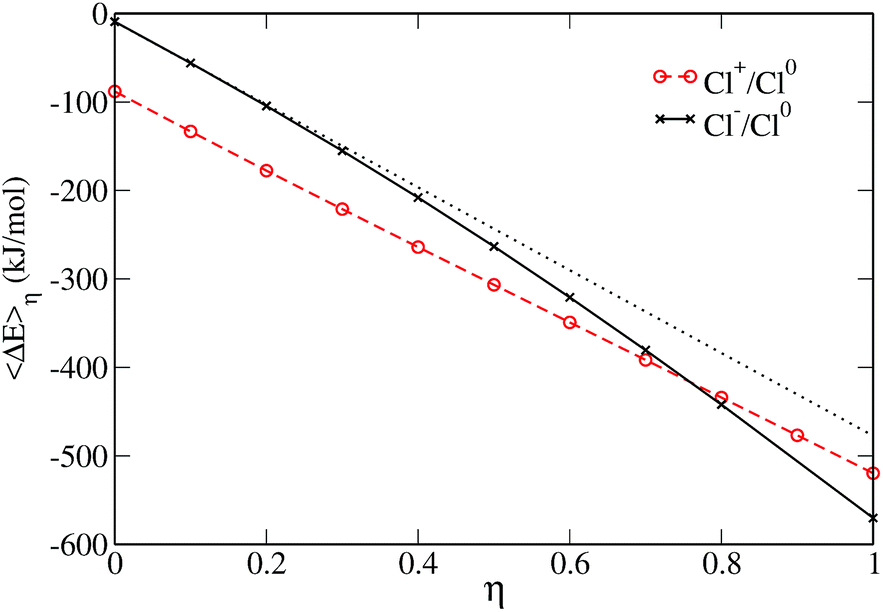 | ||
| Fig. 3 Average value of the vertical energy gap versus the coupling parameter η. The Cl0 → Cl− ET reaction is shown in solid black, the Cl0 → Cl+ in dashed red. The dotted curve is a linear fit to the first values of vertical energy gap in the case of the ET reaction involving the anion, it is shown as a guide to the eye. | ||
Thus, the curvatures of the FEC, the values of the reorganization free energies and the variation of 〈ΔE〉η with respect to η consistently indicate a different behavior for the two ET reactions. This has already been noticed by Hartnig et al., who rationalized this observation by arguing that while the distance between the solute and the oxygen of the first solvation layer remains similar for all oxidation numbers, the hydrogen is much closer to the solute in the case of the anion. This causes a “shrinking” of the first solvation shell in the case of Cl− which differs considerably from the solvation shell of the neutral and positive solutes. Such a difference in the solvation shells of the two species cannot be properly captured by linear response assumed in Marcus theory.
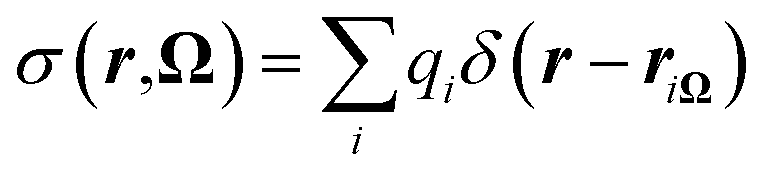
Since MDFT gives access to the solvent density, we can also investigate the solvation structure. We compute the solvent charge density
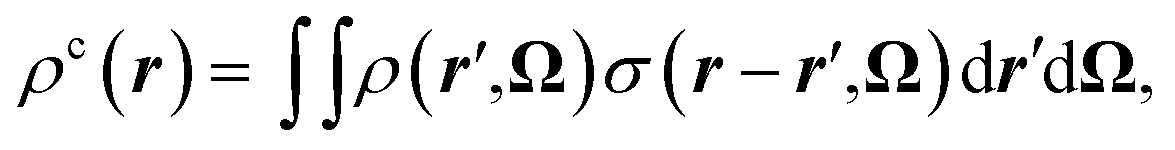 | (24) |
 | (25) |
 | ||
| Fig. 4 Spherically averaged solvent charge density as a function of the distance to the solute. The curve corresponding to the neutral solute is in solid black, the one of the cation is in dashed red and the one of the anion in dotted blue. | ||
If we first consider the neutral and positive solutes, we observe in Fig. 4 that the preferential orientation of water in the first solvation shell reverses between the neutral solute and the cation. Around the cation, the water molecules in the first solvation shell have their oxygen pointing toward the solute. For the neutral species the hydrogen of water molecules are the closest to the solute. However the positions of the first extrema are similar, 5.9 Å for Cl0, 6.3 Å for Cl+. This indicates that the two solvation shells essentially differ by the orientation of the water molecules. On the contrary, solvent molecules are much closer to the anion, where the first maximum originating from hydrogen is located at 4.3 Å. There is a shrinking of the first solvation shell for the anion, in agreement with Hartnig et al.19 It is confirmed by the comparison of the partial molar volume computed thanks to the equilibrium densities, namely 60 Å3 for Cl0 and Cl+ and 6 Å3 for Cl−. This difference in the solvation shell explains why Marcus theory fails to describe this ET reaction.
2.2 Solid/solvent interface
We now turn to the study of the influence of a solid/solvent interface on the ET reaction. There are only few such studies available due to the computational cost of MD which is to date the only simulation tool used in this context. It is worth mentioning the investigations by Remsing et al.62 who used MD and by Li et al.18 based on coarse grained MD. In the former, ions are highly confined between two MnO2 sheets and confinement is kept constant throughout the study. In the ESI of Li's paper, the authors report the evolution of the reorganization free energy when the ion moves towards graphite sheets. They used umbrella sampling to constrain the position of the redox active site in the direction z perpendicular to the surface but no constraint was applied on the lateral coordinates. The dependence of the reorganization free-energy on the distance between solute and electrode was subsequently obtained through binning in the z-direction. In this set-up the position of the solute is not frozen but may fluctuate around value of z under consideration, taking all possible values in x and y. The reported reorganization free energy is hence a statistical average.The computational efficiency of MDFT allows a systematic study of the evolution of the reorganization free energy when the solute carrying the charge approaches an atomistically resolved wall. Because the solute is kept fixed in the MDFT calculation it is not necessary to resort to biasing techniques to constrain its position and no fluctuations blur the reorganization free energies. We consider the Cl0 → Cl+ ET with the parameters introduced in Section 2.1 and study the influence of the proximity of a wall made up of 400 atoms arranged as the (100) surface of a fcc crystal. The size of the wall is 40 × 40 Å2 and the distance between neighbouring atoms is 2 Å. Each atom is modeled by a Lennard-Jones site with parameters σ = 3.37 Å and ε = 0.23 kJ mol−1 similar to that used to model graphite atoms in previous studies.63 To study separately the effect of the solvent on the ET we remove direct interactions between the solute and the wall. We used a 40 × 40 × 40 Å3 cubic box with 3 grid points per Å and 196 discrete orientations per grid point.
We move the solute along the z axis perpendicular to the surface as illustrated in Fig. 5, with 175 calculations from z = 2.5 Å to z = 20 Å in steps of dz = 0.1 Å. The reorganization free energies of the Cl0 → Cl+ ET computed using eqn (18) are displayed in panel a) of Fig. 6 in solid black for the charged solute and in dashed red for the neutral solute. The two curves are similar and differ by less than 3 kJ mol−1. This is a small difference consistent with the result of Li et al.18 who reported that the ET of an iron atom dissolved in an ionic liquid next to a polarizable planar electrode follows Marcus' scenario.
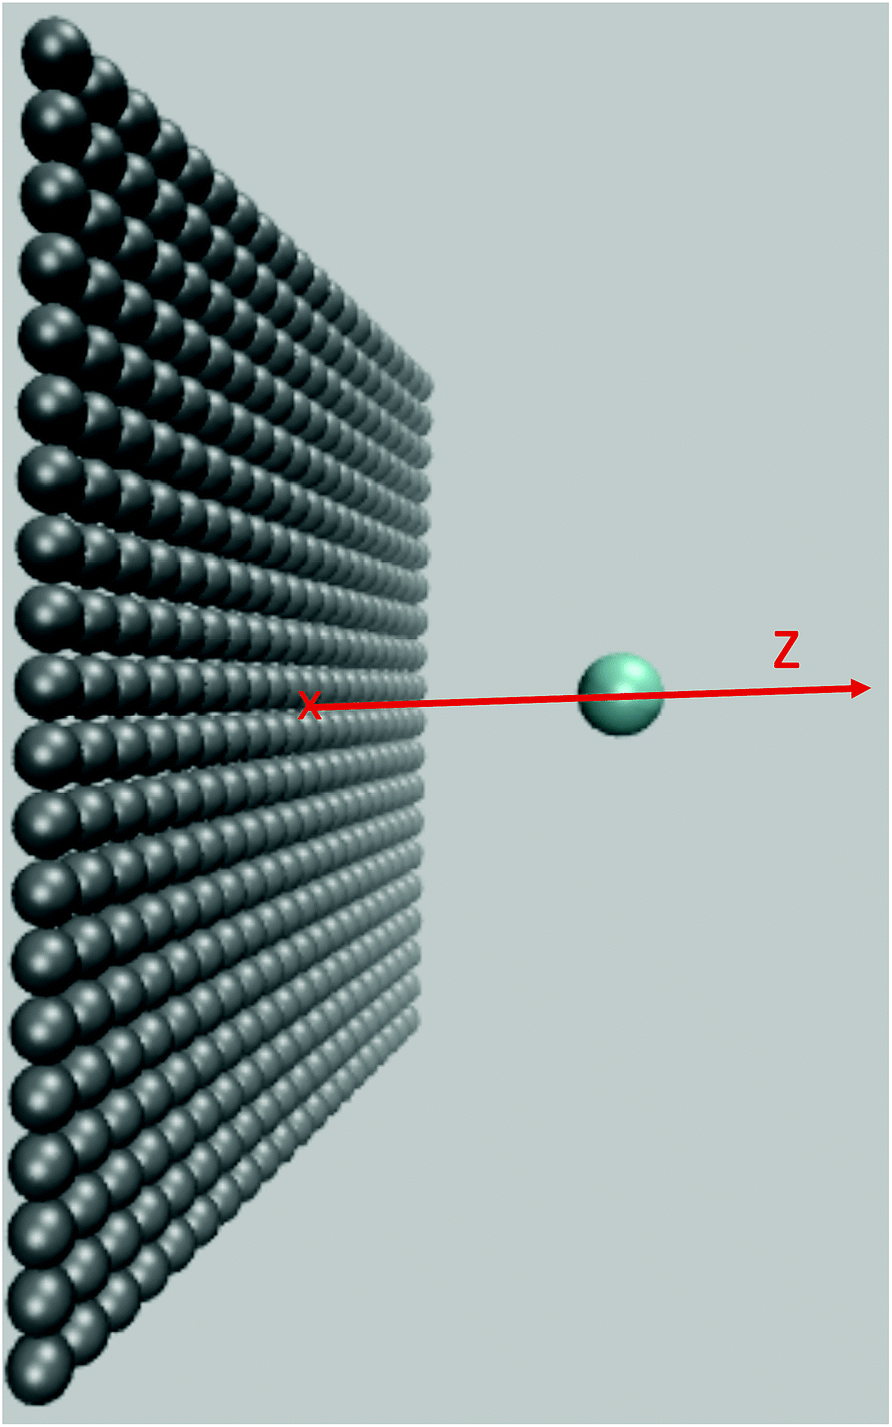 | ||
| Fig. 5 Snapshot of system under consideration: the flat wall is shown in grey, the solute in blue. The solute is moved along the z direction perpendicular to the wall. | ||
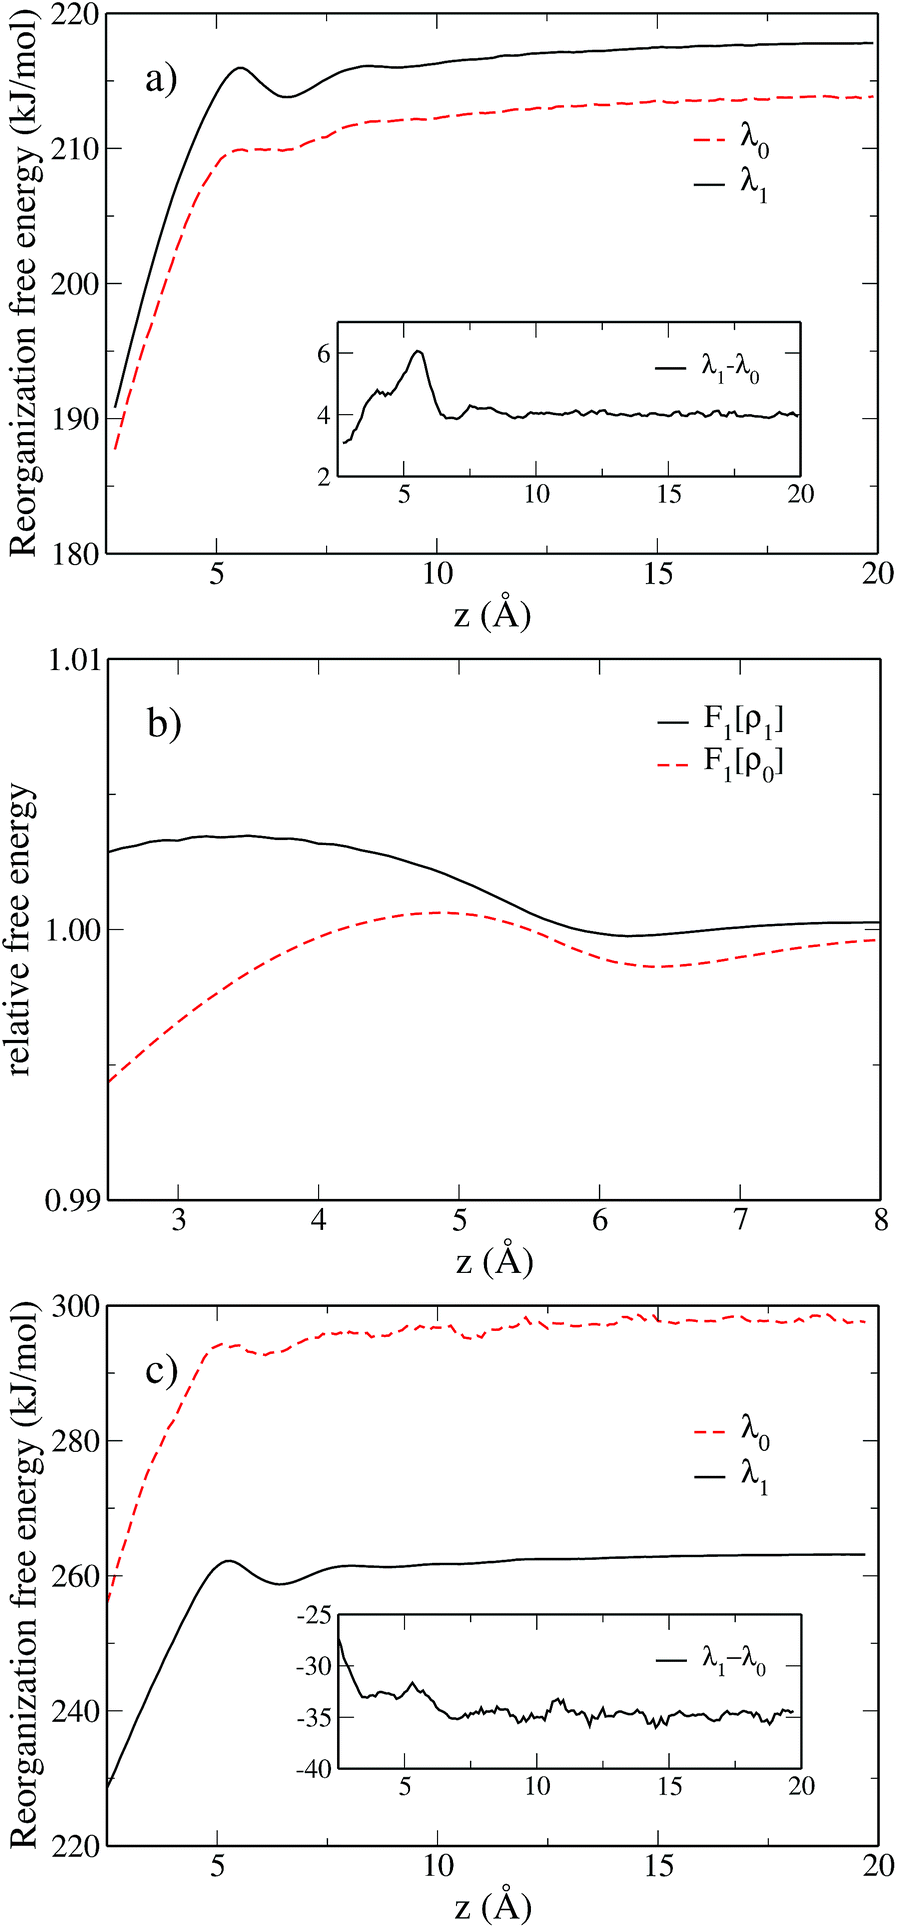 | ||
| Fig. 6 (a) Variation of the reorganization free energy for the Cl0 → Cl+ ET with the distance between the solute and the wall. The curve corresponding to the neutral state is displayed in dashed red, the one for the charged solute in solid black. The difference between λ1 and λ0 is shown in the inset. (b) Zoom on the two components F1[ρ0] and F1[ρ1] of λ1 for the Cl0 → Cl+ ET, the two quantities have been normalized by their bulk value to assist visualization. (c) Same as plot (a) for the Cl0 → Cl− ET. | ||
We observe a decrease in the reorganization free energy as the solute approaches the plane. We can rationalize this observation by realizing that the wall truncates the solvation shell around the solute. This effect is illustrated in Fig. 7 which shows slices of the density profile around the neutral (left column) and charged (right column) solutes for different values of z. As the solute approaches the wall, there are fewer solvent molecules to rearrange when passing from one equilibrium solvation state to the other. This reduces the cost of the reorganization and explains the decrease of the free energy curves for small z. In the limit of total confinement the reorganization free energy would vanish. The upper panel of Fig. 6 shows that reorganization free energy of the charged solute exhibits a maximum around 5.5 Å. We rationalize this effect by decomposing λ1 into its components F1[ρ1] and F1[ρ0] in the lower panel of Fig. 6. While F1[ρ0] exhibits a marked maximum around 5 Å, F1[ρ1] has a maximum around 3.4 Å which is flatter. Their difference consequently gives rise to the oscillatory behavior of λ1 around 5.5 Å.
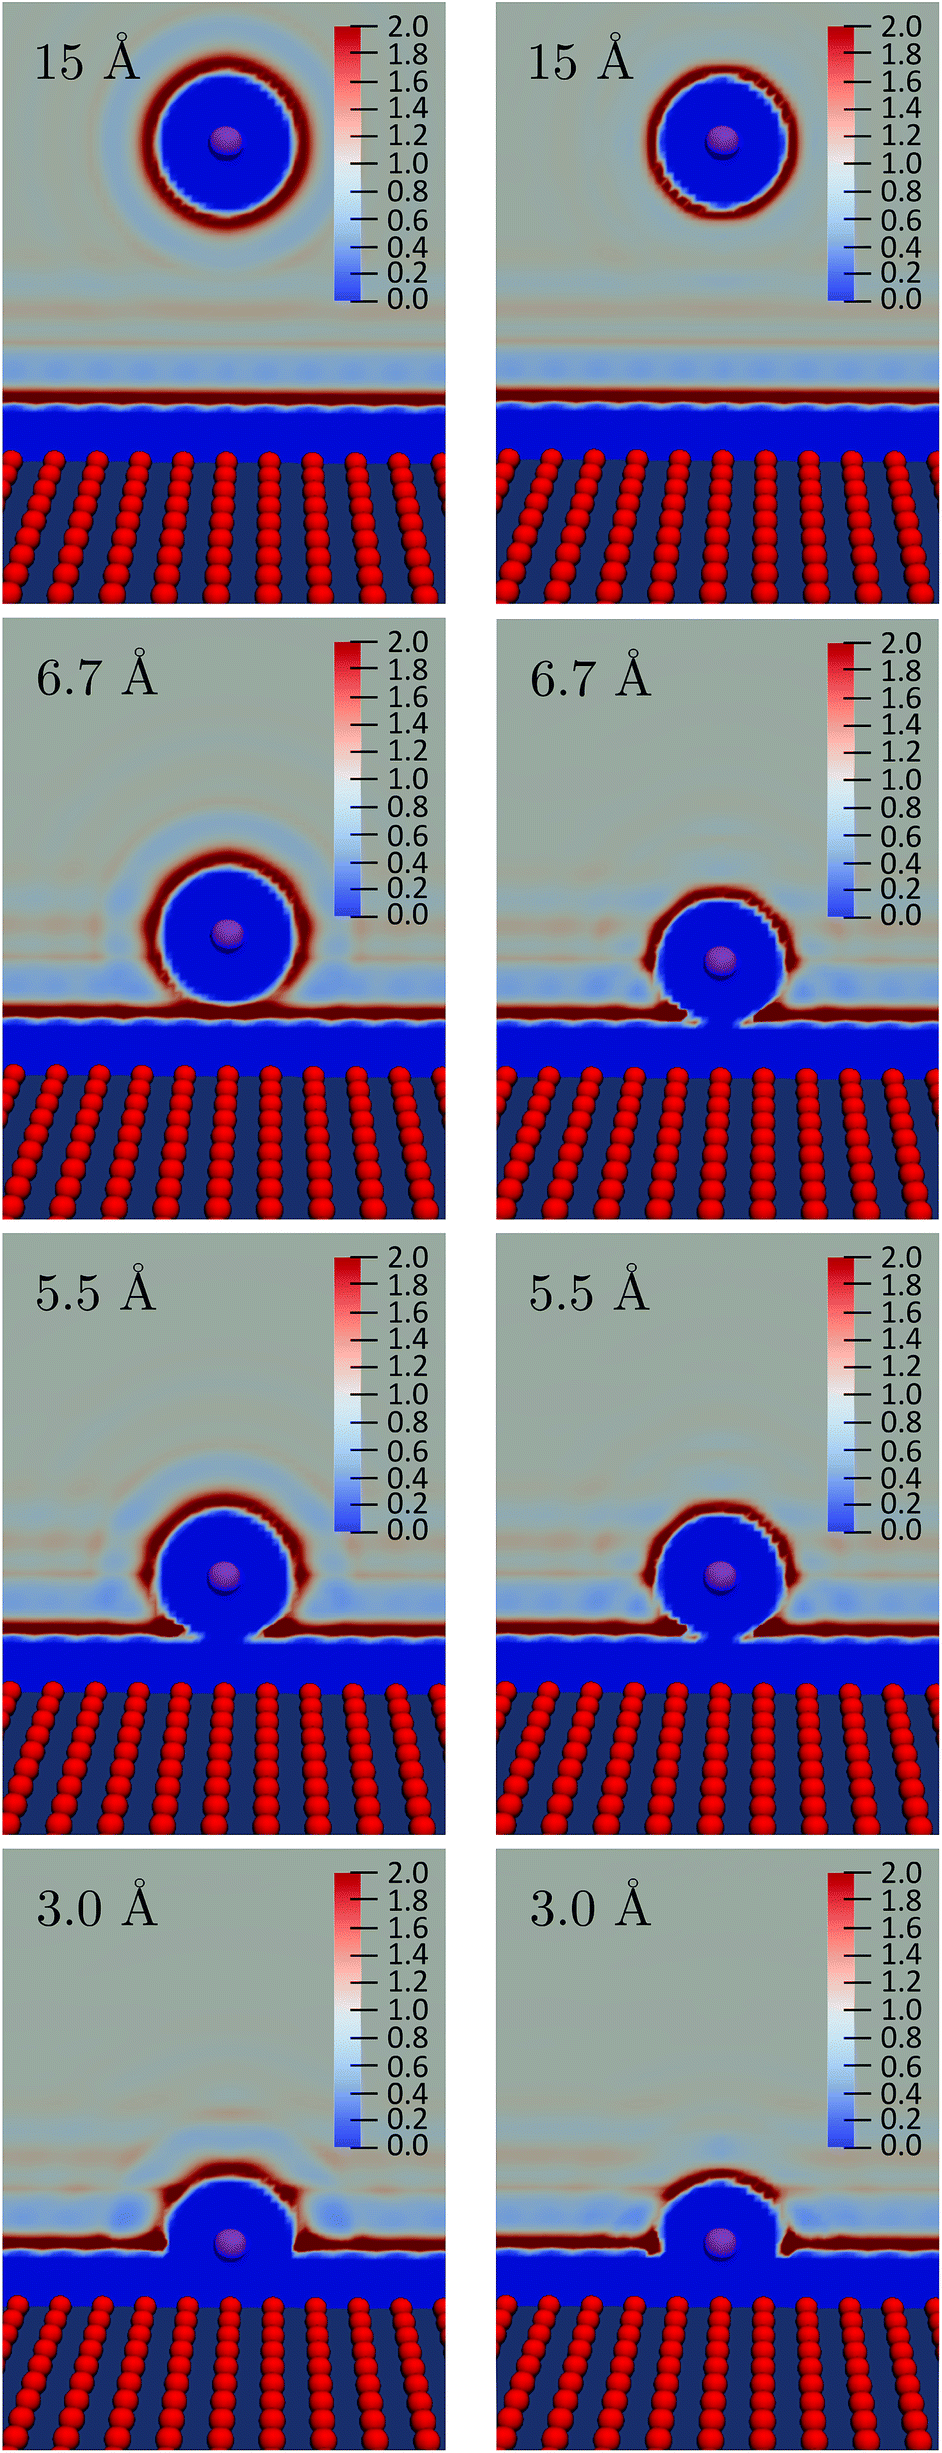 | ||
| Fig. 7 Slices of the solvent density for various values of the distance z from the wall. The neutral solute data are shown is in the left-hand column, while the cation data are shown in the right-hand column. | ||
The first solvation shell of the neutral solute at 5.5 Å is in contact with the first fluid layer adsorbed on the wall. When the solute gets closer, the solvation shell is reduced. This reduces the unfavorable electrostatic term. It also decreases the cavity term which measures the cost of expelling the solvent from the region around the solute. This explains the maximum of F1[ρ0]. Considering the density for the charged solute, the “contact” between the solvation shell of the solute and the fluid layer adsorbed on the wall is also found around 5.5 Å. However, for the cation the truncation of the solvation shell decreases both the favorable electrostatic term and the unfavorable cavity term. This could explain why F1[ρ1] is rather flat compared to F0[ρ1] and why the position of the maximum is shifted to the left. For z > 10 Å, the reorganization free energies reach a plateau corresponding to the bulk value of Table 2.
The inset of panel (a) shows the difference between λ1 and λ0 for the for the Cl0 → Cl+ ET, it presents a maximum at 5.5 Å, i.e. where the reorganization free energies also have a maximum. The difference never exceeds 6 kJ mol−1, so that Marcus' hypothesis is satisfied at all distances. This is clearly not the case for the Cl0 → Cl− ET. Indeed, far from the wall λ0 and λ1 differ by 34 kJ mol−1 as reported in Table 2. However when the solute approaches the wall, this difference is reduced, indicating a decrease of the deviation the from linear response approximation. Again, this can be rationalized by the truncation of the solvation shell.
To illustrate the numerical efficiency of the method, we also computed the FEC for various positions: z = 3.0 Å is in the region where the reorganization free energy decreases, z = 5.5 Å and z = 6.7 Å correspond to the first maximum and subsequent local minimum in Fig. 6. The FEC for the atom and cation are presented in Fig. 8. Each pair of curves cross at a point of vanishing vertical energy gap, as expected. When the solute gets close to the wall the minimum of the cation FEC is shifted towards positive values, which is consistent with the above-mentioned truncation of the solvation shell. Finally, the parabolas corresponding to z = 3.0 Å are wider than those for higher values of z, which is consistent with the smaller value of λ close to the wall reported in Fig. 6.
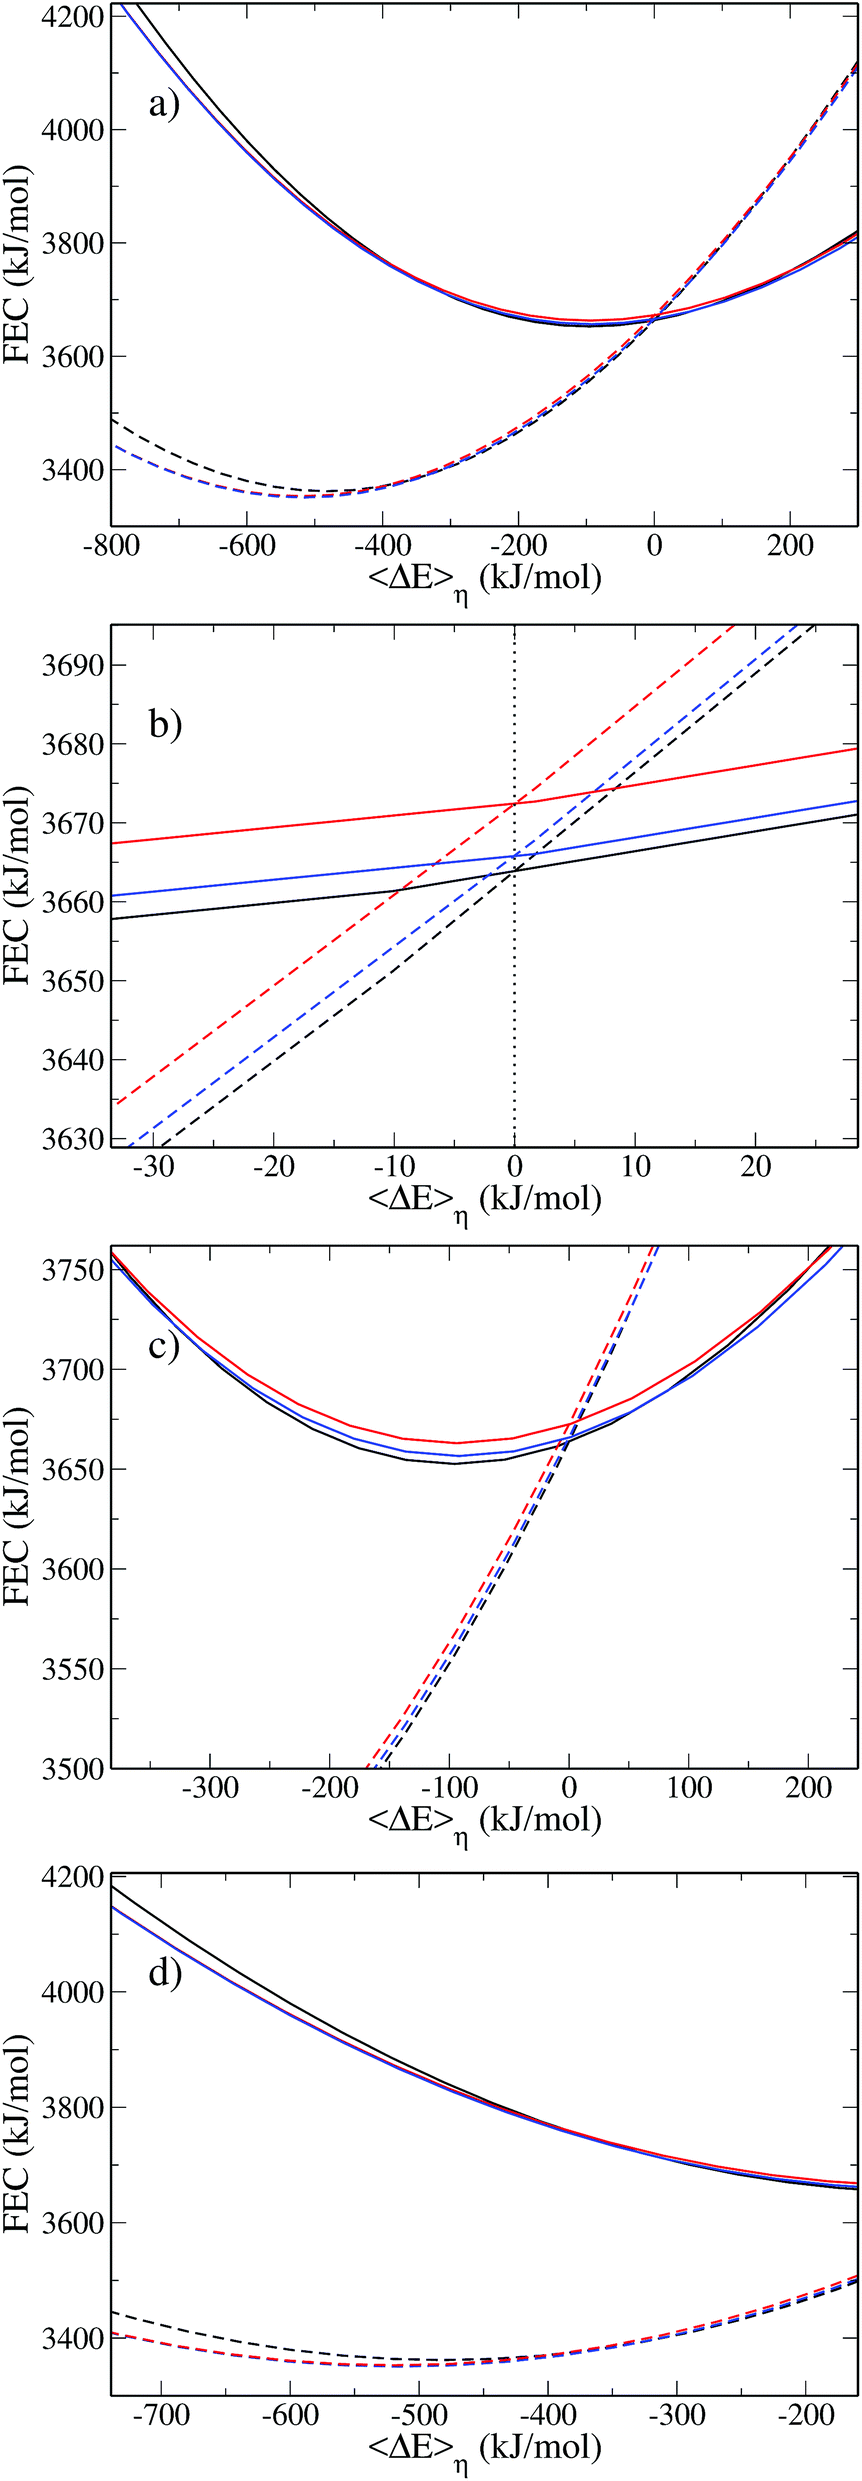 | ||
| Fig. 8 (a) Free energy Cl0 (full curve) and Cl+ (dashed curve) for various values of z. The black curves correspond to z = 3.0 Å, the red curves to z = 5.5 Å and the blue curves to z = 6.7 Å. Panel (b) is a zoom around 〈ΔE〉η = 0.0 kJ mol−1, represented by a dotted lined. The (c) and (d) panels show zooms around the minimum of the atom and cation free energies respectively. | ||
One of the advantages of MDFT is the possibility to split the free energy into entropic, solute–solvent and solvent–solvent contributions according to eqn (2):
 | (26) |
 | (27) |
Fig. 9 shows the various contributions to the reorganization free energy for the neutral and the charged solutes. To our knowledge, this is the first time that such a decomposition of the reorganization free energy is reported.
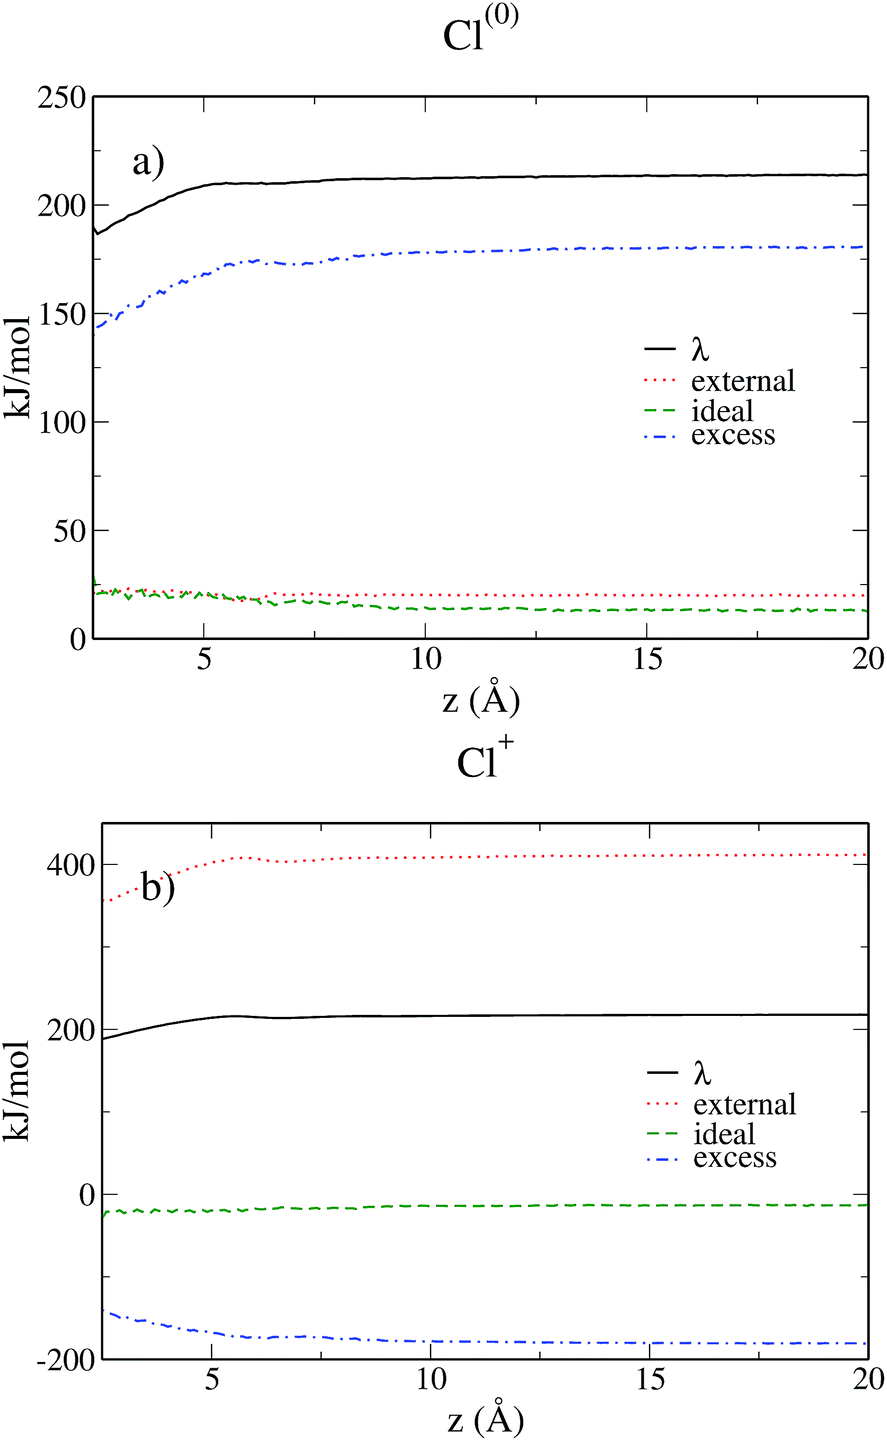 | ||
| Fig. 9 Reorganization free energies and their different contributions for Cl(0) (a) and Cl+ (b) as a function of the distance from the wall computed as computed within MDFT. The reorganization free energy is in black, the ideal term is in green, the excess term in blue and the external term in red. | ||
A first conclusion emerging from eqn (3), (6), (26) and (27) is that the ideal and excess contributions are exactly opposite for the neutral and the charged solutes. For both solutes, the ideal term due to the entropic contribution remains quite small and hardly varies with the distance from the electrode.
For the neutral solute the external contribution is small due to the absence of electrostatic interactions and more than 80% of the reorganization free energy is due to the excess term, i.e. the solvent–solvent contribution. In contrast, for the charged solute the main contribution is due to the electrostatic interaction between the solute and the solvent, which is roughly twice in absolute value than the solvent–solvent term. Even if we already know from the previous subsection that the Cl0 → Cl+ transfer does satisfy the linear response approximation, i.e. λ0 = λ1, it is fascinating to observe the compensation of the three contributing terms resulting in this equality. When the solutes approaches the wall, the linear response approximation gets even better as evidenced in Fig. 6 where the curves of λ0 and λ1 converge. This study also illustrates the interest of MDFT not only to compute the relevant free energies, but also to understand the various contributions to the free energy.
3 Conclusion
Marcus theory plays a crucial role in the study of ET reactions. This explains why its validity has been investigated extensively using molecular dynamics simulation. However, MD remains computationally very demanding, and has so far been essentially limited to simple systems. Molecular density functional theory has been proposed as an alternative to study solvation because it is computationally much faster, while retaining a molecular description of the solvent. In the present paper, we develop tools to use MDFT to study electron transfer reactions in water using MDFT. We have first derived how to compute the relevant reaction coordinate: the average vertical energy gap. We have also shown how to compute the free energy curves and the reorganization free energies.We examined the validity of the approach by studying simple solutes, namely the ET reactions between Cl0, Cl− and Cl+ modeled by a single Lennard Jones site and a point charge. We found a good agreement between the results obtained by MDFT and corresponding MD simulations. We confirmed the effect reported by Hartnig et al., that the ET between neutral and positive solutes is well described by Marcus theory, but not in the case of the transfer between the neutral atom and the anion.
We finally illustrated the potentiality of the method by tackling a more challenging system. We investigated the effect of the presence of a solid/solvent interface on the reorganization free energy, using a model system composed of an atomistically resolved neutral wall which is approached by the solute along the axis perpendicular to the wall. We computed the reorganization free energy for both neutral and charged states and found that they exhibit similar features. The reorganization free energy remains constant when the solute is far from the wall. As it approaches the wall, it exhibits oscillations before decreasing. We rationalized this behavior by considering the evolution of the solvation shell: close to the wall, there is less solvent to reorganize in the first solvation shell, thereby reducing the free energy cost.
This work is a first step towards the study of ET reaction in water and at electrode/water interfaces based on MDFT. The solvent effect sometimes called outer-sphere contribution is not the only mechanism playing a role in the ET reaction. The rearrangement of the electron cloud of the solute entering the so-called inner-sphere contribution may also play an important role. This effect is well taken into account in QM/MM calculation. There are mainly two approaches to deal with the MM part in such calculations. The first one is to use MD, which takes into account the molecular nature of the solvent, but remains computationally costly. The second one is to use PCM-like models in which the solvent is described as a dielectric continuum. This approach neglects the molecular nature of solvent. As a consequence, it always assumes the validity of the linear response approximation and cannot properly describe systems violating Marcus theory. The strength of this method is its numerical efficiency: calculations are almost instantaneous. MDFT is thus a promising alternative to those two approaches to account for solvation in QM calculations: even if it is computationally more demanding than PCM its computational cost remains negligible compared to the cost of the QM calculation while its accuracy is comparable to MD. To that end, we are currently working on coupling MDFT with electronic structure calculations such as electronic density functional theory. We also wish to develop a framework allowing for the description of the polarizability of the wall to describe electrodes at fixed electrode potential and study electrochemical reactions. These two objective are currently under investigation, in a attempt to develop a computationally efficient MDFT toolbox to tackle ET reactions.
A Proof that there is a one-to-one mapping between ρη and 〈ΔE〉η
A straightforward consequence of eqn (14) is that the average vertical energy gap is uniquely defined by the density field. Following Mermin and Evans,34,35 we proceed by reductio ad absurdum to show that the average vertical energy gap uniquely determines the external potential and thus the density. Let us assume there exist two potentials Vη and Vη′ with η ≠ η′ giving rise to the same gap i.e. 〈ΔE〉η′ = 〈ΔE〉η. From the expression of the probability distribution in eqn (10) and as stated in Appendix 1 of Evans's article,35Vη ≠ Vη′ implies fη ≠ fη′. From the variational principle of the grand potential we have | (28) |
By inverting the primed and unprimed quantities we get
 | (29) |
If we now sum eqn (28) and (29) we arrive at
 | (30) |
The integral on the r.h.s of eqn (30) vanishes as a consequence of eqn (14) and the assumption that 〈ΔE〉η′ = 〈ΔE〉η leading to a contradiction. Consequently, for this family of external potential Vη there is a unique 〈ΔE〉η which corresponds to a given probability distribution fη. We hence have a one to one mapping between all the following quantities
| η ↔ Vη ↔ fη ↔ ρη ↔ 〈ΔE〉η | (31) |
Because there is a bijection between 〈ΔE〉η and a probability distribution, then the free energy of any state uniquely depends on 〈ΔE〉η. To express the free energy as a function of 〈ΔE〉η, it is sufficient to take advantage of the one to one mapping between ρη and 〈ΔE〉η, to obtain the expression of eqn (15).
It is worth noticing that we can actually define F0(〈ΔE〉η) as the Legendre transform of Θη with respect to η, as 〈ΔE〉η is the conjugate variable of η:
 | (32) |
Moreover,
 | (33) |
Therefore the second derivative of Θη is negative, so that Θη is convex and its Legendre transform exists. We can hence define the Legendre transform of Fη by
 | (34) |
B Two different parameterizations of Vη lead to the same F(〈ΔE〉η)
Let us consider the general parametrization for the interpolating potential,| Vsη = V0 + s(η)(V1 − V0) | (35) |
 | (36) |
Again the δ and γ indexes can be interchanged to show a one-to-one mapping between a value of the coupling parameter, the external potential, the equilibrium probability distribution and the equilibrium density. However this mapping now depends on the chosen parametrization s,
 | (37) |
The mapping between 〈ΔE〉sη and ρsη leads to:
| F0(〈ΔE〉sη) = F0[ρsη]. | (38) |
This relation does not depend on the choice of the parametrization s, but the values of 〈ΔE〉sη and F0[ρsη] do. We now show that any parametrization yields the same FEC.
Let us consider a strictly increasing continuous function with s(0) = 0 and s(1) = 1. The intermediate value theorem guarantees that s takes all the value between 0 and 1, once only. This is true for all s and in particular for the identity function corresponding to the linear parametrization. This last property implies that for all s(η) ∈ [0,1], there exists a unique α ∈ [0,1] such that
| s(η) = α |
| Vsη = Vα |
Since the potential uniquely defines the functional this implies the same equality between all the properties in eqn (37), i.e.
| fsη = fα |
| ρsη = ρα |
| 〈ΔE〉sη = 〈ΔE〉α |
| F0[〈ΔE〉sη] = F0[〈ΔE〉α] |
This completes the proof that any parametrization of the intermediate potential leads to the same FEC.
C Thermodynamic cycle proposed by Chong and Hirata
Chong and Hirata proposed the thermodynamic cycle displayed in Fig. 10 where 0 and η are solutes corresponding to external potentials V0 and Vη in eqn (13).55 The objective is to find the free energy cost to modify the equilibrium solvent configuration around 0 into a solvent configuration which would be in equilibrium with η, a quantity denoted by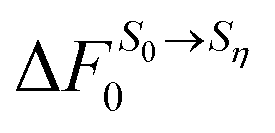 . Starting from 0 in vacuum, it is transformed into η spending a work Wuη. Then, η is solvated in its equilibrium solvent configuration Sη. This step corresponds to the solvation free energy ΔFη. The fictitious solute is transformed into 0 while the solvent configuration is frozen within Sη. The free energy cost of this step
 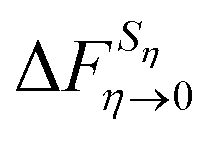 can be split into the sum of two terms. The first one is the reversible work to transform the solute in vacuum: it is the opposite of Wuη. The second term is the work Wvη to transform the solute against the field created by the solvent configuration Sη which can be expressed using our previous notation as:
| Wvη = 〈V0 − Vη〉η. | (39) |
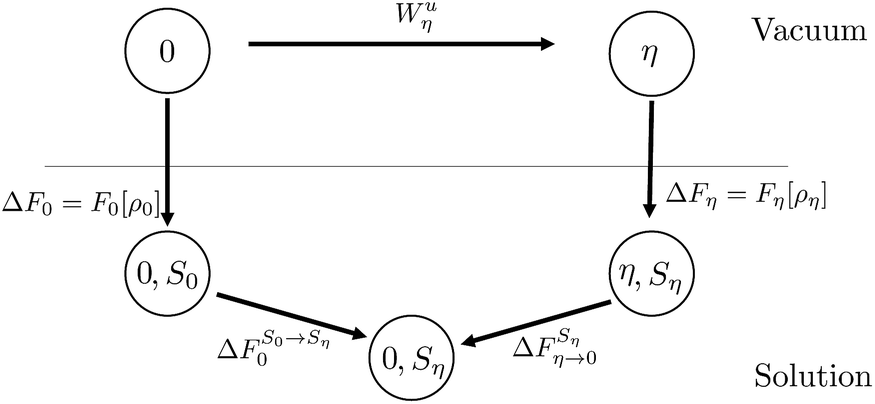 | ||
Fig. 10 Schematic representation of the thermodynamic cycle used to recover eqn (40). 0 corresponds to the state under consideration, while η corresponds to a fictitious solute which interacts with the solvent via an external potential Vη. The solvation states in equilibrium with states 0 and η are respectively denoted by S0 and Sη. To compute the FEC we need to compute  , the free energy cost to modify the solvent configuration around state 0 from S0 to Sη. , the free energy cost to modify the solvent configuration around state 0 from S0 to Sη. | ||
The final quantity required to close the cycle is the free energy cost to solvate 0 into its equilibrium solvent configuration. This corresponds to the solvation free energy of state 0, ΔF0. By closing the cycle, Chong and Hirata obtain the following formula:
 | (40) |
If we replace the solvation free energy by the functional of the present work, eqn (40) becomes
 | (41) |
D Modification of Hartnig and Koper's data to plot Fig. 2
In their paper, Hartnig and Koper represented their free energy curves as functions of a generalized order parameter defined as the electrostatic interaction energy between a negative point charge at the site of the solute and the solvent molecules.19 Because they only considered solutes with a single Lennard-Jones site which is kept unchanged during the ET the vertical energy gap is equal to their order parameter for an anion and to its opposite for a cation.They do not mention the use of any finite size effect corrections while we use that proposed by Hünenberger et al.57,58 which applies to our case but also to MD simulations with Ewald electrostatics.57 To convert their order parameter in vertical energy gap we thus (i) multiply it by −1 in the case of the cation, (ii) apply the above mentioned electrostatic corrections with the box length parameter of L = 24.83 Å reported in their paper.
Finally, Hartnig and Koper shifted all the FEC such that the minimum of each curve is equal to 0. As a consequence their curves do not cross for 〈ΔE〉η = 0, as should be the case by definition. Because they did not report the values of the solvation free energy, or equivalently the values of the shift applied to each curve, we decided to freely shift vertically the curves corresponding to the atom in order to have the minimum of the curves agree with the value predicted by MDFT. The MD curve for the ion has been subsequently shifted vertically to fulfill the zero gap condition.
Conflicts of interest
There are no conflicts to declare.Acknowledgements
The authors acknowledge Luc Belloni for his precious inputs to MDFT. The authors are also grateful to Jean-Pierre Hansen for his careful reading of the manuscript. B. R. acknowledges financial support from the French Agence Nationale de la Recherche (ANR) under Grant No. ANR-15-CE09-0013 and from the Ville de Paris (Emergences, project Blue Energy). This project has received funding from the European Research Council (ERC) under the European Union's Horizon 2020 research and innovation programme (grant agreement no. 771294). This work was supported by the Energy oriented Centre of Excellence (EoCoE), Grant Agreement No. 676629, funded within the Horizon 2020 framework of the European Union.Notes and references
- R. A. Marcus, J. Electroanal. Chem., 1997, 438, 251–259 CrossRef CAS.
- R. A. Marcus, J. Chem. Phys., 1956, 24, 979–989 CrossRef CAS.
- R. A. Marcus, J. Chem. Phys., 1956, 24, 966–978 CrossRef CAS.
- R. A. Marcus, J. Phys. Chem., 1990, 94, 1050–1055 CrossRef CAS.
- J. R. Miller, L. T. Calcaterra and G. L. Closs, J. Am. Chem. Soc., 1984, 106, 3047–3049 CrossRef CAS.
- J. K. Hwang and A. Warshel, J. Am. Chem. Soc., 1987, 109, 715–720 CrossRef CAS.
- M. Tachiya, J. Phys. Chem., 1989, 93, 7050–7052 CrossRef CAS.
- M. Tachiya, J. Phys. Chem., 1993, 97, 5911–5916 CrossRef CAS.
- R. A. Kuharski, J. S. Bader, D. Chandler, M. Sprik, M. L. Klein and R. W. Impey, J. Chem. Phys., 1988, 89, 3248–3257 CrossRef CAS.
- J. Blumberger and M. Sprik, Theor. Chem. Acc., 2006, 115, 113–126 Search PubMed.
- T. Simonson, Proc. Natl. Acad. Sci., 2002, 99, 6544–6549 CrossRef CAS PubMed.
- F. Sterpone, M. Ceccarelli and M. Marchi, J. Phys. Chem. B, 2003, 107, 11208–11215 CrossRef CAS.
- A. d. l. Lande, F. Cailliez and D. R. Salahub, in Simulating Enzyme Reactivity, 2016, pp. 89–149 Search PubMed.
- T. Kakitani and N. Mataga, J. Phys. Chem., 1985, 89, 8–10 CrossRef CAS.
- T. Kakitani and N. Mataga, J. Phys. Chem., 1986, 90, 993–995 CrossRef CAS.
- T. Kakitani and N. Mataga, J. Phys. Chem., 1987, 91, 6277–6285 CrossRef CAS.
- E. A. Carter and J. T. Hynes, J. Phys. Chem., 1989, 93, 2184–2187 CrossRef CAS.
- Z. Li, G. Jeanmairet, T. Méndez-Morales, M. Burbano, M. Haefele and M. Salanne, J. Phys. Chem. Lett., 2017, 1925–1931 CrossRef PubMed.
- C. Hartnig and M. T. M. Koper, J. Chem. Phys., 2001, 115, 8540–8546 CrossRef CAS.
- J. Blumberger, Phys. Chem. Chem. Phys., 2008, 10, 5651–5667 RSC.
- R. Vuilleumier, K. A. Tay, G. Jeanmairet, D. Borgis and A. Boutin, J. Am. Chem. Soc., 2012, 134, 2067–2074 CrossRef CAS PubMed.
- D. V. Matyushov and G. A. Voth, J. Chem. Phys., 2000, 113, 5413–5424 CrossRef CAS.
- D. W. Small, D. V. Matyushov and G. A. Voth, J. Am. Chem. Soc., 2003, 125, 7470–7478 CrossRef CAS PubMed.
- G. Jeanmairet, D. Borgis, A. Boutin and R. Vuilleumier, in CHAPTER 18: Extension of Marcus Rate Theory to Electron Transfer Reactions with Large Solvation Changes, 2013 Search PubMed.
- G. M. Torrie and J. P. Valleau, J. Comput. Phys., 1977, 23, 187–199 CrossRef.
- A. M. Ferrenberg and R. H. Swendsen, Phys. Rev. Lett., 1989, 63, 1195–1198 CrossRef CAS PubMed.
- M. R. Shirts and J. D. Chodera, J. Chem. Phys., 2008, 129, 124105 CrossRef PubMed.
- Z. Tan, E. Gallicchio, M. Lapelosa and R. M. Levy, J. Chem. Phys., 2012, 136, 144102 CrossRef PubMed.
- P. H. Fries and G. N. Patey, J. Chem. Phys., 1985, 82, 429–440 CrossRef CAS.
- D. Chandler and H. C. Andersen, J. Chem. Phys., 1972, 57, 1930–1937 CrossRef CAS.
- F. Hirata and P. J. Rossky, Chem. Phys. Lett., 1981, 83, 329–334 CrossRef CAS.
- A. Kovalenko and F. Hirata, Chem. Phys. Lett., 1998, 290, 237–244 CrossRef CAS.
- T. Imai, A. Kovalenko and F. Hirata, Mol. Simul., 2006, 32, 817–824 CrossRef CAS.
- N. D. Mermin, Phys. Rev., 1965, 137, A1441–A1443 CrossRef.
- R. Evans, Adv. Phys., 1979, 28, 143 CrossRef CAS.
- R. Ramirez, R. Gebauer, M. Mareschal and D. Borgis, Phys. Rev. E, 2002, 66, 031206 CrossRef PubMed.
- R. Ramirez and D. Borgis, J. Phys. Chem. B, 2005, 109, 6754–6763 CrossRef CAS PubMed.
- M. Levesque, V. Marry, B. Rotenberg, G. Jeanmairet, R. Vuilleumier and D. Borgis, J. Chem. Phys., 2012, 137, 224107 CrossRef PubMed.
- D. Borgis, L. Gendre and R. Ramirez, J. Phys. Chem. B, 2012, 116, 2504–2512 CrossRef CAS PubMed.
- R. Ramirez, M. Mareschal and D. Borgis, Chem. Phys., 2005, 319, 261–272 CrossRef CAS.
- G. Jeanmairet, M. Levesque, R. Vuilleumier and D. Borgis, J. Phys. Chem. Lett., 2013, 4, 619–624 CrossRef CAS PubMed.
- G. Jeanmairet, N. Levy, M. Levesque and D. Borgis, J. Phys.: Condens. Matter, 2016, 28, 244005 CrossRef PubMed.
- L. Ding, M. Levesque, D. Borgis and L. Belloni, J. Chem. Phys., 2017, 147, 094107 CrossRef PubMed.
- S. Luukkonen, L. Belloni, D. Borgis and M. Levesque, 2018, arXiv:1806.03118 [physics].
- P. Hohenberg and W. Kohn, Phys. Rev., 1964, 136, B864 CrossRef.
- J.-P. Hansen and I. McDonald, Theory of Simple Liquids, Academic Press, 3rd edn, 2006 Search PubMed.
- M. Frigo and S. Johnson, Proc. IEEE, 2005, 93, 216–231 Search PubMed.
- L. Blum and A. J. Torruella, J. Chem. Phys., 1972, 56, 303–310 CrossRef CAS.
- L. Blum, J. Chem. Phys., 1972, 57, 1862–1869 CrossRef CAS.
- L. Blum, J. Chem. Phys., 1973, 58, 3295 CrossRef CAS.
- M. Levesque, R. Vuilleumier and D. Borgis, J. Chem. Phys., 2012, 137, 034115 CrossRef PubMed.
- G. Jeanmairet, M. Levesque and D. Borgis, J. Chem. Phys., 2013, 139, 154101 CrossRef PubMed.
- G. Jeanmairet, M. Levesque, V. Sergiievskyi and D. Borgis, J. Chem. Phys., 2015, 142, 154112 CrossRef PubMed.
- R. A. Marcus, Discuss. Faraday Soc., 1960, 29, 21–31 RSC.
- S.-H. Chong and F. Hirata, Mol. Simul., 1996, 16, 3–17 CrossRef CAS.
- H. Sato, Y. Kobori, S. Tero-Kubota and F. Hirata, J. Chem. Phys., 2003, 119, 2753–2760 CrossRef CAS.
- M. A. Kastenholz and P. H. Hünenberger, J. Chem. Phys., 2006, 124, 124106 CrossRef CAS PubMed.
- M. A. Kastenholz and P. H. Hünenberger, J. Chem. Phys., 2006, 124, 224501 CrossRef PubMed.
- J. Puibasset and L. Belloni, J. Chem. Phys., 2012, 136, 154503 CrossRef PubMed.
- L. Belloni and I. Chikina, Mol. Phys., 2014, 112, 1246–1256 CrossRef CAS.
- L. Belloni, J. Chem. Phys., 2017, 147, 164121 CrossRef PubMed.
- R. C. Remsing, I. G. McKendry, D. R. Strongin, M. L. Klein and M. J. Zdilla, J. Phys. Chem. Lett., 2015, 6, 4804–4808 CrossRef CAS PubMed.
- M. W. Cole and J. R. Klein, Surf. Sci., 1983, 124, 547–554 CrossRef CAS.
Footnote |
| † Note that this is true for any Vη = V0 + s(η) (V1 − V0), as long as s is a strictly increasing continuous function with s(0) = 0 and s(1) = 1. |
| This journal is © The Royal Society of Chemistry 2019 |