DOI:
10.1039/C8SC04210A
(Edge Article)
Chem. Sci., 2019,
10, 1724-1734
The opposite and amplifying effect of B ← N coordination on photophysical properties of regioisomers with an unsymmetrical backbone†
Received
21st September 2018
, Accepted 27th November 2018
First published on 29th November 2018
Abstract
1,3-Dipolar cycloaddition of pyrido[2,1-a]isoindole with internal alkynes functionalized by a BMes2ph and an N-aromatic heterocycle leads to the formation of two types of regioisomers (major a and minor b) that have distinct physical and photophysical properties. Examination on 5 pairs of regioisomers unveils that the major isomers consistently have a smaller optical energy gap and emission energy than the corresponding minor isomers, which is greatly amplified by the formation of an internal B ← N bond. The regioisomers with a B ← N bond display contrasting temperature-dependent structural dynamics and response to fluoride ions, owing to an entropy-driven or fluoride initiated B ← N bond rupture/ring-opening process and the different B ← N bond strength. The opposite inductive effect and the Lewis pair properties of the dichotomic substituent units are responsible for the contrasting properties of the regioisomers in this system.
Introduction
Isomerism plays various important roles in chemistry, especially in medicinal and pharmaceutical chemistry.1 In the areas of optoelectronics and materials science,2 isomers with varying substitution patterns also attract great research interest due to their distinct properties, which allows them to be used for fine-tuning molecular functions in both bulk materials and devices. Therefore, understanding and exploiting the influence of isomerism on the physical and photophysical properties of molecules is an important issue in materials science.
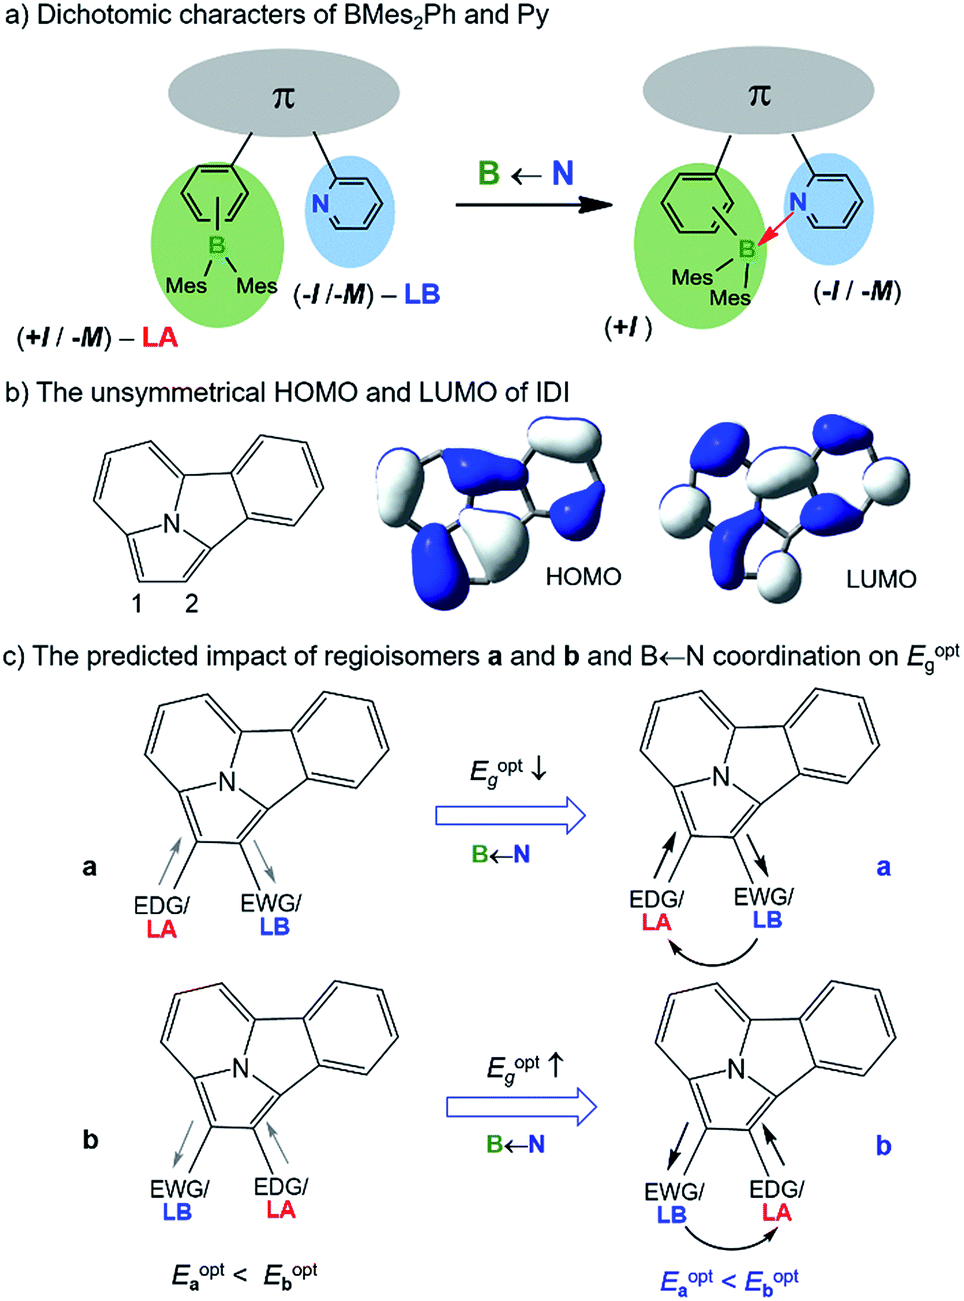
Owing to their diverse chemical properties, boron-containing molecules have important applications in materials chemistry, including optoelectronic materials3 and sensory devices.4 The utility of isomerism phenomena in organoboron systems has been demonstrated in several contexts previously, including structural change at a boron atom via photoisomerization,5 varying emission colours based on constitutional isomerism,6 and reversible B ← X (X = N or O) bond formation/cleavage where the open and closed forms display significantly different photophysical properties.7 The introduction of an internal B ← N bond is also known to be effective in enhancing extended π-conjugation, tuning the electronic properties of molecules, and improving the performance of emissive/charge transport materials in high performance organic devices.3b,8 BMes2ph and N-aromatic units (e.g. 2-pyridyl; py) are commonly used functional groups in conjugated materials. These two types of units can be inductively electron-donating (EDG/+I) and electron-withdrawing (EWG/−I), respectively, when bound to an appropriate arene substrate. BMes2ph and py can also both exert a negative mesomeric effect (−M) on the substrate they are bound to via π-conjugation. On the other hand, as illustrated in Scheme 1a, they are also Lewis acid (LA) and Lewis base (LB), respectively, capable of forming a B ← N bond. If we consider the inductive effect only, the dual EDG(+I)-LA and EWG(−I)-LB characters possessed by the BMes2ph and py, respectively, are seemingly opposing each other, hence such units may be described as electronically “dichotomic” groups. The formation of an internal B ← N bond would reinforce the −I/−M character of the py unit and greatly enhance the +I character of BMes2Ph. The impact of an internal B ← N bond on the HOMO–LUMO gap/photophysical properties of molecules possessing such dichotomic units would depend on the electron density/orbital distributions of the π-backbone unit. If the substitution sites to the backbone are electron-rich and electron-poor, respectively, and contribute to HOMO and LUMO, respectively, the dichotomic units could have a distinct influence on the photophysical properties of regioisomers via both inductive/mesomeric and coordination effects. Despite the appealing features of such units, experimental confirmation on their influence on the properties of regioisomers has not been demonstrated owing to the lack of suitable systems for accessing the required regioisomers.
 |
| | Scheme 1 Illustration of impact of dichotomic units on Eoptg. The straight arrows indicate inductive effect and the curved arrow shows the dative bond between the Lewis pair. | |
We have discovered that indolizino[3,4,5-ab]isoindole (IDI) can serve as the model system for the study of the influence of dichotomic substituents on regioisomers. The IDI molecule is an electron-rich substrate. BMes2Ph and py attached to IDI are mainly inductively EDG and EWG, respectively.9 As shown in Scheme 1b, the C1 and C2 atoms in IDI have the highest and the lowest electron density, respectively, among the carbon atoms (electrostatic potential charge = −0.421 for C1, −0.110 for C2). The HOMO of IDI has a large contribution to C1 but no contribution to C2 while the LUMO contributes to both C1 and C2 (DFT, M06-2X/6-31g(d)). If we consider the inductive and coordination effects alone, two scenarios, a and b are possible as shown in Scheme 1c. In a, the substituents mismatch the electron density distribution of the IDI substrate, thus likely leading to the destabilization and stabilization of HOMO and LUMO, respectively, and a smaller optical energy gap (Eoptg). In b, the substituents match the IDI unit, thereby stabilizing the HOMO and destabilizing the LUMO, likely leading to a larger Eoptg. By successfully preparing and isolating 5 pairs of regiosiomers of IDI based on BMes2Ph and N-heterocycle units, we have established the impact of the dichotomic units and the amplification effect of a B ← N bond on the electronic/photophysical properties of regioisomers for the first time. The details are presented herein.
Results and discussion
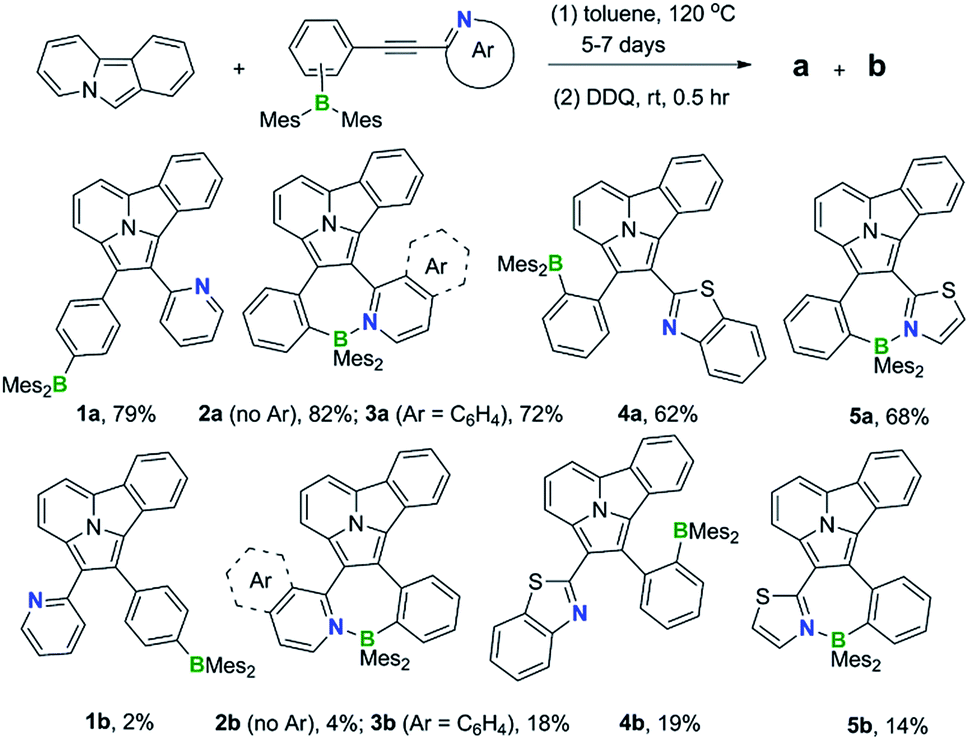
Synthesis and structures of 1a/1b–5a/5b
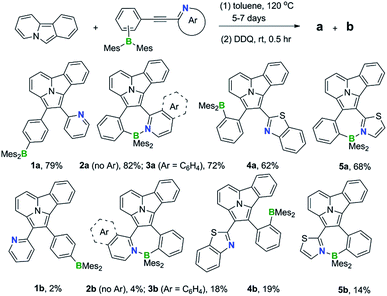
1,3-Dipolar cycloaddition reactions of pyrido[2,1-a]isoindole9 with internal alkynes decorated by BMes2ph and N-aromatic units were employed to synthesize the 5 pairs of regioisomers using the general one-pot, two-step procedure shown in Scheme 2. Previously, terminal alkynes containing a BMes2Ph unit were investigated for this type of reaction, which led to the exclusive formation of species that have the boron unit at the C1 position.3b Consistent with the previous findings and the well-established selection rules for 1,3-dipolar cycloadditions,10 regioisomers (a) were isolated as the dominating products in all reactions, along with the minor isomers (b). The overall isolated yields are excellent for all 5 pairs of compounds (81% to 90%). Each pair of regioisomers were separated by either column or preparative thin-layer chromatography (TLC). The low isolated yields of 1b and 2b were caused by their band overlap with 1a and 2a, respectively, on column and TLC plates, which made it necessary to run multiple column/TLC purifications to isolate the pure products, resulting in the loss of compounds. DFT computational analysis (M06-2X/6-31g(d) with CH2Cl2 as the solvent) indicated that isomer (b) is thermodynamically more stable than isomer (a) by ∼0.5 to 3.1 kcal mol−1 for all 5 pairs. Therefore, the preferential formation of isomer (a) can be attributed to kinetic factors. Attempts to increase the yield of isomer (b) by either adding a large excess of NBu4F (TBAF) to the cycloaddition reaction or using alternative procedures were not successful. The 5 pairs of regioisomers were fully characterized by NMR, HRMS and single-crystal X-ray diffraction analyses.
 |
| | Scheme 2 Synthetic procedures and structures of 1a/1b–5a/5b. | |
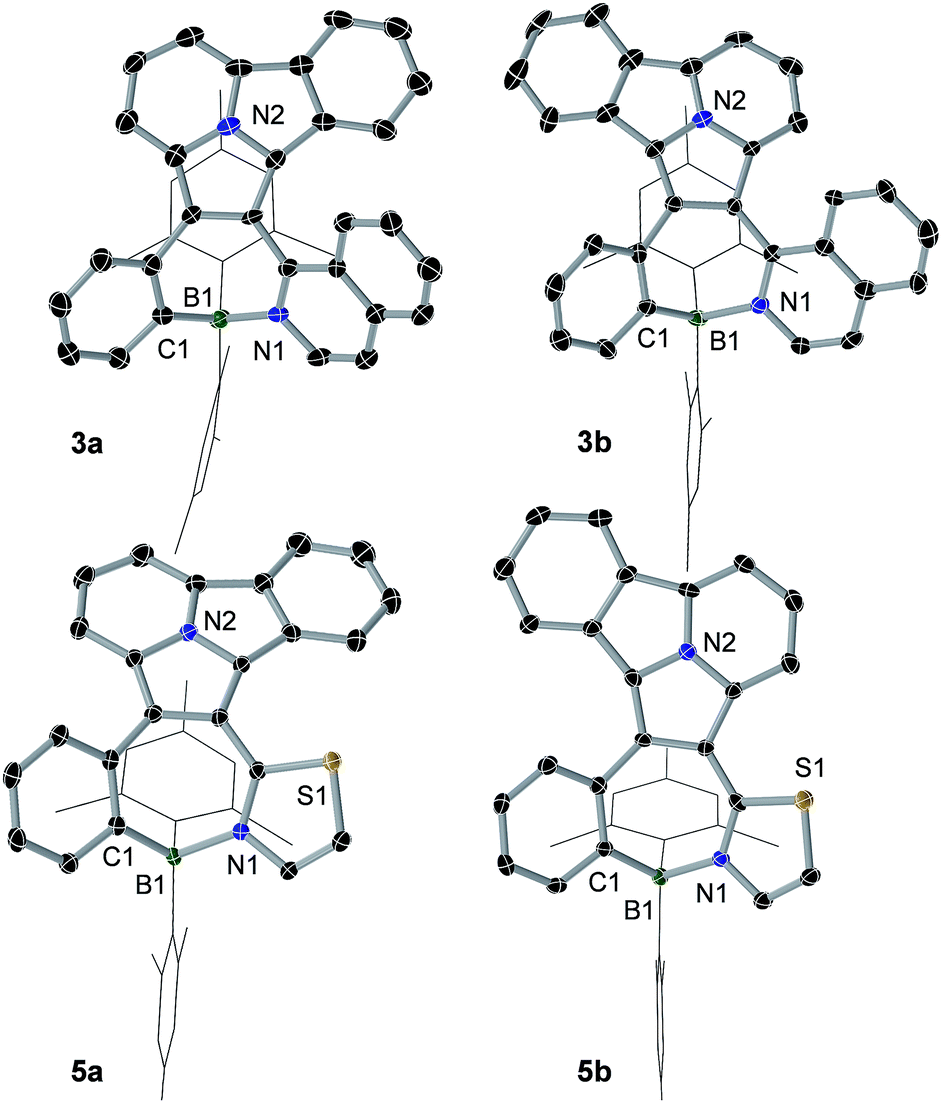
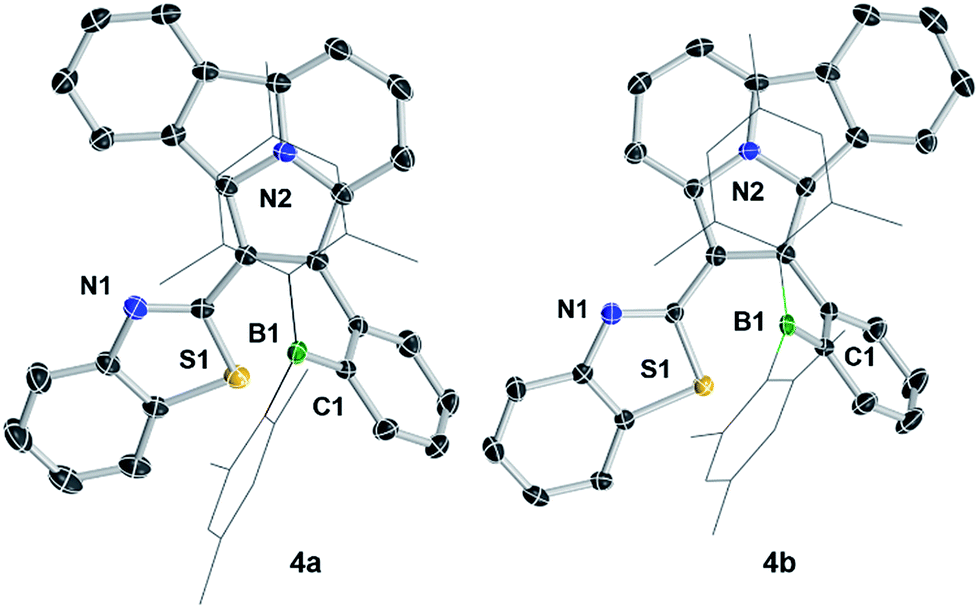
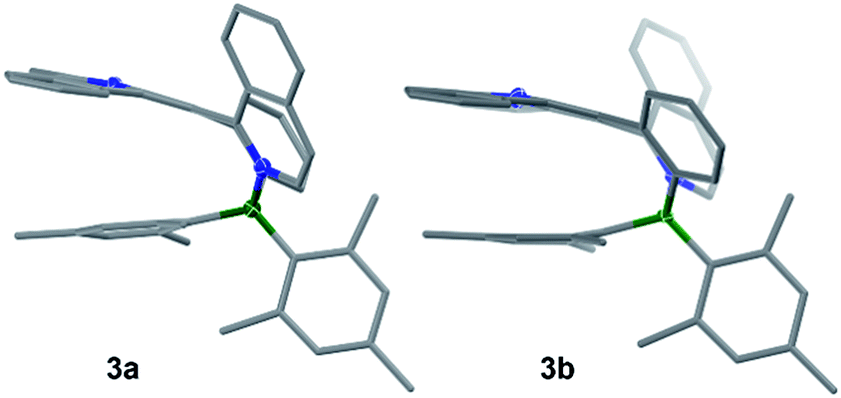
The crystal structures of 3a, 3b, 5a, and 5b are shown in Fig. 1 while 4a and 4b are shown in Fig. 2. The structures of 1a/2a and 1b/2b are provided in the ESI.† For the tetracoordinate compounds, the boron atom is bound to the nitrogen atom of the heterocycle with a long B ← N bond as shown in Table 1. DFT (M06-2X/6-31G(d)) optimized structures gave similar B ← N bond lengths for 2a/2b and 3a/3b. For 5a/5b, however, the DFT calculated B←N bond length is 1.705 and 1.691 Å, respectively, which agrees with the trend observed for other pairs but disagrees with the crystal data of 5a/5b. This discrepancy may be caused by the different intermolecular interactions in the crystal lattices of 5a and 5b (see ESI†). Natural bond orbital (NBO) analysis gave Wiberg bond index of 0.55/0.56, 0.56/0.57, 0.58/0.60 for the B ← N bond in 2a/2b, 3a/3b, 5a/5b, respectively, supporting that the (a) isomer has a slightly weaker B ← N bond than that of (b) isomer. One of the mesityls in each of these molecules has π-stacking interactions with the pyrrole ring of the backbone with the shortest atomic separation distance being ∼3.65 Å (see the side view of the structures of 3a and 3b in Fig. 3). The dihedral angles between the IDI ring and the N-heterocycle/the phenyl ring (bound to B) vary considerably, with 1a/1b and 4a/4b displaying the smallest φ1, 4a and 4b displaying the largest φ2, because of the highly congested o-BMes2 unit (Fig. 2).
 |
| | Fig. 1 Crystal structures of 3a, 3b, 5a and 5b with 35% thermal ellipsoids. For clarity, the Mes groups are shown in wireframe style and H atoms are omitted. | |
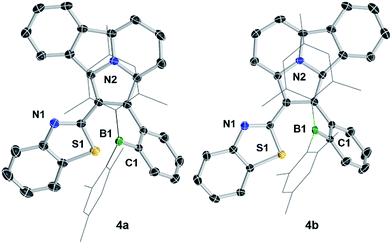 |
| | Fig. 2 Crystal structures of 4a and 4b. For clarity, the Mes groups are shown in wireframe style and H atoms are omitted. | |
Table 1 B ← N bond lengths (Å) and dihedral angles between IDI ring and the N-heterocycle (°, φ1)/the phenyl ring bound to boron (°, φ2)
|
|
1a/1b |
2a/2b |
3a/3b |
4a/4b |
5a/5b |
| B←N |
|
1.721(5)/1.713(3) |
1.709(6)/1.700(15) |
|
1.688(2)/1.700(6) |
|
φ1 |
29.3/31.8 |
45.7/43.6 |
50.1/49.8 |
25.6/30.1 |
40.7/33.5 |
|
φ2 |
38.8/50.1 |
42.1/41.5 |
43.8/42.9 |
71.9/63.4 |
43.8/33.1 |
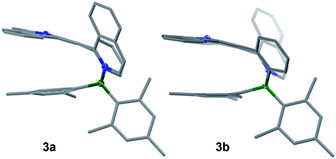 |
| | Fig. 3 Side view of the crystal structures of 3a and 3b. | |
In solution, 2a/2b, 3a/3b, and 5a/5b retain at least partially the tetracoordinate geometry, as evidenced by their 11B NMR chemical shifts (22.5/10.3, 6.2/4.6, 7.7/3.3 ppm, respectively). The much down-field shifted 11B NMR peak of the (a) isomers again agrees with their weaker B ← N bond, relative to that of the (b) isomers in solution. The boron unit in 1a/1b and 4a/4b has a typical trigonal planar geometry. For 4a/4b, despite the ortho-BMes2 group, there is no B ← N bond, which could be attributed to the unfavorable steric interactions between the benzothiazolyl and the Mes ring.
2a, 2b and 5a display temperature (T)-dependent NMR spectra while 3a and 3b do not show appreciable change up to 333 K, supporting the greater stability of the latter. The 11B NMR signal (Fig. 4 and see ESI†) of 2a shifts from 5.8 ppm at 253 K to 47.0 ppm at 333 K in CDCl3 while that of 2b from 5.6 ppm at 253 K to 24.1 ppm at 333 K. This shows that both isomers are in dynamic equilibrium with their open form, and that the closed form is more stable at low T while the open one becomes dominant at high T driven by entropy. The equilibrium constant/ΔH/ΔS values at 298 K for the closed to open form conversion were determined to be 0.44/6.88 kcal mol−1/91 J mol−1 K−1 for 2a and 0.10/8.02 kcal mol−1/93 J mol−1 K−1 for 2b, respectively, consistent with the DFT predicted relative stability of 2a and 2b. The relatively stronger B ← N bond, facilitated by the favourable inductive effect that makes the py a stronger donor and the B center a stronger acceptor, is likely a key contributor to the greater stability of 2b, compared to 2a. π-conjugation involving the BMes2Ph unit in the corresponding open form appears to play a lesser role, given the fact that 1a (a model for 2a-open) is less stable than 1b. The 11B NMR spectral change with T for 5a is similar to that of 2b (1.6 ppm at 253 K to 16.1 ppm at 333 K), an indication that the B ← N bond in 5a has a similar stability as that in 2b. 5b shows a change of 2 ppm (3.0 ppm at 253 K to 5.0 ppm at 333 K), indicating its greater stability than 5a.
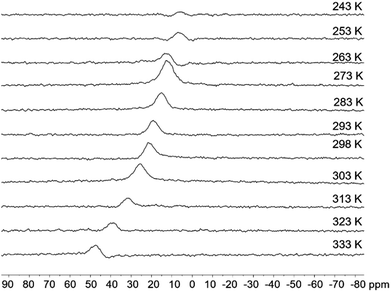 |
| | Fig. 4 VT-11B NMR spectra of 2a in CDCl3. | |
Photophysical and electrochemical properties of 1a/1b–5a/5b
B←N coordination leads to dramatically different m.p. for the regioisomers with the (b) isomers having a consistently higher m.p. than the (a) isomers (197 °C/309 °C for 2a/2b; 197 °C/264 °C for 3a/3b, 238 °C/262 °C for 5a/5b, recorded for vacuum dried solids). According to DFT data, the tetracoordinate compounds have a much greater electrical dipole moment, compared to their open forms (see ESI†).
The most interesting impact of the dichotomic groups is on the electrochemical and photophysical properties of the 5 pairs of regioisomers. As shown by the absorption spectra in Fig. 5 and the data in Table 2, the regioisomers (a) consistently have a smaller Eopt and a longer λmax (the first band) than those of the corresponding isomers (b). For example, the absorption λmax of 1a and 1b is 478 nm and 472 nm, respectively (ΔEoptg = 0.06 eV, Δλmax = −6 nm) while that of 4a and 4b is 489 nm and 470 nm, respectively (ΔEoptg = 0.11 eV, Δλmax = −19 nm). Compounds 1a and 1b are constitutional isomers of 2a and 2b, and could serve as model compounds for the experimentally inaccessible 2a-open/2b-open. This is in fact supported by TD-DFT calculated S0 → S1 vertical excitation energies of 2a-open and 2b-open which are very close to those of 1a and 1b (see ESI†). From 1a to 2a, Eoptg decreases by 0.16 eV and λmax increases by 29 nm, while, in contrast, from 1b to 2b, Eoptg increases by 0.04 V and λmax decreases by 10 nm. As a consequence, the change of ΔEopt (0.26 eV) and Δλmax (−45 nm) between 2a and 2b is much greater, compared to that between 1a and 1b, resulting the greater visual colour difference for 2a and 2b as shown by the photographs in Fig. 5. Similarly, regioisomers 3a/3b, and 5a/5b also have a large Eopt difference (ΔEopt = 0.32 eV and 0.29 eV, respectively) with distinct colour difference. These data confirm that B ← N coordination indeed has an amplifying effect on Eopt between isomers (a) and (b).
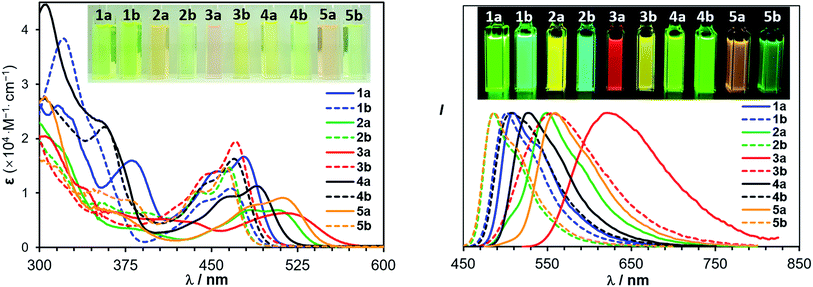 |
| | Fig. 5 Absorption (left) and normalized fluorescence (right) spectra of 1a/1b–5a/5b in THF (1.0 × 10⁻⁵ M). Insets: photographs showing the absorption and emission colours of the 5 pairs of isomers. | |
Table 2 Photophysical data of 1a/1b to 5a/5b
|
|
λ
abs
(nm) |
ε, (L M−1 cm−1) |
E
optg (eV) |
λ
em
(nm) |
Φ
,
|
τ
av (ns)b |
k
r/knr (107 s−1)d |
Exp. ELUMO/EHOMOe (eV) |
|
10−5 M in THF at 298 K.
Solid/THF (10−5 M).
The solution QY was determined in THF using an integration sphere under N2. The solid-state QY was measured using an integration sphere.
Radiative decay rate constant kr/knr in THF is calculated by kr = Φ/τav, knr = (1 − Φ)/τav.
E
LUMO or HOMO = −(4.8 + Ered or Eox).
|
|
1a
|
478 |
1.62 × 10⁴ |
2.46 |
575/509 |
0.41/0.98 |
11.2/9.6 |
10.2/0.21 |
−2.07/−5.02 |
|
1b
|
467 |
1.09 × 10⁴ |
2.52 |
549/502 |
0.22/0.89 |
6.8/13.4 |
6.64/0.82 |
−2.20/−5.03 |
|
2a
|
507 |
0.703 × 10⁴ |
2.30 |
589/550 |
0.53/0.93 |
20.2/24.8 |
3.75/0.28 |
−2.12/−4.82 |
|
2b
|
465 |
1.52 × 10⁴ |
2.56 |
550/486 |
0.27/0.65 |
13.1/11.2 |
5.80/3.13 |
−1.88/−4.95 |
|
3a
|
516 |
0.618 × 10⁴ |
2.19 |
623/621 |
0.38/0.29 |
23.9/20.8 |
1.39/3.41 |
−2.38/−4.84 |
|
3b
|
471 |
2.04 × 10⁴ |
2.51 |
575/556 |
0.59/0.54 |
23.2/7.0 |
7.71/6.57 |
−2.24/−5.03 |
|
4a
|
489 |
0.923 × 10⁴ |
2.40 |
565/527 |
0.15/0.68 |
5.6/15.8 |
4.30/2.02 |
−2.07/−4.96 |
|
4b
|
470 |
1.60 × 10⁴ |
2.51 |
559/507 |
0.30/0.86 |
14.2/10.2 |
8.43/1.37 |
−1.96/−4.99 |
|
5a
|
511 |
0.912 × 10⁴ |
2.27 |
604/559 |
0.35/0.82 |
15.8/21.9 |
3.74/0.82 |
−2.20/−4.91 |
|
5b
|
462 |
1.43 × 10⁴ |
2.56 |
571/487 |
0.31/0.49 |
14.2/6.0 |
8.17/8.50 |
−1.95/−5.00 |
The impact of B ← N coordination on fluorescence spectra of the regioisomers follows the same trend as observed in the absorption spectra/of Eopt. However, the emission colour difference displayed by each pair of the B ← N bound regioisomers is more dramatic and impressive, as shown in Fig. 5. For example, 2a and 2b emit a yellow and a blue colour, respectively while 3a and 2b emit a red and a yellow colour, respectively. All five pairs of compounds display impressive emission quantum yields in solution and the solid state and the emission colours/spectra cover nearly the entire visible region (Table 2). The sharp colour contrast displayed by these regioisomers indicates that B ← N coordination can be an effective approach in tuning optical bandgap and fluorescent colours of isomeric species.
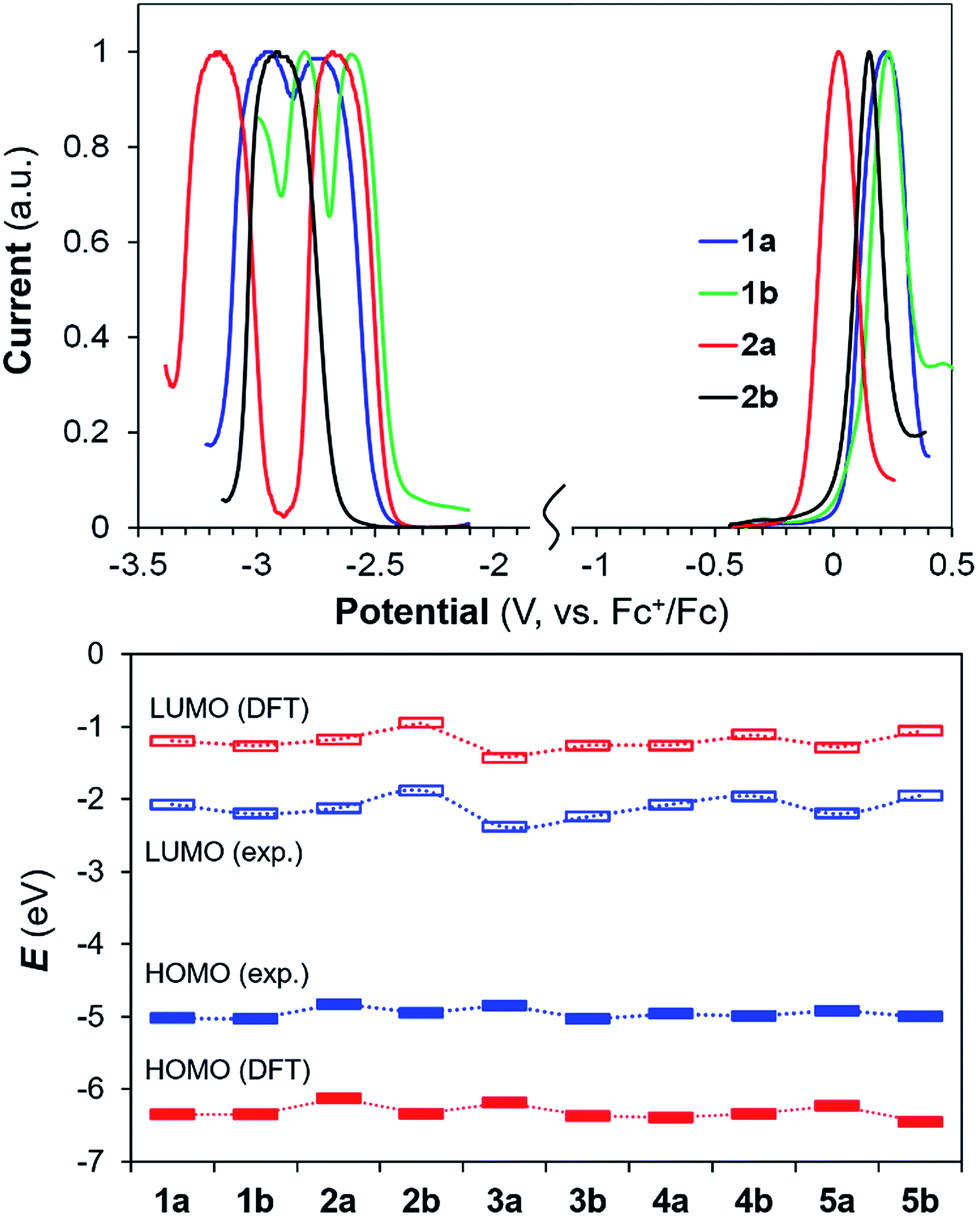
Well-resolved oxidation and reduction peaks for 1a/1b–5a/5b were observed in the differential pulse voltammetry (DPV) diagrams. The DPV diagrams for 1a/1b and 2a/2b are shown in Fig. 6, while those of other compounds are provided in the ESI.† In general, the electrochemical energy (HOMO–LUMO) gap of 1a/1b–5a/5b follows approximately the same trend as that of Eopt (Table 2) and the HOMO–LUMO gap calculated by DFT (Fig. 6, see also ESI†). Although the calculated HOMO and LUMO values deviate significantly from those obtained from electrochemical data, the trend of these two sets of values for the 10 molecules agrees with each other. The impact of B ← N coordination on redox potentials is illustrated by comparing the Ered/ox of 1a and 2a, 1b and 2b. From 1a to 2a, Eox decreases by 0.20 V while Ered decreases by 0.05 V (less negative), indicating that B←N coordination mainly destabilizes the HOMO level in (a), leading to a smaller energy gap. In contrast, from 1b to 2b, Eox decreases by 0.08 V while Ered increases by 0.32 V (more negative), confirming that B ← N coordination mainly destabilizes the LUMO level in (b), leading to a larger energy gap. Within each pair of regioisomers, except 1a/1b, the LUMO of the (b) isomer in each pair is consistently higher than that of the corresponding (a) isomer. For the HOMO level, the (b) isomer is consistently lower than that of the (a) isomer for all 5 pairs.
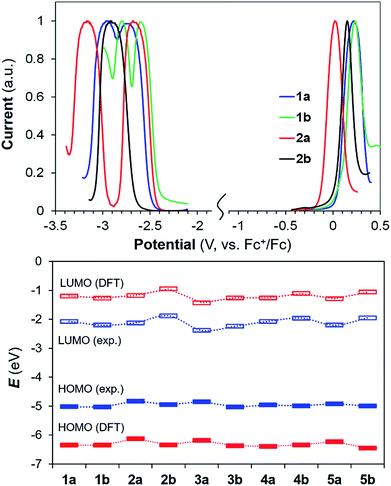 |
| | Fig. 6 Top: Differential Pulse Voltammetry (DPV) diagrams of 1a/1b and 2a/2b showing the reduction (recorded in THF) and oxidation peak (recorded in CH2Cl2) using NBu4PF6 (0.1 M) as the electrolyte and a scan rate of 100 mV s−1. Bottom: HOMO and LUMO energies obtained from DFT (red) and electrochemical data (blue). | |
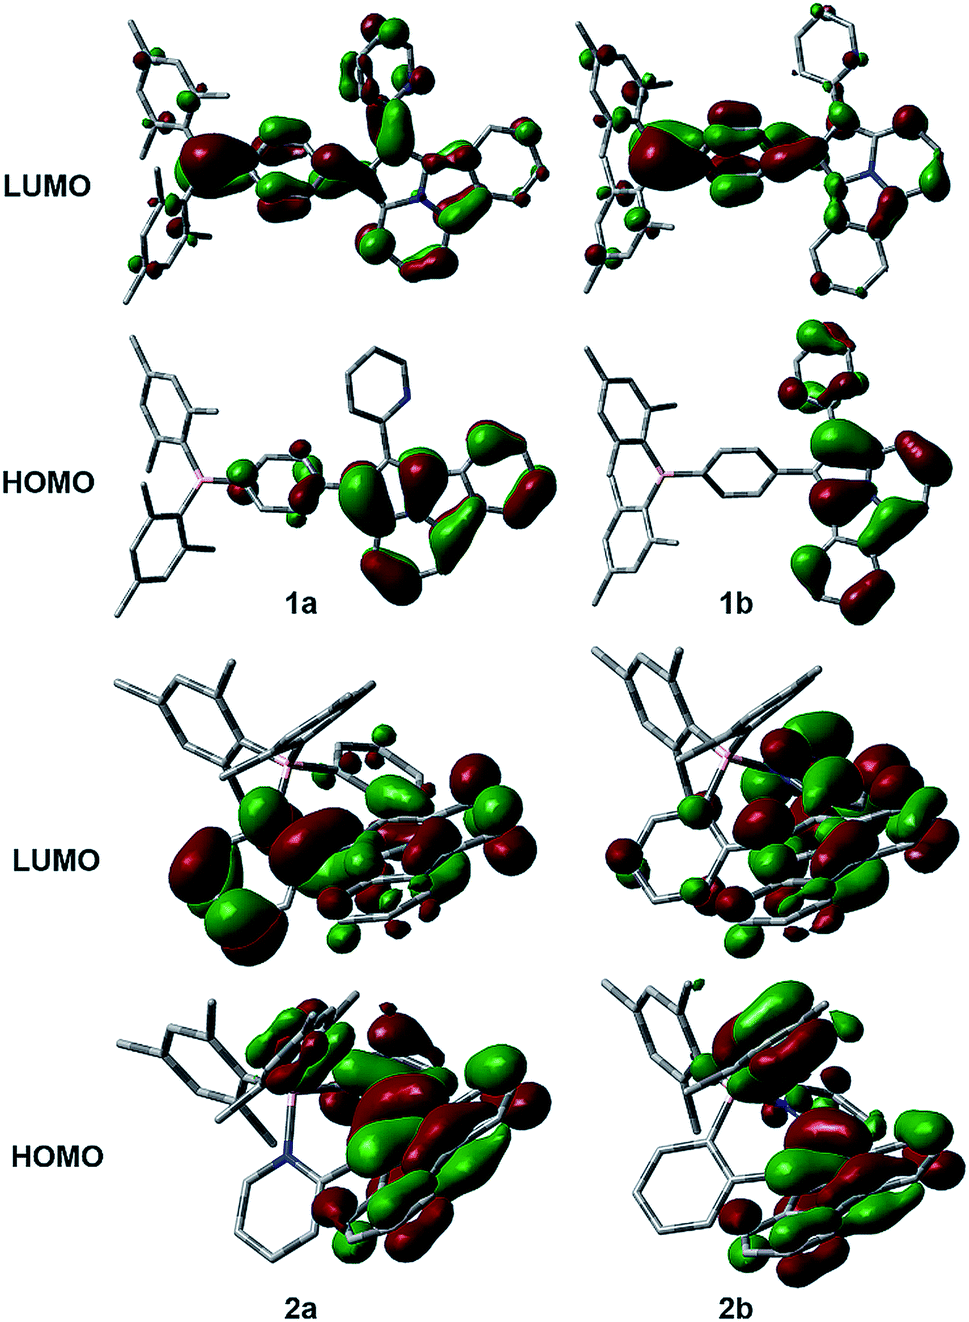
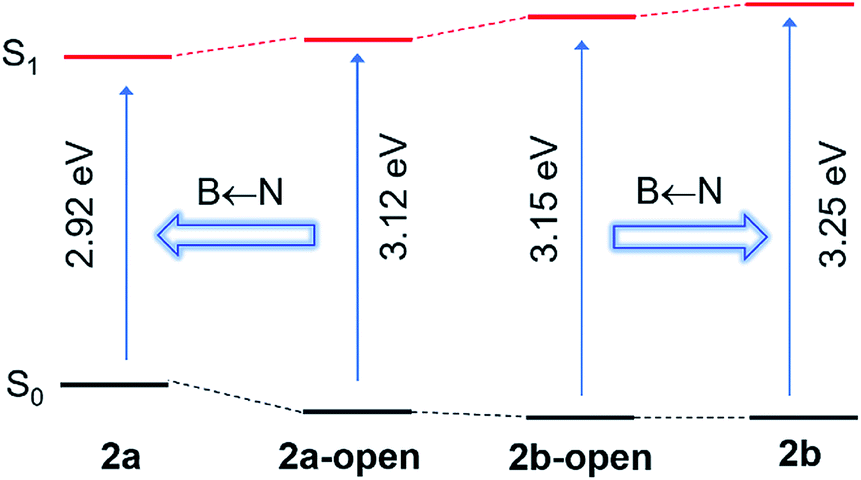
The distinct impact of B←N coordination on Eopt/λem of the (a) and (b) isomers is clearly caused by the different influence of the dichotomic units on the HOMO and LUMO levels. As shown in Scheme 1, in the (a) isomer, B ← N coordination makes BMes2ph a better EDG (raising HOMO) and the N-heterocycle a better EWG (lowering LUMO). The N-heterocycle in (a) does not influence significantly HOMO level owing to the lack of HOMO at C2, but decreases LUMO via both −I and −M effect. The net result is the narrowing of Eopt in the (a) isomer. This agrees well with the DFT data calculated HOMO/LUMO diagrams of 2a shown in Fig. 7, where the py at C2 contributes mainly to the LUMO level while the PhBMes2 unit have a large contribution to the HOMO level. In the (b) isomer, B ← N coordination makes the N-heterocycle a better EWG (lowering HOMO/LUMO) and BMes2ph a better EDG (increasing LUMO), hence widening Eopt. Indeed, DFT data for 2b show that the py at C1 contributes to both HOMO and LUMO levels while the Ph of the PhBMes2 unit contributes mainly to LUMO. To further illustrate the impact of B ← N coordination, TD-DFT computations for the geometrically optimized open forms of 2a/2b, 3a/3b and 5a/5b were performed. The computational data indeed show that from the open form to the closed form, the S0 → S1 vertical transition energy decreases by ∼0.2 eV for 2a, 3a and 5a isomers but increases by about 0.1 eV for 2b and 5b isomers as illustrated by the 2a/2b pair in Fig. 8 (see ESI† for data of other pairs). This supports the “amplification effect” exerted by B ← N coordination for the 2a/2b and 5a/5b pairs. For 3b, from the open form to the closed form, the S0 → S1 transition energy has a slight decrease of 0.02 eV, which is likely caused by the greater π-conjugation of the large isoquinoline ring with the backbone that partially offsets the coordination effect in 3b.
 |
| | Fig. 7 HOMO and LUMO diagrams of 1a/1b and 2a/2b (DFT, M06-2X/6-31g(d)). | |
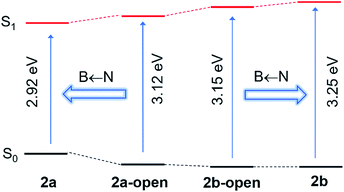 |
| | Fig. 8 TD-DFT calculated S0 → S1 vertical transition energies for 2a/2b and their corresponding open forms (DFT, M06-2X/6-31g(d)), illustrating the “amplification effect” of B ← N coordination. | |
The anomalous LUMO energy decrease for 1a to 1b is likely caused by the −M effect of the PhBMes2 unit that offsets its +I effect to the LUMO, leading to the net stabilization of the LUMO level in 1b. This is evidenced by the dominant contribution of the Ph and B atom to the LUMO of 1b shown in Fig. 7. This effect is only observed for the 1a/1b pair because the BMes2 unit is at the para-position of the phenyl ring and the entire molecule is much less congested, allowing effective π-conjugation, and maximizing the −M effect, compared to the highly congested tricoordinate pair of 4a/4b. These data unequivocally confirm that the B ← N bond and the dichotomic units indeed have a opposite effect on the HOMO/LUMO energies, leading to the contrasting electronic/photophysical properties of the regioisomers, which agrees with the postulated energy change shown in Scheme 1.
Temperature-dependent emission of 2a/2b, 3a/3b, and 5a/5b
To examine the impact of B ← N bond dissociation on fluorescence colour change, the emission spectra of 2a/2b, 3a/3b, and 5a/5b at various temperatures (T) were examined. Because of the relatively low m.p. (228 K) and high b.p. (403 K) of mesitylene, it was selected for the VT fluorescence experiments. The data of 2a/2b and 3a/3b are shown in Fig. 9 and that of 5a/5b are provided in the ESI.† Consistent with the dynamic equilibrium of 2a/2b with their corresponding open forms in solution, the fluorescence spectra of 2a and 2b show contrasting dependence on T with 2a being more sensitive (Fig. 9). For 2a, upon increasing T from 233 K to 403 K, the emission peak gradually blue shifts, with the appearance of a well resolved new peak at 517 nm. In contrast, compound 2b undergoes a small red shift from 489 nm to 500 nm with increasing T. The emission spectral change of 2a and 2b with T reverses the B ← N amplification effect shown in Fig. 8, thus consistent with the B←N bond dissociation and the formation of the open isomer. The trend of the emission spectral change of 5a and 5b with increasing T is similar to that of 2a and 2b, respectively (see ESI†), and in agreement with the closed to open form S0 → S1 transition energy change predicted by TD-DFT data. For 3a, with increasing T, the emission spectrum only undergoes a slight blue shift with a shoulder peak rising at ∼515 nm, which can be attributed to 3a-open, based on TD-DFT prediction. For 3b the emission spectrum blue shifts by about 10 nm with increasing T, which also agrees with the DFT predicted S0 → S1 transition energy change between 3b and 3b-open. The T-dependent emission spectral change of 2a/2b, 3a/3b and 5a/5b is fully reversible, supporting the potential of this new class of B←N coordination bond-based system as temperature probes.11
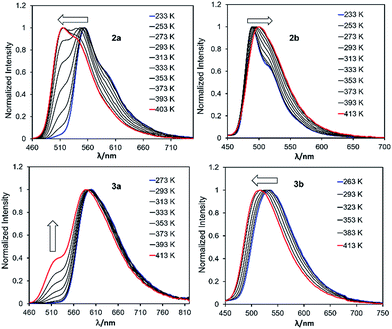 |
| | Fig. 9 Temperature-dependent fluorescence spectra of 2a/2b and 3a/3b in mesitylene under N2. | |
Switching B←N bond with fluoride ions
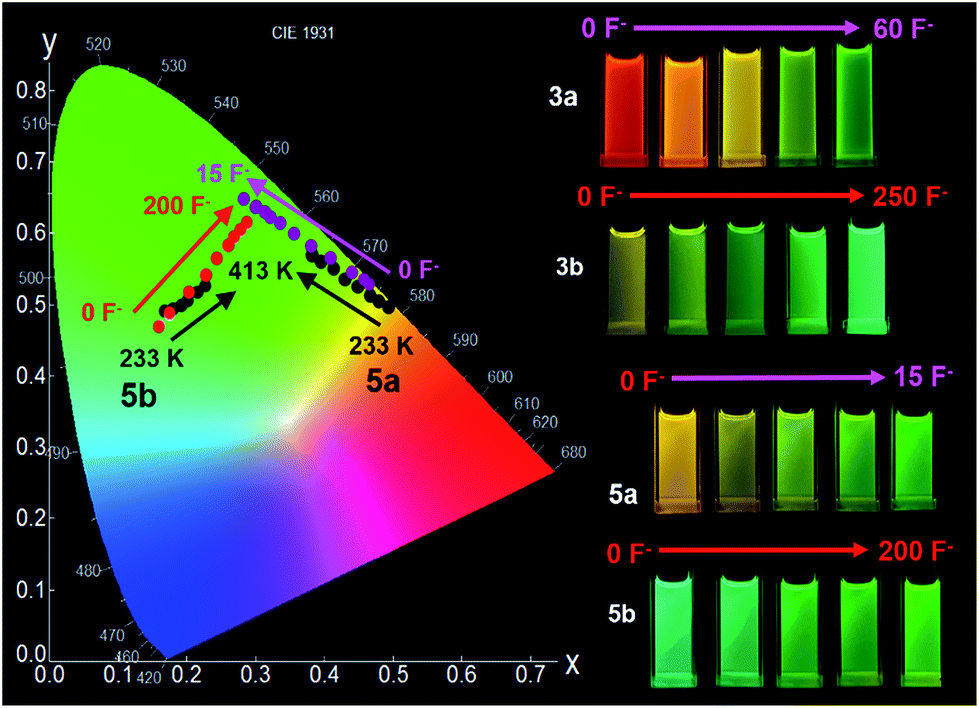
Fluoride titration experiments are commonly used for probing the Lewis acidity and the electronic properties of triarylboron compounds because of their relatively high affinity/selectivity toward fluoride ions.3c,4 This approach is used by us to gauge the relative B←N bond strength in 2a/2b, 3a/3b, and 5a/5b. Both absorption and emission spectra with the addition of NBu4F (TBAF) were recorded and those of 2a/2b and 2a/2b are shown in Fig. 10 (for 5a/5b, see the ESI.†). The addition of ∼10 eq. TBAF to the THF solution of 2a fully converts 2a to its F−-bound open form, accompanied by the emission colour change from yellow to green (Fig. 10). In contrast, for 2b, about 20 eq. TBAF are needed to reach the saturation point with the colour change from blue-green to green. In fact, the change of the emission spectra and the CIE coordinates of 2a and 2b with TBAF is similar to that observed with increasing T (Fig. 9 and 10; and ESI†). For 3a/3b, and 5a/5b, the trend of the emission spectral/CIE coordinates change with TBAF is also parallel to that observed with increasing T (Fig. 11). Because of the tetracoordinate geometry in the F−-bound open form, the boron unit has the +I effect only. Thus, the similar emission spectral change with T and TBAF displayed by the three pairs of regioisomers indicates that the inductive effect exerted by the boron unit likely has a greater role in the distinct photophysical properties of the (a) and (b) isomers. Furthermore, the fluoride titration experiments show that the isomer (a) consistently requires much less TBAF to reach the saturation point than the isomer (b) for all three pairs (10 eq./20 eq. for 2a/2b; ∼60 eq./250 eq. for 3a/3b; ∼15 eq./100 eq. for 5a/5b), which supports the greater stability of the B ← N bond in the (b) isomer, compared to that in the (a) isomer. Notably, compounds 3a, 3b and 5b require much more TBAF, compared to the other isomers, to reach saturation, an indication that the B ← N bond in these three compounds are likely much stronger than those in 2a/2b and 5a. This is in good agreement with the VT 11B NMR data. Based the VT NMR data and the TBAF titration data, the B ← N bond strength follows approximately the order of 2a < 2b ≈ 5a < 3a < 5b < 3b. Clearly both Lewis basicity of the N-heterocycles and the cooperative or uncooperative inductive effect of dichotomic units in the (a) and the (b) isomers are the main contributors to the B ← N strength. Steric/entropy factors must also play a role.
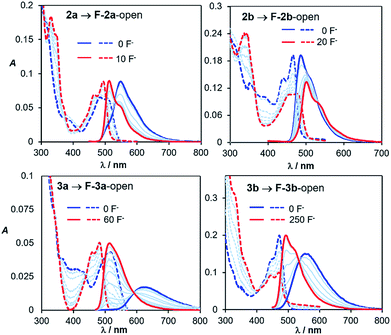 |
| | Fig. 10 Absorption (dashed lines) and emission (solid lines) spectral change of 2a, 2b, 3a and 3b with TBAF addition in THF (1.0 × 10⁻⁵ M). | |
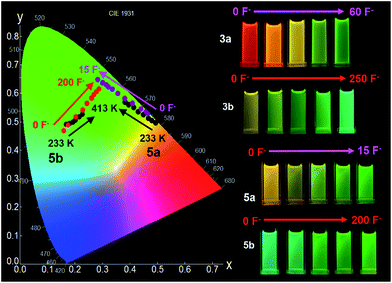 |
| | Fig. 11 Left: a CIE diagram showing the emission colour change of 5a and 5b with T (black dots) in mesitylene and the addition of TBAF (purple and red, respectively) in THF. Right: photographs showing the contrasting emission colour change of 3a/3b and 5a/5b with the addition of TBAF in THF (1.0 × 10⁻⁵ M). | |
Conclusions
5 pairs of regioisomers based on an IDI backbone and dichotomic substituents have been achieved. The distinct electronic/photophysical properties for each pair of the regioisomers have been established. The contrasting impact of the dichotomic substituents to the regioisomers is ascribed to both inductive and mesomeric effects. For compounds that contain an ortho-BMes2 the +I effect appears to dominate. The formation of an internal B ← N bond amplifies the impact of the dichotomic units, leading to a smaller optical energy gap for the (a) isomer and a greater optical gap for the (b) isomer, respectively. The (a) isomers show consistently a weaker B ← N bond than the (b) isomers. This work demonstrates that for π-conjugated systems that have unsymmetrical electron density/orbital distributions on the backbone, utilizing internal B ← N coordination and regioisomerism could be highly effective in tuning the optioelectronic properties of organic materials.
Experimental
General
Solvents was freshly distilled over Na or CaH2 and stored under nitrogen prior to use. Starting materials were purchased from Sun Chemical Technology Co., Ltd. and used without further purification. 2-(2′-(Dimesitylboryl)phenyl-ethynyl)pyridine (2),12 (4-bromophenyl)dimesitylborane,13 2-ethynylpyridine,14 pyrido[1,2-a]isoindole,15 1-dimesitylboryl-2-ethynylbenzene16 were synthesized according to procedures reported in literature. All the reactions were performed under nitrogen and in dry solvent. 1H, 13C and 11B NMR spectra were recorded on a Bruker Ascend 400 or 700 MHz spectrometer. Melting point (m.p.) determination was performed using a SGW X-4A microscopic melting point instrument. UV-vis spectra were obtained on an Agilent Cary 300 UV-vis spectrophotometer. Fluorescence spectra were recorded on an Edinburgh Instruments FLS980 spectrophotometer. High-resolution mass spectra (HRMS) were obtained from an Agilent Q-TOF 6520 LC-MS spectrometer. Fluorescent quantum efficiencies were determined using a Hamamatsu Quantaurus-QY spectrometer (C11347). The electrochemical cell was a standard three-compartment cell composed of a Pt working electrode, a Pt auxiliary electrode, and a Pt wire reference electrode. All measurements were performed using 0.10 M of NBu4PF6 in THF or CH2Cl2 as the supporting electrolyte. The potentials are reported relative to the ferrocene/ferrocenium couple. Analytical thin-layer chromatography was performed on glass plates of Silica Gel GF-254. The synthetic procedures for PhBMes2/M-heterocycle functionalized alkyne starting materials (1, 3–5) are provided in the ESI.†
Synthesis of compound 1a and 1b
Pyrido[1,2-a]isoindole (738 mg, 4.42 mmol) and compound 1 (947 mg, 2.21 mmol) were reacted in toluene (15.0 mL) at 120 °C in a 50 ml sealed tube for 6 days, after the mixture was cooled to room temperature, DDQ (1.10 g, 3.98 mmol) was added. After reacting for 30 min, the solvent was removed under reduced pressure and the product was isolated by column chromatography on neutral alumina using petroleum ether/ethyl acetate (50![[thin space (1/6-em)]](https://www.rsc.org/images/entities/char_2009.gif) :1 to 10:1) as the eluent. The product 1a was isolated as a yellow solid (1.038 g, 79% yield), the product 1b isolated as a yellow solid (30 mg, 2% yield).
:1 to 10:1) as the eluent. The product 1a was isolated as a yellow solid (1.038 g, 79% yield), the product 1b isolated as a yellow solid (30 mg, 2% yield).
1a
.
1H NMR (400 MHz, CDCl3): δ 8.93 (d, J = 4.7 Hz, 1H), 8.70 (d, J = 8.1 Hz, 1H), 8.44 (d, J = 7.9 Hz, 1H), 8.17–8.10 (m, 2H), 7.73 (m, 2H), 7.62–7.52 (m, 6H), 7.43 (d, J = 7.9 Hz, 1H), 7.27–7.24 (m, 1H), 6.86 (s, 4H), 2.33 (s, 6H), 2.11 (s, 12H). 13C NMR (101 MHz, CDCl3): δ 154.74, 149.92, 143.46, 141.84, 140.80, 139.35, 138.50, 137.06, 135.66, 130.30, 129.92, 129.22, 128.74, 128.31, 128.17, 127.28, 126.98, 125.15, 123.52, 122.14, 122.03, 121.68, 121.60, 120.77, 119.13, 115.30, 108.79, 23.51, 21.22. HR-ESIMS (m/z): [M + H]+ calcd. for C43H38BN2, 593.3123; found: 593.3119.
1b
.
1H NMR (400 MHz, CDCl3): δ 8.75 (d, J = 4.4 Hz, 1H), 8.65 (d, J = 8.3 Hz, 1H), 8.44 (d, J = 7.9 Hz, 1H), 8.15–8.08 (m, 2H), 7.82 (t, J = 7.8 Hz, 1H), 7.76 (d, J = 7.7 Hz, 2H), 7.67 (d, J = 7.7 Hz, 2H), 7.64 (t, J = 7.7 Hz, 1H), 7.53 (t, J = 7.5 Hz, 1H), 7.45 (t, J = 7.6 Hz, 1H), 7.22 (d, J = 8.0 Hz, 1H), 7.13-7.07 (m, 1H), 6.87 (s, 4H), 2.34 (s, 6H), 2.13 (s, 12H). 13C NMR (176 MHz, CDCl3): δ 155.38, 149.71, 144.95, 141.77, 140.85, 139.14, 138.71, 136.86, 135.66, 135.46, 130.07, 129.80, 129.33, 128.40, 128.37, 128.25, 128.15, 127.82, 123.90, 123.33, 122.53, 121.84, 120.88, 120.05, 119.47, 118.04, 117.25, 108.92, 23.54, 21.24. HR-ESIMS (m/z): [M + H]+ calcd. for C43H38BN2, 593.3123; found: 593.3122.
Synthesis of compounds 2a and 2b
Pyrido[1,2-a]isoindole (558 mg, 3.34 mmol) and compound 2 (476 mg, 1.11 mmol) were reacted in toluene (20.0 mL) at 120 °C in a 50 ml seal tube for 7 days, after the mixture was cooled to room temperature, DDQ (759 mg, 3.34 mmol) was added. After reacting 30 min, the solvent was removed in vacuo and the product was isolated by column chromatography on neutral alumina using petroleum ether/ethyl acetate (50:1 to 10:1) as the eluent. Product 2a was isolated as an orange solid (541 mg, 82% yield), product 2b was isolated as a yellow solid (27 mg, 4% yield).
2a
.
1H NMR (400 MHz, CDCl3): δ 9.21 (d, J = 5.6 Hz, 1H), 8.42 (d, J = 7.9 Hz, 1H), 8.16 (d, J = 7.8 Hz, 1H), 8.03 (m, 3H), 7.91 (t, J = 7.5 Hz, 1H), 7.86 (d, J = 7.4 Hz, 1H), 7.71–7.63 (m, 2H), 7.60–7.50 (m, 2H), 7.47 (td, J = 7.4, 1.0 Hz, 1H), 7.38–7.30 (m, 1H), 7.28–7.24 (m, 1H), 7.00 (s, 1H), 6.81 (s, 1H), 5.35 (s, 1H), 5.20 (s, 1H), 2.35 (s, 3H), 1.89 (s, 6H), 1.31 (s, 6H), 0.99 (s, 3H). 13C NMR (176 MHz, CDCl3): δ 155.16, 154.02, 150.42, 147.46, 145.34, 144.73, 141.86, 140.80, 138.71, 138.53, 138.24, 138.04, 136.12, 132.26, 130.15, 129.66, 129.18, 128.84, 128.57, 128.53, 127.77, 127.66, 127.14, 126.56, 126.33, 125.76, 125.34, 123.97, 122.71, 122.15, 121.02, 120.64, 119.91, 119.08, 116.46, 109.07, 27.15, 25.40, 24.41, 22.88, 20.89, 19.38.11B NMR (225 MHz, CDCl3): δ 22.5. HR-ESIMS (m/z): [M + H]+ calcd. for C43H38BN2, 593.3123; found: 593.3148.
2b
.
1H NMR (400 MHz, CDCl3): δ 9.16 (d, J = 6.0 Hz, 1H), 8.41 (d, J = 7.9 Hz, 1H), 8.27 (d, J = 8.0 Hz, 1H), 8.06–7.87 (m, 4H), 7.83 (d, J = 8.2 Hz, 1H), 7.77–7.65 (m, 2H), 7.62–7.52 (m, 2H), 7.48 (td, J = 7.4, 1.0 Hz, 1H), 7.32–7.27 (m, 1H), 7.25–7.20 (m, 1H), 7.10 (s, 1H), 6.86 (s, 1H), 5.38 (s, 1H), 5.03 (s, 1H), 2.38 (s, 3H), 2.03 (s, 3H), 1.88 (s, 3H), 1.24 (s, 3H), 1.15 (s, 3H), 1.00 (s, 3H). 13C NMR (176 MHz, CDCl3): δ 156.97, 153.45, 150.71, 148.74, 146.06, 145.47, 141.93, 141.58, 138.89, 138.40, 138.35, 137.26, 135.56, 134.55, 131.53, 130.55, 130.12, 130.00, 129.50, 128.97, 128.67, 128.19, 128.18, 127.98, 126.69, 126.58, 126.26, 126.11, 123.23, 122.14, 121.71, 120.81, 119.47, 119.39, 115.32, 113.10, 108.25, 27.75, 25.98, 24.44, 22.92, 20.87, 19.41. 11B NMR (225 MHz, CDCl3): δ 10.3. HR-ESIMS (m/z): [M + H]+ calcd. for C43H38BN2, 593.3123; found: 593.3112.
Synthesis of compound 3a and 3b
Pyrido[1,2-a]isoindole (140 mg, 0.84 mmol) and compound 3 (134 mg, 0.28 mmol) were reacted in toluene (10.0 mL) at 120 °C in a 50 ml seal tube for 6 days, after the mixture was cooled to room temperature, DDQ (191 mg, 0.84 mmol) was added. After reacting 30 min, the volatiles were removed in vacuo and the product was isolated by column chromatography using petroleum ether/toluene (20:1 to 5:1) as the eluent. Product 3a was isolated as a red solid (130 mg, 72% yield), product 3b was isolated as a yellow solid (33 mg, 18% yield).
3a
.
1H NMR (700 MHz, CDCl3): δ 9.17 (d, J = 7.0 Hz, 1H), 8.53 (d, J = 8.7 Hz, 1H), 8.41 (d, J = 7.9 Hz, 1H), 8.10 (d, J = 8.2 Hz, 1H), 8.07 (d, J = 7.2 Hz, 1H), 7.99 (d, J = 8.2 Hz, 1H), 7.88 (t, J = 7.5 Hz, 1H), 7.82 (d, J = 7.3 Hz, 1H), 7.77–7.69 (m 2H), 7.59 (d, J = 7.8 Hz, 1H), 7.51–7.43 (m, 2H), 7.38 (t, J = 7.3 Hz, 1H), 7.35 (t, J = 7.6 Hz, 1H), 7.17 (t, J = 7.5 Hz, 1H), 7.14 (s, 1H), 6.88 (s, 1H), 6.50 (d, J = 8.0 Hz, 1H), 5.23 (s, 1H), 4.82 (s, 1H), 2.41 (s, 3H), 2.03 (s, 3H), 1.81 (s, 3H), 1.13 (s, 6H), 1.02 (s, 3H). 13C NMR (176 MHz, CDCl3): δ 158.71, 155.89, 148.79, 146.34, 146.21, 142.59, 141.99, 140.68, 139.38, 138.13, 137.46, 136.39, 135.31, 133.01, 131.45, 130.69, 130.58, 130.17, 128.92, 128.86, 128.84, 128.81, 128.65, 127.82, 127.60, 127.36, 126.88, 126.29, 126.10, 126.01, 125.88, 125.12, 123.22, 122.58, 122.01, 120.19, 119.06, 118.95, 116.98, 109.86, 28.22, 26.15, 24.64, 24.59, 20.87, 19.49. 11B NMR (225 MHz, CDCl3): δ 6.2. HR-ESIMS (m/z): [M + H]+ calcd. for C47H40BN2, 643.3285; found: 643.3260.
3b
.
1H NMR (400 MHz, CDCl3): δ 9.04 (d, J = 7.1 Hz, 1H), 8.40 (m, 1H), 8.38 (m, 1H), 8.24 (d, J = 8.0 Hz, 1H), 8.00 (d, J = 7.4 Hz, 1H), 7.94 (d, J = 7.4 Hz, 1H), 7.90 (d, J = 8.1 Hz, 1H), 7.84 (t, J = 7.4 Hz, 1H), 7.69 (t, J = 7.6 Hz, 1H), 7.66–7.54 (m, 4H), 7.54–7.49 (m, 1H), 7.45 (t, J = 7.3 Hz, 1H), 7.24-7.22 (m, 1H), 7.13 (s, 1H), 7.07 (d, J = 8.3 Hz, 1H), 6.87 (s, 1H), 5.09 (s, 1H), 5.02 (s, 1H), 2.40 (s, 3H), 2.01 (s, 3H), 1.83 (s, 3H), 1.18 (s, 3H), 1.10 (s, 3H), 1.00 (s, 3H). 13C NMR (176 MHz, CDCl3): δ 158.75, 155.79, 148.97, 146.27, 146.17, 142.58, 142.11, 141.00, 139.30, 137.82, 137.26, 136.85, 136.81, 135.25, 132.88, 132.26, 130.62, 130.55, 130.41, 130.14, 130.11, 129.15, 129.11, 128.89, 128.63, 128.33, 127.48, 127.44, 126.27, 125.78, 125.68, 125.66, 123.47, 122.08, 121.91, 121.49, 119.36, 117.65, 114.16, 112.44, 108.16, 27.99, 26.14, 24.59, 24.57, 20.87, 19.47. 11B NMR (128 MHz, CDCl3): δ 4.6. HR-ESIMS (m/z): [M + H]+ calcd. for C47H40BN2, 643.3285; found: 643.3267.
Synthesis of compound 4a and 4b
Pyrido[1,2-a]isoindole (86 mg, 0.51 mmol) and compound 4 (100 mg, 0.21 mmol) were reacted in toluene (10.0 mL) at 120 °C in a 50 ml seal tube for 5 days, after the mixture was cooled to room temperature, DDQ (117 mg, 0.51 mmol) was added. After reacting 30 min, the solvent was removed in vacuo and the product was isolated by column chromatography using petroleum ether/CH2Cl2 (5:1) as the eluent. Product 4a was isolated as a yellow solid (83 mg, 62% yield), product 4b was isolated as a yellow solid (25 mg, 19% yield).
4a
.
1H NMR (400 MHz, CDCl3): δ 9.12 (d, J = 6.5 Hz, 1H), 8.40 (d, J = 7.9 Hz, 1H), 8.24 (d, J = 8.1 Hz, 1H), 7.98 (d, J = 7.2 Hz, 1H), 7.89 (d, J = 7.4 Hz, 1H), 7.78 (m, 2H), 7.74–7.66 (m, 2H), 7.65-7.45 (m, 5H), 7.34 (t, J = 7.5 Hz, 1H), 6.14 (s, 4H), 2.38–1.18 (m, 18H). 13C NMR (176 MHz, CDCl3): δ 163.03, 153.51, 150.37, 141.98, 139.61, 136.77, 136.17, 133.37, 130.49, 129.90, 128.92, 128.10, 127.79, 127.49, 125.79, 124.45, 123.40, 123.00, 122.26, 121.69, 121.18, 119.57, 116.06, 108.81, 22.86, 20.74.HR-ESIMS (m/z): [M + H]+ calcd. for C45H38BN2S, 649.2849; found: 649.2840.
4b
.
1H NMR (400 MHz, CDCl3): δ 8.67 (s, 1H), 8.34 (d, J = 7.8 Hz, 1H), 8.06 (s, 1H), 8.02–7.93 (m, 2H), 7.91–7.79 (m, 2H), 7.77 (t, J = 7.4 Hz, 1H), 7.73–7.50 (m, 5H), 7.43 (t, J = 7.5 Hz, 1H), 7.31–7.21 (m, 1H), 6.58 (m, 2H), 5.55 (s, 1H), 5.10 (s, 1H), 2.17 (s, 3H), 1.98–1.35 (m, 15H). 13C NMR (176 MHz, CDCl3): δ 163.22, 153.77, 148.63, 142.49, 142.26, 141.80, 141.34, 140.37, 139.05, 137.71, 137.49, 137.10, 135.76, 135.32, 131.34, 130.81, 130.35, 130.22, 129.37, 128.25, 128.15, 127.51, 127.37, 126.11, 125.58, 123.60, 123.36, 122.96, 122.19, 122.05, 120.86, 120.22, 116.30, 115.33, 109.11, 23.79, 22.45, 21.01, 20.59. HR-ESIMS (m/z): [M + H]+ calcd. for C45H38BN2S, 649.2849; found: 649.2829.
Synthesis of compound 5a and 5b
Pyrido[1,2-a]isoindole (694 mg, 4.16 mmol) and compound 5 (720 mg, 1.66 mmol) were reacted in toluene (25.0 mL) at 120 °C in a 50 ml seal tube for 5 days, after the mixture was cooled to room temperature, DDQ (943 mg, 4.16 mmol) was added. After reacting 30 min, the solvent was removed in vacuo and the product was isolated by column chromatography using petroleum ether/ethyl acetate (20:1) or petroleum ether/CH2Cl2 (5:1) as the eluent. Product 5a was isolated as a red solid (558 mg, 68% yield), product 5b was isolated as a yellow solid (262 mg, 14% yield).
5a
.
1H NMR (400 MHz, CDCl3): δ 8.40 (m, 2H), 8.20 (s, 1H), 8.12 (d, J = 8.4 Hz, 1H), 8.05 (d, J = 7.2 Hz, 1H), 7.81 (d, J = 7.5 Hz, 1H), 7.69 (m, 2H), 7.55 (m, 2H), 7.39 (t, J = 7.4 Hz, 1H), 7.31 (d, J = 3.9 Hz, 1H), 7.26–7.18 (m, 1H), 7.05 (s, 1H), 6.82 (s, 1H), 5.39 (s, 1H), 5.19 (s, 1H), 2.35 (s, 3H), 2.08 (s, 3H), 1.93 (s, 3H), 1.38 (s, 3H), 1.22 (s, 3H), 0.89 (s, 3H). 13C NMR (176 MHz, CDCl3): δ 164.58, 157.25, 149.54, 145.86, 144.45, 142.71, 142.00, 139.34, 138.85, 136.79, 135.55, 131.47, 130.11, 129.17, 128.70, 128.60, 128.33, 128.11, 127.12, 126.55, 126.38, 126.20, 125.97, 125.87, 123.39, 122.36, 120.71, 120.58, 118.80, 117.48, 116.13, 114.81, 109.97, 27.36, 25.93, 24.44, 22.74, 20.92, 19.23. 11B NMR (128 MHz, CDCl3): δ 7.7. HR-ESIMS (m/z): [M + H]+ calcd. for C41H36BN2S, 599.2692; found: 599.2686.
5b
.
1H NMR (400 MHz, CDCl3): δ 8.40 (d, J = 8.0 Hz, 1H), 8.33 (d, J = 8.1 Hz, 1H), 8.20–7.98 (m, 4H), 7.80 (t, J = 8.0 Hz, 1H), 7.72 (t, J = 7.7 Hz, 1H), 7.64 (d, J = 7.8 Hz, 1H), 7.59 (t, J = 7.6 Hz, 1H), 7.45 (t, J = 7.4 Hz, 1H), 7.31 (t, J = 7.5 Hz, 1H), 7.15 (s, 1H), 7.11 (s, 1H), 6.86 (s, 1H), 5.47 (s, 1H), 5.23 (s, 1H), 2.39 (s, 3H), 2.17 (s, 3H), 1.97 (s, 3H), 1.37 (s, 3H), 1.23 (s, 3H), 0.97 (s, 3H). 13C NMR (176 MHz, CDCl3): δ 163.87, 158.63, 150.49, 146.06, 145.47, 144.85, 143.05, 142.90, 139.29, 139.00, 136.43, 135.49, 135.38, 131.40, 130.38, 130.36, 130.32, 130.29, 129.43, 129.28, 128.88, 128.21, 127.07, 126.88, 125.99, 125.80, 124.10, 123.13, 122.48, 121.39, 119.89, 113.67, 112.65, 108.75, 27.47, 26.17, 24.57, 22.74, 21.02, 19.40. 11B NMR (128 MHz, CDCl3): δ 3.3. HR-ESIMS (m/z): [M + H]+ calcd. for C41H36BN2S, 599.2692; found: 599.2683.
Computational Study
DFT and TD-DFT calculations were performed using the Gaussian 09 suite of programs.17 Geometry optimizations of all compounds were obtained at the M06-2X18/6-31g(d)19 level of theory using Polarizable Continuum Models (PCMs) and the resulting structures were confirmed to be stationary points through vibrational frequency analysis. The Natural Bond Orbital (NBO)20 analysis were performed at the same level of theory, 11B-NMR of 2a/2a-open was obtained at the B97221/def2TZVP22 level of theory in CHCl3 using SMD.23 All the calculations were performed at 298 K. Orbital composition analysis with Ros-Schuit (C-squared Population Analysis, SCPA) method using Multiwfn software version 3.424 Electrostatic potential (ESP) charge calculated according to Merz-Kollman (MK) Methods.25
Single-crystal X-ray Diffraction Analysis
The crystal data were collected on a Bruker D8-Venture diffractometer with Mo-target (λ = 0.71073 Å) at 180 K for all compounds. Data were processed on a PC with the aid of the Bruker SHELXTL software package and corrected for absorption effects. All non-hydrogen atoms were refined anisotropically. The positions of hydrogen atoms were calculated and refined isotropically. The crystal data were deposited to the Cambridge Crystallographic Data Centre with deposition numbers of CCDC 1839688 (B1a), 1839689 (B1b), 1839690 (B2a), 1839691 (B2b), 1839692 (B3b), 1839693 (B3a), 1839694 (B4a), 1839695 (B4b), 1854311 (B5a), 1853312 (B5b). This data can be obtained free of charge from the Cambridge Crystallographic Data Centre viawww.ccdc.cam.ac.uk/data_request/cif.
Conflicts of interest
There are no conflicts to declare.
Acknowledgements
The authors thank the Natural Science Foundation of China (grants 21507017, 21701011, 21761132020) and the Natural Science and Engineering Research Council of Canada (RGPIN1193993-2013) for financial supports.
Notes and references
-
(a) A. D. Faulkner, R. A. Kaner, Q. M. Abdallah, G. Clarkson, D. J. Fox, P. Gurnani, S. E. Howson, R. M. Phillips, D. I. Roper, D. H. Simpson and P. Scott, Nat. Chem., 2014, 6, 797 CrossRef CAS
 ;
(b) K. Nakamura, A. Greenwood, L. Binder, E. H. Bigio, S. Denial, L. Nicholson, X. Z. Zhou and K. P. Lu, Cell, 2012, 149, 232 CrossRef CAS .
;
(b) K. Nakamura, A. Greenwood, L. Binder, E. H. Bigio, S. Denial, L. Nicholson, X. Z. Zhou and K. P. Lu, Cell, 2012, 149, 232 CrossRef CAS .
-
(a) J. Wang, J. Mei, R.-R. Hu, J. Z. Sun, A. Qin and B. Z. Tang, J. Am. Chem. Soc., 2012, 134, 9956 CrossRef CAS PubMed ;
(b) O. Anamimoghadam, M. D. Symes, D. L. Long, S. Sproules, L. Cronin and G. Bucher, J. Am. Chem. Soc., 2015, 137, 14944 CrossRef CAS PubMed ;
(c) D.-Y. Chen, W. Liu, C.-J. Zheng, K. Wang, F. Li, S.-L. Tao, X.-M. Ou and X.-H. Zhang, ACS Appl. Mater. Interfaces, 2016, 8, 16791 CrossRef CAS PubMed ;
(d) A. Takai, Z.-H. Chen, X.-G. Yu, N.-J. Zhou, T. J. Marks and A. Facchetti, Chem. Mater., 2016, 28, 5772 CrossRef CAS ;
(e) B. S. Young, D. T. Chase, J. L. Marshall, C. L. Vonnegut, L. N. Zakharov and M. M. Haley, Chem. Sci., 2014, 5, 1008 RSC ;
(f) S. Zhang, X. Qiao, Y. Chen, Y. Wang, R. M. Edkins, Z. Liu, H. Li and Q. Fang, Org. Lett., 2014, 16, 342 CrossRef CAS PubMed .
-
(a) L. Ji, S. Griesbeck and T. B. Marder, Chem. Sci., 2017, 8, 846 RSC ;
(b) D. Li, H. Zhang and Y. Wang, Chem. Soc. Rev., 2013, 42, 8416 RSC ;
(c) F. Jäkle, Chem. Rev., 2010, 110, 3985 CrossRef PubMed ;
(d) E. von Grotthuss, A. John, T. Kaese and M. Wagner, Asian J. Org. Chem., 2018, 7, 37 CrossRef CAS .
-
(a) C. R. Wade, A. E. J. Broomsgrove, S. Aldridge and F. P. Gabbai, Chem. Rev., 2010, 110, 3958 CrossRef CAS PubMed ;
(b) T. W. Hudnall, C. W. Chiu and F. P. Gabbaï, Acc. Chem. Res., 2009, 42, 388 CrossRef CAS PubMed ;
(c) J. Chen and O. S. Wenger, Chem. Sci., 2015, 6, 3582 RSC ;
(d) P. Chen, R. A. Lalancette and F. Jäkle, Angew. Chem., Int. Ed., 2012, 51, 7994 CrossRef CAS PubMed .
-
(a) Y.-L. Rao, H. Amarne, S.-B. Zhao, T. M. McCormick, S. Martic, R.-Y. Wang and S. Wang, J. Am. Chem. Soc., 2008, 130, 12898 CrossRef CAS PubMed ;
(b) Y.-L. Rao, H. Amarne and S. Wang, Coord. Chem. Rev., 2012, 256, 759 CrossRef CAS ;
(c) A. Iida, S. Saito, T. Sasamori and S. Yamaguchi, Angew. Chem., Int. Ed., 2013, 52, 3760 CrossRef CAS ;
(d) H. Wang, J. Zhang and Z. Xie, Angew. Chem., Int. Ed., 2017, 56, 9198 CrossRef CAS ;
(e) N. Kano, J. Yoshino and T. Kawashima, Org. Lett., 2005, 7, 3909 CrossRef CAS PubMed ;
(f) J. Yoshino, N. Kano and T. Kawashima, Tetrahedron, 2008, 64, 7774 CrossRef CAS ;
(g) S. K. Mellerup, C. Li, T. Peng and S. Wang, Angew. Chem., Int. Ed., 2017, 56, 6093 CrossRef CAS PubMed ;
(h) N. Ando, A. Fukazawa, T. Kushida, Y. Shiota, S. Itoyama, K. Yoshizawa, Y. Matsui, Y. Kuramoto, H. Ikeda and S. Yamaguchi, Angew. Chem., Int. Ed., 2017, 56, 12210 CrossRef CAS PubMed .
-
(a) Q. Wu, M. Esteghamatian, N. X. Hu, Z. Popovic, G. Enright, S. R. Breeze and S. Wang, Angew. Chem., Int. Ed., 1999, 38, 985 CrossRef CAS ;
(b) A. Wakamiya, T. Taniguchi and S. Yamaguchi, Angew. Chem., Int. Ed., 2006, 45, 3170 CrossRef CAS PubMed ;
(c) C. Reus, S. Weidlich, M. Bolte, H. W. Lerner and M. Wagner, J. Am. Chem. Soc., 2013, 135, 12892 CrossRef CAS PubMed ;
(d) D. R. Levine, M. A. Siegler and J. D. Tovar, J. Am. Chem. Soc., 2014, 136, 7132 CrossRef CAS PubMed ;
(e) S. M. Barbon, V. N. Staroverov and J. B. Gilroy, Angew. Chem., Int. Ed., 2017, 56, 8173 CrossRef CAS ;
(f) A. John, M. Bolte, H. W. Lerner and M. Wagner, Angew. Chem., Int. Ed., 2017, 56, 5588 CrossRef CAS .
-
(a) Y. Cao, J. K. Nagle, M. O. Wolf and B. O. Patrick, J. Am. Chem. Soc., 2015, 137, 4888 CrossRef CAS PubMed ;
(b) H. Shimogawa, O. Yoshikawa, Y. Aramaki, M. Murata, A. Wakamiya and Y. Murata, Chem.–Eur. J., 2017, 23, 3784 CrossRef CAS PubMed ;
(c) Y.-G. Shi, J.-W. Wang, H. Li, G.-F. Hu, X. Li, S. K. Mellerup, N. Wang, T. Peng and S. Wang, Chem. Sci., 2018, 9, 1902 RSC .
-
(a) K. L. Liu, R. A. Lalancette and F. Jäkle, J. Am. Chem. Soc., 2017, 139, 18170 CrossRef CAS PubMed ;
(b) C. Zhu, Z.-H. Guo, A. U. Mu, Y. Liu, S. E. Wheeler and L. Fang, J. Org. Chem., 2016, 81, 4347 CrossRef CAS ;
(c) Y. Min, C. Dou, H. Tian, Y. Geng, J. Liu and L. Wang, Angew. Chem., Int. Ed., 2018, 57, 2000 CrossRef CAS PubMed ;
(d) D.-T. Yang, S. Wang, J. Lu, H. Shimogawa, S. Gong, X. Wang, S. K. Mellerup, A. Wakamiya, Y.-L. Chang, C. Yang and Z.-H. Lu, Angew. Chem., Int. Ed., 2015, 54, 15074 CrossRef PubMed .
-
(a) T. Mitsumori, M. Bendikov, O. Dautel, F. Wudl, T. Shioya, H. Sato and Y. Sato, J. Am. Chem. Soc., 2004, 126, 16793 CrossRef CAS PubMed ;
(b) D.-T. Yang, J. Radtke, S. K. Mellerup, K. Yuan, X. Wang, M. Wagner and S. Wang, Org. Lett., 2015, 17, 2486 CrossRef CAS PubMed .
-
R. Bruckner, Advanced Organic Chemistry, Reaction Mechanisms, Elsevier, 2002, p. 504 Search PubMed .
-
(a) M. Homma, Y. Takei, A. Murata, T. Inoue and S. Takeoka, Chem. Commun., 2015, 51, 6194 RSC ;
(b) J. Liu, X. Guo, R. Hu, J. Xu, S. Wang, S. Li, Y. Li and G. Yang, Anal. Chem., 2015, 87, 3694 CrossRef CAS ;
(c) H. Zhang, J. Jiang, P. Gao, T. Yang, K. Y. Zhang, Z. Chen, S. Liu, W. Huang and Q. Zhao, ACS Appl. Mater. Interfaces, 2018, 10, 17542 CrossRef CAS PubMed .
- C. Sun, J. Lu and S. Wang, Org. Lett., 2011, 13, 1226 CrossRef CAS PubMed .
- A. K. C. Mengel, B. He and O. S. Wenger, J. Org. Chem., 2012, 77, 6545 CrossRef CAS PubMed .
- B. T. Holmes, W. T. Pennington and T. W. Hanks, Synth. Commun., 2003, 33, 2447 CrossRef CAS .
- S. Kajigaeshi, S. Mori, S. Fujisaki and S. Kanemasa, Bull. Chem. Soc. Jpn., 1985, 58, 3547 CrossRef CAS .
- A. Fukazawa, H. Yamada and S. Yamaguchi, Angew. Chem., Int. Ed., 2008, 47, 5582 CrossRef CAS PubMed .
-
M. J. Frisch, G. W. Trucks, H. B. Schlegel, G. E. Scuseria, M. A. Robb, J. R. Cheeseman, G. Scalmani, V. Barone, G. A. Petersson, H. Nakatsuji, X. Li, M. Caricato, A. Marenich, J. Bloino, B. G. Janesko, R. Gomperts, B. Mennucci, H. P. Hratchian, J. V. Ortiz, A. F. Izmaylov, J. L. Sonnenberg, D. Williams-Young, F. Ding, F. Lipparini, F. Egidi, J. Goings, B. Peng, A. Petrone, T. Henderson, D. Ranasinghe, V. G. Zakrzewski, J. Gao, N. Rega, G. Zheng, W. Liang, M. Hada, M. Ehara, K. Toyota, R. Fukuda, J. Hasegawa, M. Ishida, T. Nakajima, Y. Honda, O. Kitao, H. Nakai, T. Vreven, K. Throssell, J. A. Montgomery Jr, J. E. Peralta, F. Ogliaro, M. Bearpark, J. J. Heyd, E. Brothers, K. N. Kudin, V. N. Staroverov, T. Keith, R. Kobayashi, J. Normand, K. Raghavachari, A. Rendell, J. C. Burant, S. S. Iyengar, J. Tomasi, M. Cossi, J. M. Millam, M. Klene, C. Adamo, R. Cammi, J. W. Ochterski, R. L. Martin, K. Morokuma, O. Farkas, J. B. Foresman, and D. J. Fox, Gaussian 09, Revision A.02, Gaussian, Inc., Wallingford CT, 2016 Search PubMed .
- Y. Zhao and D. G. Truhlar, Theor. Chem. Acc., 2008, 120, 215 Search PubMed .
-
(a) G. A. Petersson, A. Bennett, T. G. Tensfeldt, M. A. Al-Laham, W. A. Shirley and J. Mantzaris, J. Chem. Phys., 1988, 89, 2193 CrossRef CAS ;
(b) G. A. Petersson and M. A. Al-Laham, J. Chem. Phys., 1991, 94, 6081 CrossRef CAS .
-
E. D. Glendening, A. E. Reed, J. E. Carpenter and F. Weinhold, NBO Version 3.1 Search PubMed .
- P. J. Wilson, T. J. Bradley and D. J. Tozer, J. Chem. Phys., 2001, 115, 9233 CrossRef CAS .
-
(a) F. Weigend and R. Ahlrichs, Phys. Chem. Chem. Phys., 2005, 7, 3297 RSC ;
(b) F. Weigend, Phys. Chem. Chem. Phys., 2006, 8, 1057 RSC .
- A. V. Marenich, C. J. Cramer and D. G. Truhlar, J. Phys. Chem. B, 2009, 113, 6378 CrossRef CAS PubMed .
- T. Lu and F. Chen, J. Comput. Chem., 2012, 33, 580 CrossRef CAS PubMed .
- B. H. Besler, K. M. Merz Jr and P. A. Kollman, J. Comput. Chem., 1990, 11, 431 CrossRef CAS .
|
| This journal is © The Royal Society of Chemistry 2019 |
Click here to see how this site uses Cookies. View our privacy policy here. 
 Open Access Article
 This Open Access Article is licensed under a Creative Commons Attribution-Non Commercial 3.0 Unported Licence
 b and
Suning
Wang
b and
Suning
Wang