 Open Access Article
Chemical CD oscillation and chemical resonance phenomena in a competitive self-catalytic reaction system: a single temperature oscillation induces CD oscillations twice†
Tsukasa
Sawato
,
Yasuhiro
Shinozaki
,
Nozomi
Saito
and
Masahiko
Yamaguchi
 *
*
Department of Organic Chemistry, Graduate School of Pharmaceutical Sciences, Tohoku University, Aoba, Sendai 980-8578, Japan. E-mail: yama@m.tohoku.ac.jp; Fax: +81-22-795-6811
First published on 30th November 2018
Abstract
Chemical CD oscillation and chemical resonance phenomena appear in a competitive chemical reaction system involving amplification. A pseudoenantiomeric mixture of an aminomethylenehelicene (P)-tetramer and an (M)-hexamer in toluene forms three states, namely hetero-double-helix B, hetero-double-helix C, and dissociated random-coil 2A. When the temperature of the solution is oscillated between −5 and 38 °C at a rate of 2 K min−1, Δε reaches maxima twice during a single temperature oscillation, which is called a chemical CD oscillation phenomenon. The phenomenon arises from the sharp competition between the two self-catalytic 2A + C-to-2C and 2A + B-to-2B reactions. In addition, the chemical CD oscillation appears, when temperature oscillation occurs at a rate of 2 K min−1, and higher and lower rates provide a single maximum, a process referred to as the chemical resonance phenomenon. The changes in concentration induced by temperature oscillation repeatedly crossed equilibrium.
Introduction
A chemical reaction is generally conducted under constant temperature (isothermal) conditions. It is not common to introduce temperature changes during a chemical reaction.1–3 Oscillation is an interesting phenomenon in nature, in which the strength or direction of a process regularly changes,4,5 and introducing temperature oscillation during a chemical reaction can result in interesting phenomena.6–10 Such studies, however, have not been conducted in a systematic manner. When temperature oscillation is introduced in an irreversible chemical reaction, the reaction rate changes in accordance with the rate constant k = A![[thin space (1/6-em)]](https://www.rsc.org/images/entities/char_2009.gif) exp(−Ea/RT) according to chemical kinetics, in which A, Ea, R, and T are the frequency factor, activation energy, gas constant, and absolute temperature, respectively. Temperature oscillation both increases and decreases k, and the reaction rate increases on heating and decreases on cooling, during which the reaction proceeds in the same direction. The effect of temperature oscillation on an irreversible chemical reaction is relatively small.
exp(−Ea/RT) according to chemical kinetics, in which A, Ea, R, and T are the frequency factor, activation energy, gas constant, and absolute temperature, respectively. Temperature oscillation both increases and decreases k, and the reaction rate increases on heating and decreases on cooling, during which the reaction proceeds in the same direction. The effect of temperature oscillation on an irreversible chemical reaction is relatively small.
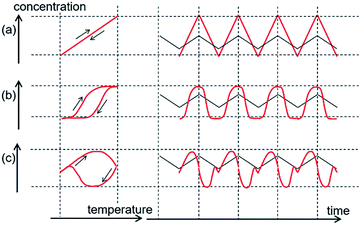
Temperature oscillation can also be considered for a chemical equilibrium, which is a reversible chemical reaction. The reaction can proceed in forward and backward directions depending on the temperature. The effect of temperature oscillation is expressed by the change in the equilibrium constant K = exp(−ΔG/RT), in which ΔG is the free energy difference between substrates and products. Temperature oscillation induces K oscillation, in which the ratio of the forward to backward reaction rate oscillates. Because K is unique for a single temperature, the same curve is obtained in concentration/temperature profiles for heating and cooling, and concentration changes synchronize with temperature oscillation as shown in concentration/time profiles (Fig. 1a). The chemical reaction rate in response to temperature oscillation is very fast in such systems compared with the rate of temperature oscillation.
When the chemical reaction rate in response to temperature oscillation is lower than the rate of temperature oscillation, time delay phenomena appear. Temperature/concentration profiles exhibit thermal hysteresis, in which cooling and heating result in different curves (Fig. 1b). Nonlinear phenomena can appear, as shown in temperature/time profiles.
Complexity is enhanced when a competitive amplification reaction system is subjected to temperature oscillation. In this study, we describe such a phenomenon, in which a single temperature oscillation provides two concentration maxima, as shown in concentration/time profiles by CD (circular dichroism spectroscopy) (Fig. 1c). The phenomenon results from competition between two self-catalytic reactions that provide different products, for which time delay responses are amplified. This can be regarded as the chemical CD oscillation of temperature oscillation to concentration oscillation, and a single temperature oscillation input is converted into a CD oscillation output twice by a chemical reaction. In addition, the chemical resonance phenomenon arises, in which the temperature oscillation rate plays a critical role in the chemical CD oscillation. It should be noted that these phenomena are caused by molecules dispersed in solution without forming higher aggregates.11,12 Chemical oscillations such as the Belousov–Zhabotinsky reaction under isothermal conditions have been known,13–16 and the present phenomena describe concentration oscillation in response to temperature oscillation.
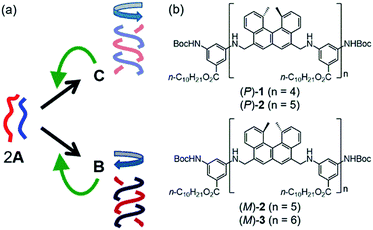
We previously reported that a pseudoenantiomeric mixture of aminomethylenehelicene (P)-tetramer (P)-1 and (M)-pentamer (M)-2 (Fig. 2b) in dilute solution exhibited three-state structural changes between random-coil 2A, hetero-double-helix B, and hetero-double-helix C.17–20B and C are enantiomeric with regard to the three-dimensional structures of right-handed and left-handed helices, and B shows a negative Cotton effect at 315 nm and C a positive one in CD (Fig. 2a). The thermodynamic stability of the (M)-1/(P)-2 system reverses in response to temperature change: at high temperatures, a solution of 2A is thermodynamically the most stable; at low temperatures, a solution of C is the most stable. Then, B solution is metastable. The (M)-1/(P)-2 system exhibited unusual chemical phenomena such as molecular thermal hysteresis,17 chiral symmetry breaking,18 a homogeneous–heterogeneous transition,19 and shortcut pathways,20 which were derived from the competition between the self-catalytic 2A + B-to-2B and 2A + C-to-2C reactions that provided different products B and C in an amplified manner, respectively (Fig. 2a). This study shows chemical CD oscillation and chemical resonance phenomena in a mixture of (P)-1 and (M)-hexamer (M)-3, which did not appear in the previously studied (M)-1/(P)-2 system. The notable phenomena of the (P)-1/(M)-3 system were ascribed to the competition between self-catalytic reactions with different sensitivities.
Results and discussion
Determination of hetero-double-helix formation
It was initially confirmed that the (P)-1/(M)-3 system exhibited three-state structural changes between random-coil 2A, hetero-double-helix B, and hetero-double-helix C. A 1![[thin space (1/6-em)]](https://www.rsc.org/images/entities/char_2009.gif) :
:![[thin space (1/6-em)]](https://www.rsc.org/images/entities/char_2009.gif) 1 mixture of (P)-1 and (M)-3 (total 0.25 mM) in toluene at 70 °C was in the dissociated state 2A, which produced a weak Cotton effect (Fig. S1a†). Cooling the solutions to 5 °C caused a negative Cotton effect to appear at 315 nm. UV-vis showed a decrease in intensity and a shift of the absorption maximum from 295 nm to 305 nm (Fig. S1b†). These results are consistent with hetero-double-helix B formation. The solution was allowed to settle at room temperature for 4 days, during which time the Cotton effect at 315 nm was reversed from negative to positive, indicating an enantiomeric structure associated with the formation of C. Dynamic light scattering (DLS) experiments indicated average diameters of 0.62 nm for random-coil A and 8.7 nm for hetero-double-helix C (Fig. S2†). These experimental results from the (P)-1/(M)-3 system were consistent with those from the previously studied (M)-1/(P)-2 system, which indicates that such a structure change is caused by dispersed molecules in solution without forming higher aggregates.17
1 mixture of (P)-1 and (M)-3 (total 0.25 mM) in toluene at 70 °C was in the dissociated state 2A, which produced a weak Cotton effect (Fig. S1a†). Cooling the solutions to 5 °C caused a negative Cotton effect to appear at 315 nm. UV-vis showed a decrease in intensity and a shift of the absorption maximum from 295 nm to 305 nm (Fig. S1b†). These results are consistent with hetero-double-helix B formation. The solution was allowed to settle at room temperature for 4 days, during which time the Cotton effect at 315 nm was reversed from negative to positive, indicating an enantiomeric structure associated with the formation of C. Dynamic light scattering (DLS) experiments indicated average diameters of 0.62 nm for random-coil A and 8.7 nm for hetero-double-helix C (Fig. S2†). These experimental results from the (P)-1/(M)-3 system were consistent with those from the previously studied (M)-1/(P)-2 system, which indicates that such a structure change is caused by dispersed molecules in solution without forming higher aggregates.17
The equilibrium-shifted S-states for B and C in fluorobenzene, a solvent that promotes aggregate formation, were also determined (Fig. S3†).17 A fluorobenzene solution of (P)-1/(M)-3 (total 0.5 mM) was heated to 70 °C and then cooled to 20 °C to provide a solution of B. This B solution was allowed to settle for 3 days, during which time it converted to a solution of C. The same experiment was conducted at a higher concentration of 1.0 mM, and identical CD and UV-vis spectra were obtained at 0.5 and 1.0 mM for both B and C. The solutions were determined to be in the equilibrium-shifted S-states, not containing other species, with the Δε (315 nm) values of −359 cm−1 M−1 for B and +280 cm−1 M−1 for C. As previously noted in the (M)-1/(P)-2 system,17B and C in the S-states showed enantiomeric CD spectra.
Thermal hysteresis experiment
A complex structural change was observed for the (P)-1/(M)-3 system in experiments upon cooling and heating at constant rates in toluene, which was not previously observed in the (P)-1/(M)-2 system. A 1![[thin space (1/6-em)]](https://www.rsc.org/images/entities/char_2009.gif) :
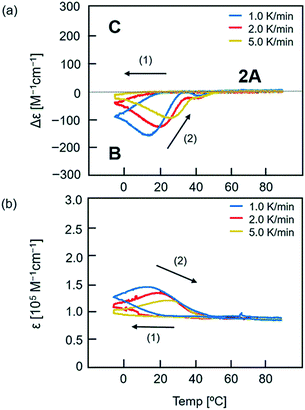
:![[thin space (1/6-em)]](https://www.rsc.org/images/entities/char_2009.gif) 1 mixture of (P)-1 and (M)-3 (total 0.25 mM) in toluene at 90 °C consisted of dissociated 2A. The solution was cooled to −5 °C at a rate of 2.0 K min−1 and then heated to 90 °C. The process was monitored by observing Δε at 315 nm in CD and ε at 315 nm in UV-vis (Fig. 3, red lines). Upon cooling, Δε monotonically decreased to −42 cm−1 M−1 at −5 °C. Upon heating, Δε decreased to −124 cm−1 M−1 at 20 °C, which indicated the formation of B (Fig. 3a). Above 20 °C, Δε increased, reached −25 cm−1 M−1 at 35 °C, and then decreased slightly at 40 °C. Further heating increased Δε, and produced dissociated 2A at 60 °C. It was noted that heating of a solution of B did not monotonically provide 2A, and an upward inflation appeared at 35 °C in Δε (315 nm)/temperature profiles. Such a phenomenon was observed at 0.2 mM but not at 0.1 or 0.5 mM (Fig. S4†). The thermal hysteresis of the (P)-1/(M)-3 system is different in shape from those of (P)-1/(M)-2 and (P)-2/(M)-3 systems (Fig. S5†).17
1 mixture of (P)-1 and (M)-3 (total 0.25 mM) in toluene at 90 °C consisted of dissociated 2A. The solution was cooled to −5 °C at a rate of 2.0 K min−1 and then heated to 90 °C. The process was monitored by observing Δε at 315 nm in CD and ε at 315 nm in UV-vis (Fig. 3, red lines). Upon cooling, Δε monotonically decreased to −42 cm−1 M−1 at −5 °C. Upon heating, Δε decreased to −124 cm−1 M−1 at 20 °C, which indicated the formation of B (Fig. 3a). Above 20 °C, Δε increased, reached −25 cm−1 M−1 at 35 °C, and then decreased slightly at 40 °C. Further heating increased Δε, and produced dissociated 2A at 60 °C. It was noted that heating of a solution of B did not monotonically provide 2A, and an upward inflation appeared at 35 °C in Δε (315 nm)/temperature profiles. Such a phenomenon was observed at 0.2 mM but not at 0.1 or 0.5 mM (Fig. S4†). The thermal hysteresis of the (P)-1/(M)-3 system is different in shape from those of (P)-1/(M)-2 and (P)-2/(M)-3 systems (Fig. S5†).17
The upward inflation of Δε in the (P)-1/(M)-3 system in toluene (total 0.25 mM) also appeared at the temperature change rates of 1.0 and 5.0 K min−1, but was enhanced at slower temperature change rates (Fig. 3a). Correspondingly, at a very low temperature change rate of 0.1 K min−1, a significant upward inflation was observed (Fig. S6†). In an experiment with cooling to −10 °C instead of −5 °C, a slight upward inflation appeared (Fig. S7†).
Temperature oscillation experiment
When the temperature was oscillated, the upward inflations were amplified and occurred twice during a single cycle (Fig. 4). A solution of dissociated 2A (total 0.25 mM) of (P)-1/(M)-3 at 70 °C was cooled to −5 °C at a rate of 2.0 K min−1, and the temperature was oscillated between 38 °C and −5 °C at a rate of 2.0 K min−1. Different cooling and heating curves were obtained depending on the number of temperature oscillation cycles as shown in the Δε (315 nm)/temperature profiles, and Δε gradually increased with cycles (Fig. 4a). Downward inflations at 20–30 °C appeared in the initial cooling and two upward inflations at approximately 30 and 0 °C in the third and later heating cycles. It was determined that B and C in the S-states showed enantiomeric CD spectra with essentially identical intensities (Fig. S3†). Then, the increase in Δε with repeated cycles is due to the increase in the concentration of C and decrease in that of B, which is consistent with C being thermodynamically more stable than B (Fig. S1 and S3†). The nonlinear properties of the thermal response became clear when the fourth temperature oscillation cycle was extracted (Fig. 4b). During a single heating and cooling cycle, Δε increased twice at 30 and 5 °C and decreased once at 23 °C. It should also be noted that the equilibrium curve, which will be described later, was significantly and repeatedly crossed during temperature oscillation (Fig. 4a and b).21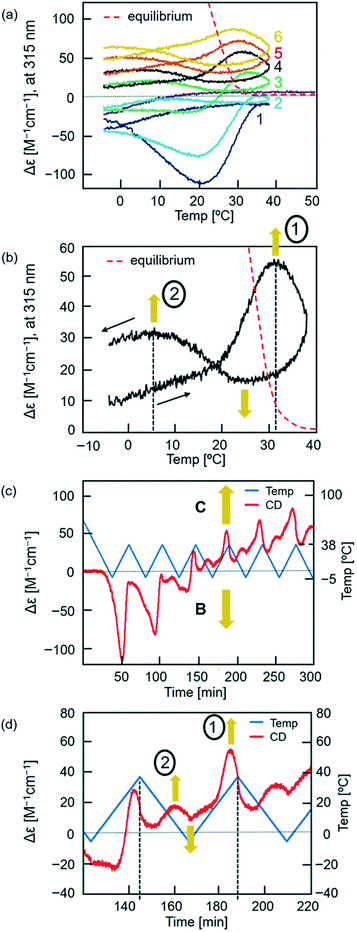 | ||
Fig. 4 Chemical CD oscillation phenomenon of (P)-1/(M)-3 (1![[thin space (1/6-em)]](https://www.rsc.org/images/entities/char_2009.gif) : :![[thin space (1/6-em)]](https://www.rsc.org/images/entities/char_2009.gif) 1) in toluene (total 0.25 mM) at a heating/cooling rate of 2.0 K min−1. The temperature was decreased from 70 °C to −5 °C, and then oscillated 6 times between −5 °C and 38 °C. The results are shown (a) in the Δε (315 nm)/temperature profiles, (b) in the fourth heating and cooling cycle, (c) in Δε (315 nm)/time profiles and (d) in the fourth heating and cooling cycle. Two Δε maxima, 1 and 2, are shown in (b and d). Equilibrium curves are shown by red dashed lines in (a and b), which were obtained from Fig. S18.† Orange arrows in (b–d) indicate self-catalytic amplifications. 1) in toluene (total 0.25 mM) at a heating/cooling rate of 2.0 K min−1. The temperature was decreased from 70 °C to −5 °C, and then oscillated 6 times between −5 °C and 38 °C. The results are shown (a) in the Δε (315 nm)/temperature profiles, (b) in the fourth heating and cooling cycle, (c) in Δε (315 nm)/time profiles and (d) in the fourth heating and cooling cycle. Two Δε maxima, 1 and 2, are shown in (b and d). Equilibrium curves are shown by red dashed lines in (a and b), which were obtained from Fig. S18.† Orange arrows in (b–d) indicate self-catalytic amplifications. | ||
UV-vis analysis provided ε (315 nm)/temperature profiles, in which heating and cooling curves converged with repeated cycles (Fig. S11b†). It was determined that B and C gave essentially identical UV-vis spectra in the S-state (Fig. S3†). These results indicate that the oscillation of Δε is derived from the oscillation of the ratio of [B] and [C].
The Δε/temperature profiles were converted to Δε/time profiles, which confirmed that the oscillation of Δε was induced by the temperature oscillation (Fig. 4c and S8†). Two initial heating and cooling cycles showed downward inflation of Δε, which switched to upward inflation in the third and later cycles. In addition, two Δε maxima appeared in the third and later cycles in response to a single temperature oscillation between −5 and 38 °C. Expansion of the fourth cycle showed two Δε maxima, 1 and 2 (Fig. 4d). Such a chemical CD oscillation phenomenon is unprecedented in a chemical reaction.
Effect of the temperature change rate in temperature oscillation
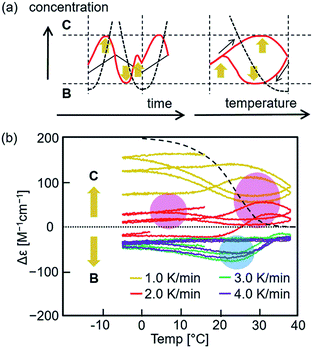
The effect of temperature oscillation rate was examined between −5 and 38 °C (Fig. 5a and S10–S13†). At the higher rates of 3.0 and 4.0 K min−1, a damped oscillation of Δε occurred approaching Δε 0 cm−1 M−1, in which a downward oscillation of Δε continuously occurred during heating. At a lower rate of 1.0 K min−1, downward oscillation occurred in the initial cycles during heating, which switched to an upward oscillation during cooling. At 1.0, 3.0, and 4.0 K min−1, a single heating and cooling cycle provided a single oscillation of Δε. The chemical CD oscillation was observed at 2.0 K min−1, in which a single heating and cooling cycle provided two Δε maxima. This can be regarded as a chemical resonance phenomenon, in which chemical CD oscillation occurs only at a specific temperature oscillation rate (Fig. 5b). Such a resonance phenomenon is common in electronics, whereas resonance in a chemical reaction subjected to a temperature oscillation as shown in this study is notable. The effect of the temperature oscillation range was examined, and chemical CD oscillation occurred between −5 °C and 30/45 °C (Fig. S14–S17†).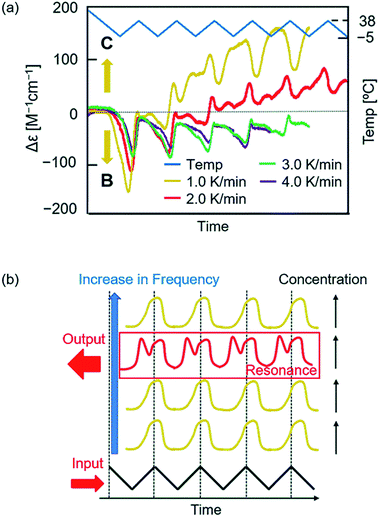 | ||
Fig. 5 Chemical resonance phenomenon of (P)-1/(M)-3 (1![[thin space (1/6-em)]](https://www.rsc.org/images/entities/char_2009.gif) : :![[thin space (1/6-em)]](https://www.rsc.org/images/entities/char_2009.gif) 1) in toluene (total 0.25 mM) at heating and cooling rates of 1.0 K min−1 (yellow line), 2.0 K min−1 (red line), 3.0 K min−1 (green line), and 4.0 K min−1 (purple line). Experimental data are shown in Fig. S10 to S13.† To compare different temperature change rate experiments, time was normalized by temperature oscillation (blue line). The results are shown (a) in Δε (315 nm)/time profiles and (b) in an explanation. Orange arrows in (a) indicate self-catalytic amplifications. 1) in toluene (total 0.25 mM) at heating and cooling rates of 1.0 K min−1 (yellow line), 2.0 K min−1 (red line), 3.0 K min−1 (green line), and 4.0 K min−1 (purple line). Experimental data are shown in Fig. S10 to S13.† To compare different temperature change rate experiments, time was normalized by temperature oscillation (blue line). The results are shown (a) in Δε (315 nm)/time profiles and (b) in an explanation. Orange arrows in (a) indicate self-catalytic amplifications. | ||
Determination of equilibrium states
Equilibrium states (red dashed lines in Fig. 4a and b) were determined at different temperatures of (P)-1/(M)-3 (1![[thin space (1/6-em)]](https://www.rsc.org/images/entities/char_2009.gif) :
:![[thin space (1/6-em)]](https://www.rsc.org/images/entities/char_2009.gif) 1) in toluene (total 0.25 mM) for Δε at 315 nm employing constant-temperature (isothermal) procedures. A cooling experiment was conducted for 2A (Fig. S18†). Solutions were heated to 70 °C to form 2A, cooled to 60, 50, 40, and 30 °C, and allowed to settle for 30 min. Then, the Δε values were determined to be between +5 and 0 cm−1 M−1. Another experiment was conducted by cooling to 25 °C and settling for 10 days, which provided Δε +67 cm−1 M−1. A heating experiment was conducted for C (Fig. S18 and S19†). Solutions were heated to 70 °C, cooled to 5 °C, and allowed to settle for 4–8 days, which resulted in Δε +195 cm−1 M−1 indicating the formation of C. Then, the solutions were heated to 20, 25, and 30 °C, and allowed to settle for 3–8 days, during which Δε decreased to +150, +70, and +16 cm−1 M−1, respectively. Then, the isothermal procedures at 30 °C employing cooling and heating experiments indicated that the equilibrium state was between 0 and +16 cm−1 M−1; isothermal experiments at 25 °C indicated that the equilibrium state was between +67 and +70 cm−1 M−1. An equilibrium curve was drawn between 20 and 50 °C in the Δε/temperature profile (Fig. 4a and b). Notably, the curves obtained for experiments on temperature oscillation significantly and repeatedly crossed the equilibrium curve, which is referred to as equilibrium crossing.21
1) in toluene (total 0.25 mM) for Δε at 315 nm employing constant-temperature (isothermal) procedures. A cooling experiment was conducted for 2A (Fig. S18†). Solutions were heated to 70 °C to form 2A, cooled to 60, 50, 40, and 30 °C, and allowed to settle for 30 min. Then, the Δε values were determined to be between +5 and 0 cm−1 M−1. Another experiment was conducted by cooling to 25 °C and settling for 10 days, which provided Δε +67 cm−1 M−1. A heating experiment was conducted for C (Fig. S18 and S19†). Solutions were heated to 70 °C, cooled to 5 °C, and allowed to settle for 4–8 days, which resulted in Δε +195 cm−1 M−1 indicating the formation of C. Then, the solutions were heated to 20, 25, and 30 °C, and allowed to settle for 3–8 days, during which Δε decreased to +150, +70, and +16 cm−1 M−1, respectively. Then, the isothermal procedures at 30 °C employing cooling and heating experiments indicated that the equilibrium state was between 0 and +16 cm−1 M−1; isothermal experiments at 25 °C indicated that the equilibrium state was between +67 and +70 cm−1 M−1. An equilibrium curve was drawn between 20 and 50 °C in the Δε/temperature profile (Fig. 4a and b). Notably, the curves obtained for experiments on temperature oscillation significantly and repeatedly crossed the equilibrium curve, which is referred to as equilibrium crossing.21
Domain analysis
An explanation of the chemical CD oscillation phenomenon is provided, which is caused by the competition between self-catalytic 2A + B-to-2B and 2A + C-to-2C reactions (Fig. 1c and 6a). At an oscillation rate of 2.0 K min−1, the competition between the two self-catalytic reactions resulted in two Δε maxima, 1 and 2, and a minimum in a single heating and cooling cycle (Fig. 4b and d). For the large Δε maximum 1 during heating, the self-catalytic 2A + C-to-2C reaction predominates, and Δε increases. For the small maximum 2 during cooling, the same reaction predominates. For the large minimum during cooling, the self-catalytic 2A + B-to-2B reaction predominates, and Δε decreases. The competition between the two amplified chemical reactions induces sharp switching between the concentrations of B and C. An explanation for the chemical CD oscillation phenomenon is also provided by orange arrows in Fig. 6a.The rate of a self-catalytic reaction is then highly dependent on the temperature and concentration of products or the catalysts B and C. Domains can be shown in Δε/temperature profiles, where B and C formation reactions predominate. Experiments with different rates (Fig. 5a) were overlaid (Fig. 6b and S20†), and B and C formation domains are shown as indicated by the downward inflation (blue shade) and upward inflation (red shade) of Δε, respectively. The formation of B is accelerated at a domain centered at 20 °C with Δε −100 cm−1 M−1, and the formation of C is accelerated at domains centered at 30 and 5 °C with Δε +100 cm−1 M−1. This result is consistent with the two Δε maxima, 1 and 2, and one minimum observed in the Δε/temperature profiles (Fig. 4b, d, and 6a).
With regard to the chemical resonance phenomenon, at a low temperature oscillation rate of 1.0 K min−1, the self-catalytic 2A + C-to-2C reaction predominates, and Δε increases with the temperature oscillation rate; at a high temperature oscillation rate of 3.0 and 4.0 K min−1, the self-catalytic 2A + B-to-2B reaction predominates, and Δε does not change significantly with the temperature oscillation rate; at an intermediate oscillation rate of 2.0 K min−1, both self-catalytic reactions compete.
It was also noted that changes in concentrations occur significantly on both sides of the equilibrium curve, which is the lowest valley in a potential surface formed in concentration/temperature profiles (Fig. 6b). These changes depend on the rate of temperature oscillation, and equilibrium crossing occurs at relatively low rates of 1.0 and 2.0 K min−1. In contrast at higher rates of 3.0 and 4.0 K min−1, changes in concentrations occur in the domains far from the equilibrium curve. The nature of competitive systems involving self-catalytic amplification chemical reactions is noted, which occurs during crossing of chemical equilibrium.
Conclusions
To summarize, a pseudoenantiomeric mixture of aminomethylenehelicene oligomers (P)-tetramer (P)-1 and (M)-hexamer (M)-3 exhibits chemical CD oscillation and chemical resonance phenomena, which are derived from molecules dispersed in solution without forming higher aggregates. These notable chemical phenomena are derived from the competition between two self-catalytic 2A + C-to-2C and 2A + B-to-2B reactions that provide different products, C and B, respectively, in an amplified manner. The phenomenon of equilibrium crossing is also observed.Conflicts of interest
There are no conflicts to declare.Acknowledgements
This work was financially supported by the Grants-in-Aid for Scientific Research (No. 17H03050 and 17H08203) from the Japan Society for the Promotion of Science (JSPS). T. S. thanks the JSPS for a Fellowship for Young Japanese Scientists (No. 18J10706). N. S. thanks the Sumitomo Foundation for financial support.Notes and references
- P. Atkins and J. de Paula, Physical Chemistry, Oxford University Press, Oxford, 10th edn, 2014 Search PubMed.
- P. L. Houston, Chemical Kinetics and Reaction Dynamics, Dover Publications, Inc., New York, 2006 Search PubMed.
- R. A. van Santen and J. W. Niemantsverdriet, Chemical Kinetics and Catalysis, Plenum Press, New York, 1995 Search PubMed.
- R. P. Feynman, R. B. Leighton, and M. Sands, The Feynman Lectures on Physics, Addison-Wesley Publishing Co., Inc., MA, 1965, vol. 2 Search PubMed.
- F. S. Crawford Jr, Berkeley Physics Course, Education Development Center, Inc., MA, 1971, vol. 3 Search PubMed.
- N. Schinor, W. Hohmann, M. Kraus, J. Müller and F. W. Schneider, Phys. Chem. Chem. Phys., 1999, 1, 827–832 RSC.
- K. Otawara and L. T. Fan, J. Phys. Chem. A, 1997, 101, 9678–9680 CrossRef CAS.
- J. G. Lazar and J. Ross, Science, 1990, 247, 189–192 CrossRef CAS PubMed.
- J. M. Douglas and D. W. T. Rippin, Chem. Eng. Sci., 1966, 21, 305–315 CrossRef CAS.
- M. S. Samples, Y.-F. Hung and J. Ross, J. Phys. Chem., 1992, 96, 7338–7342 CrossRef CAS.
- For example of complex phenomena in aggregated states. P. Mineo, V. Villari, E. Scamporrino and N. Micali, J. Phys. Chem. B, 2015, 119, 12345–12353 CrossRef CAS PubMed.
- M. Wolffs, S. J. George, Z. Tomovic, S. C. J. Meskers, A. P. H. J. Schenning and E. W. Meijer, Angew. Chem., Int. Ed., 2007, 46, 8203–8205 CrossRef CAS PubMed.
- Y. Demirel, Non-Equilibrium Thermodynamics: Transport and Rate Processes in Physical, Chemical and Biological Systems, Elsevier, Amsterdam, 2nd edn, 2007 Search PubMed.
- I. R. Epstein and J. A. Pojman, An Introduction to Nonlinear Chemical Dynamics, Oxford University Press, New York, 1998 Search PubMed.
- K. S. Scott, Chemical Chaos, Oxford University Press, Oxford, 1991 Search PubMed.
- S. R. de Groot and P. Mazur, Non-Equilibrium Thermodynamics, Dover Publication, New York, 1984 Search PubMed.
- M. Shigeno, Y. Kushida and M. Yamaguchi, J. Am. Chem. Soc., 2014, 136, 7972–7980 CrossRef CAS PubMed.
- Y. Kushida, T. Sawato, M. Shigeno, N. Saito and M. Yamaguchi, Chem.–Eur. J., 2017, 23, 327–333 CrossRef CAS.
- Y. Kushida, T. Sawato, N. Saito, M. Shigeno, H. Satozono and M. Yamaguchi, ChemPhysChem, 2016, 17, 3283–3288 CrossRef CAS.
- Y. Kushida, N. Saito, M. Shigeno and M. Yamaguchi, Chem. Sci., 2017, 8, 1414–1421 RSC.
- M. Miyagawa, A. Yagi, M. Shigeno and M. Yamaguchi, Chem. Commun., 2014, 50, 14447–14450 RSC.
Footnote |
| † Electronic supplementary information (ESI) available: Full experimental details including general methods, CD, UV-vis, and DLS analyses. See DOI: 10.1039/c8sc03109f |
| This journal is © The Royal Society of Chemistry 2019 |

